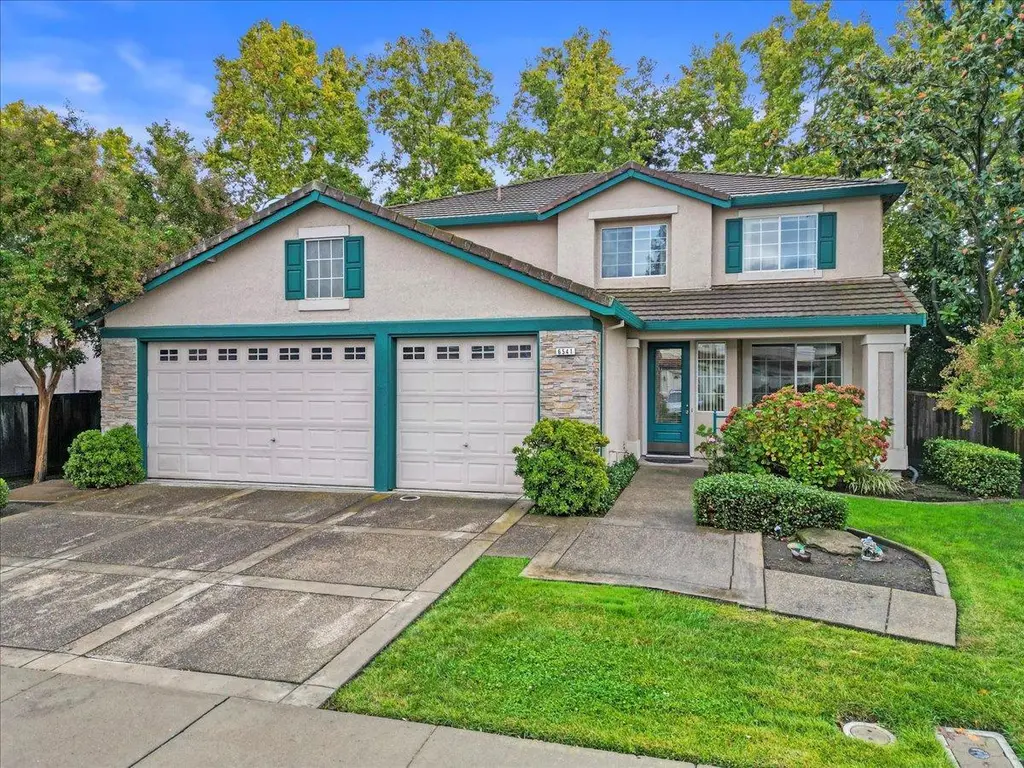
6541 Brook Hollow Cir · Stockton, CA
Flood risk 1/10 · Minimal
- FEMA flood zone
- X
- Chance of flooding over 30 yrs
- 0.0%
- Est. flood insurance / yr
- $507 – $1,088
Fire risk 1/10 · Minimal
- Est. fire insurance / yr
- $659 – $1,223
Heat risk 7/10 · Major
- Hot days now (above 103°F)
- 7 days/yr
- Hot days in 30 yrs
- 15 days/yr
Wind risk 1/10 · Minimal
- Chance of severe wind over 30 yrs
- —
Air-quality risk 10/10 · Severe
- Unhealthy air days now
- 22 days/yr
- Unhealthy air days in 30 yrs
- 24 days/yr
Risk factors via First Street. Map © Google.
Why this score? — see what drove the D grade
The composite is a weighted blend of 9 inputs, each scored 0–100. Each bar is that input's sub-score; the figure is the points it added to the 100-point composite (weight × sub-score).
- ARV discount +13.6/15.0
- Appreciation +10.0/10.0
- Cash flow +4.6/30.0
- Rent growth +3.5/5.0
- Schools +3.0/10.0
- Livability +2.9/5.0
- Condition / age +2.5/5.0
- 1% rule +0.4/10.0
- DSCR +0.0/10.0
$600,000
🖨 Deal sheet (PDF) 📄 Offer letter ✓ Due diligence
Listing remarks
PRICE REDUCED! Exceptional Value in Brookside - Spacious 5-Bedroom Home! Welcome to this impressive home located behind the gates in the highly desirable Brookside Estates community! This beautifully designed 5-bedroom residence offers exceptional value and a floor plan that blends comfort, functionality, and style. Step inside to find an inviting layout with ample living space perfect for families or those who love to entertain. The upstairs loft provides a versatile areaideal for a playroom, home office, or additional lounge. Enjoy the exclusive amenities of the Brookside HOA, including 24-hour security services, a sparkling community pool, tennis courts, exterior maintenance, and recrea
Key facts
- Upstairs loft
- Community pool
- Tennis courts
Tags
Neighborhood map
What this means for you Summary
Snapshot
- This is a 5-bed/3.5-bath single-family listed at $600k.
Deal economics
- At list price, monthly cash flow is $-2k ($-18k/yr) — negative.
- To cash-flow at today's rent, offer at most $331k (44.8% below list).
- To meet the 1% rule (rent ≥ 1% of price), the offer needs to be $326k (45.7% below list).
- Recommended offer: $326k (45.7% below list) — sets the bar for 1% rule.
Location & tenants
- Location reads 57/100 on livability (#734 in CA) — a working-class tenant base; expect higher turnover. Strengths: housing A+, health & safety A, amenities A-; Watch: employment C-, crime F, commute F.
- Lincoln Unified (urban): math 26% / reading 41% proficiency, ranked #284 of 517 in CA (top 55%) — families likely to look elsewhere, expect single-tenant / working-renter base with shorter leases.
- Zoned schools: Brookside (math 57% / reading 61%, grade B-, #257 of 1,571 statewide, top 17%, 731 students, 37% FRL); Sierra Middle (math 25% / reading 48%, grade F, #175 of 498 statewide, top 36%, 572 students, 73% FRL); Lincoln High (math 35% / reading 64%, grade D, #352 of 1,170 statewide, top 31%, 2,936 students, 53% FRL) — zoned schools at 54% FRL track the district average.
- Zoned-school proficiency averages 48% at this address vs 34% district-wide (+15 pts) — the actual schools serving this property are materially stronger than the Lincoln Unified average implies; a family-tenant draw the district grade alone would hide.
- Market conditions: Rents rising fast (+4.2%/yr); 217 active listings in the ZIP; 4 comparable units currently listed for rent nearby; rentals lingering (median 46d on market — plan ~5-8 weeks vacancy on turnover, expect pricing pressure); 50% of comp listings sitting > 30 days — soft ceiling on asking rent; high-income renter base; 3,779 units permitted in San Joaquin County in 2024 (0 in 5+ unit buildings).
- This rent runs 35% of the median local income ($112k/yr) — at the standard rent-burdened threshold; future hikes will face affordability resistance.
Forward outlook
- In year one you build about $64k of equity ($4k loan paydown + $60k appreciation (10.0% local appreciation)).
- San Joaquin County population projected at +17% by 2050 — long-run rental-demand tailwind backs the buy-and-hold thesis.
- By year 2, paydown + projected appreciation supports a ~$103k cash-out refi (75% LTV) — recoverable capital for the next deal without selling this one.
Negotiation context
- It's been on market 200 days — a 12% lower offer ($528k) is reasonable based on typical stale-listing flexibility.
- Current owner paid $475k; 26% above their basis — modest negotiation headroom, anchor on the comps not their cost.
Risks & watch-outs
- Climate carrying-cost: extreme-heat days projected 7→15/yr by 2055 (HVAC capex compounding) — expect insurance premiums to compound above CPI over the hold.
Questions for the listing agent
- What do current leases actually rent for vs. the listed asking? Can we see a recent rent roll and the last 12 months of T-12 income?
- It's been on market 200 days. Have you received any prior offers? Is the seller open to a 46% concession, seller financing, or rate buy-down credit?
- What does the HOA fee cover, when was the last increase, and are there any pending special assessments or reserve-fund shortfalls?
- Why hasn't it sold? Are there any deal-killer items the seller is aware of (foundation, flood, title, zoning, code violations)?
- Is there a deadline driving the sale (1031 exchange, divorce, estate, relocation)? That informs how much negotiation room exists.
- Schools are D-rated, which usually means shorter tenancies and higher turnover. Who's the typical renter profile here, and what's been the actual vacancy rate?
- Crime grade is F in this area — have there been break-ins, vandalism, or insurance claims at this property in the last 3 years? What carrier currently insures it and at what premium?
- The area grade is low — what's the realistic commute time and amenity access for the typical tenant pool here? Any planned neighborhood developments (good or bad) we should know about?
- What's the average days-on-market for RENTAL listings here right now (not sales)? A rising rental-DOM trend means longer vacancies and softer asking-rent achievability than the comps imply.
- What's the recent tenant-quality profile in this submarket — average credit score on applications, eviction rate, late-payment / NSF rate, and stable-employment percentage? A property-management company in the area should have these aggregated.
- How much new for-sale + rental construction is in the pipeline within 1–3 miles? Heavy new supply typically softens prices + rents 12–24 months out; constrained supply supports both.
Investment metrics
- 1% rule
- 0.54% ✗
- Cap rate
- 3.25%
- Cash-on-cash
- -10.87%
- DSCR
- 0.52
- GRM
- 15.3
CMA / ARV
- ARV (median comp)
- $694,534
- List price
- $600,000
- Delta
- -13.61%
- Verdict
- UNDERPRICED
- Comps
- 20 within 1.0 mi
Show comp detail 10 sales within ~0.75 mi
| Address | Dist | Beds/Ba | Sqft | Sold | Price | $/sf | Match |
|---|---|---|---|---|---|---|---|
| 6324 Riverbank Cir | 0.20mi | 5/3.5 | 3,229 (-3%) | 4mo | $715,000 | $221 | 83 |
| 6243 Riverbank Cir | 0.15mi | 4/4.0 (-1) | 3,238 (-2%) | 2mo | $930,000 | $287 | 80 |
| 3864 Fourteen Mile Dr | 0.38mi | 4/4.0 (-1) | 3,400 (+2%) | 1mo | $1,100,000 | $324 | 70 |
| 3604 Fourteen Mile Dr | 0.26mi | 5/3.0 | 3,522 (+6%) | 7mo | $1,100,000 | $312 | 70 |
| 4227 Steamboat Cove Ln | 0.52mi | 5/4.0 | 3,492 (+5%) | 12mo | $750,000 | $215 | 55 |
| 3152 Sea Gull Ln | 0.41mi | 6/3.5 (+1) | 3,765 (+13%) | 3mo | $765,000 | $203 | 51 |
| 6268 Chesapeake Cir | 0.53mi | 5/3.0 | 3,044 (-8%) | 14mo | $690,000 | $227 | 48 |
| 6248 Chesapeake Cir | 0.51mi | 5/3.0 | 3,790 (+14%) | 10mo | $1,000,000 | $264 | 42 |
| 4010 Pine Lake Cir | 0.67mi | 6/3.5 (+1) | 3,172 (-4%) | 20mo | $690,000 | $218 | 40 |
| 3818 Portsmouth Pt | 0.51mi | 4/3.0 (-1) | 2,834 (-15%) | 21mo | $850,000 | $300 | 27 |
Match score weights: distance 35% · size 25% · config 20% · recency 20%. Top-matched comps best support the ARV.
Projected returns pro-forma
10.0% appreciation · 4.16% rent growth · sell at horizon
- IRR
- 16.9%
- Equity multiple
- 2.39×
- Total profit
- $233,684
- Equity at exit
- $540,528
- IRR
- 16.3%
- Equity multiple
- 5.60×
- Total profit
- $772,638
- Equity at exit
- $1,165,668
Cash invested: $168,000 (down + closing). Projections, not guarantees.
Landlord ↔ Tenant lean methodology
- Overall (STATE)
- 18 Strongly Tenant-Friendly
- State California
- 18 Strongly Tenant-Friendly · D+13
- County
- — inherits STATE
- City
- — inherits STATE
ZIP-level market 95219
- Home prices YoY
- 6.6%
- Rents YoY
- 4.2%
- Active inventory
- 217
- Price-to-rent
- 15.3×
Monthly cashflow live
- Estimated rent
- $3,261 medium interval (Pro) →
- Mortgage (P&I)
- −$3,146
- Tax from tax record
- −$458 /mo · $5,493/yr
- Insurance
- −$250
- HOA
- −$244
- Vacancy / Maint / Mgmt
- −$685
- Net cashflow
- $-1,522
Break-even live
Sensitivity live
| Price | -10% $-1,183 | -5% $-1,353 | +0% $-1,522 | +5% $-1,692 | +10% $-1,862 |
|---|---|---|---|---|---|
| Rent | -10% $-1,780 | -5% $-1,651 | +0% $-1,522 | +5% $-1,394 | +10% $-1,265 |
| Rate | -1.0pp $-1,220 | -0.5pp $-1,370 | base $-1,522 | +0.5pp $-1,678 | +1.0pp $-1,836 |
UW: 25.0% down · 7.5% · 30yr · 1.5% tax · 5.0% vac · 8.0% maint · 8.0% mgmt
Financing live
Cash to close
- Down payment
- $150,000
- Closing costs
- $18,000
- Reserves months
- —
- Total cash needed
- —
Loan-product check · same deal, 3 products live
Conventional
25% down · 7.5% · 30yr
- Down + closing
- —
- Monthly P&I
- —
- Monthly cashflow
- —
- DSCR
- —
- Eligible?
- —
Personal DTI + credit; lowest rate.
DSCR
20% down · 8.5% · 30yr
- Down + closing
- —
- Monthly P&I
- —
- Monthly cashflow
- —
- DSCR
- —
- Eligible?
- —
No personal income docs; deal must DSCR.
Hard money
10% down · 12.0% · 12mo
- Down + closing
- —
- Monthly P&I
- —
- Monthly cashflow
- —
- DSCR
- —
- Eligible?
- —
Short-term bridge; refi at stabilization.
Rent comps 4 comps
| Address | Beds | Baths | Sqft | Rent | $/sqft | DOM | Units | Dist |
|---|---|---|---|---|---|---|---|---|
| 3906 Brook Valley Cir Stockton, CA | 4.0 | 3.0 | 2426 | $3,100 | $1.28 | 46d | 1 | 0.07mi |
| 5049 Pine Lake Ct Stockton, CA | 5.0 | 3.0 | 4124 | $3,450 | $0.84 | 5d | 1 | 0.58mi |
| 3616 Wood Duck Cir Stockton, CA | 5.0 | 3.0 | 2302 | $7,500 | $3.26 | 25d | 1 | 0.91mi |
| 5956 Saint Andrews Dr Stockton, CA | 4.0 | 2.5 | 3345 | $3,300 | $0.99 | 46d | 1 | 1.33mi |
HOA detail
- Monthly dues
- $244 · $2,928/yr
- Likely covers
- exterior maint.poolsecurity
Listing history 9 events
-
2026-06-08status $600,000 Pending 200 DOM
-
2026-06-07days on market $600,000 Active 200 DOM
-
2026-06-03days on market $600,000 Active 196 DOM
-
2026-06-03days on market $600,000 Active 195 DOM
-
2026-06-01days on market $600,000 Active 194 DOM
-
2026-05-31days on market $600,000 Active 193 DOM
-
2024-09-27historical $3,200
-
2024-08-09$3,200
-
2003-08-08soldstatus $475,000
ⓘ Source: listings_history table (triggers on properties + properties_extension) + one-shot
backfill from property_details.listing_events for pre-trigger history.
Tax reassessment forecast CA · Resets to sale price
- Current annual tax
- $5,493 · $458/mo
- Projected year-2 tax
- $5,493 · $458/mo
- Expected delta
- $0/yr ($0/mo · 0.0%)
ⓘ Screening estimate from a state-policy table — verify with the county assessor before closing.
Climate risk First Street
- Flood 1/10 Low FEMA zone X · 0% chance over 30 yrs
- Wildfire 1/10 Low
- Heat 7/10 Severe 7 d/yr ≥103°F today · 15 d/yr by 30 yrs out
- Wind 1/10 Low
- Air quality 10/10 Extreme 22 unhealthy d/yr today · 24 by 30 yrs out
Nearby sold comps map
Loading sold comps map…
Walkable amenities ~0.75 mi
Loading nearby amenities…
Taxation est. · year 1
- Rental income
- $39,126
- − Mortgage interest
- −$33,609
- − Property taxes
- −$5,493
- − Insurance
- −$3,000
- − Repairs & maintenance
- −$3,130
- − Management
- −$3,130
- − HOA
- −$2,928
- − Depreciation
- −$17,455
- Taxable loss
- −$29,618
- Est. tax savings @ 24.0%
- +$7,108
- After-tax cash flow
- $-11,160/yr
For passive investors: Depreciation is non-cash, so a rental often shows a tax loss while cash-flowing — sheltering income. Rental losses are passive: they offset passive income freely, and up to $25,000/yr can offset ordinary (W-2) income if you actively participate and your MAGI is under $100k (phasing out to $0 by $150k); unused losses carry forward. On sale, claimed depreciation is recaptured at up to 25%, and gains may owe capital-gains tax (a 1031 exchange can defer both). Figures are a year-1 estimate at your 24.0% rate — not tax advice; consult a CPA.
Schools (NCES district)
- District
- Lincoln Unified
- NCES district ID
- 0621690
- Math proficiency
- 26% ▼ -11.00%
- Reading proficiency
- 41% ▼ -11.00%
- Median HH income
- $56,356
- Composite
- 29.66/100
- National rank
- #6465
- State rank
- #284 of 517 in CA
Livability — Stockton
- Score
- 57/100
- State rank
- #734
- US rank
- #21638
Category grades
Schools grade is shown separately in the Schools card above.
Census & demographics
- Census place
- Stockton, CA
- County
- San Joaquin County · 729,570 people
- City population
- 332,006
- Metro
- Stockton, CA
- Population (ZIP)
- 31,713
- Household income
- $112,268
- Rent vs Own
- Severe rent burden
- 825.0
Population outlook (San Joaquin County) Hauer SSP2
- Today (2025)
- 796,965 people
- By 2030
- 828,849 · +4.0%
- By 2040
- 885,611 · +11.1%
- By 2050
- 929,798 · +16.7%
- By 2075
- 994,578 · +24.8%
- By 2100
- 971,291 · +21.9%
Race, ethnicity, and origin ACS 2023
- Neighborhood character
- Highly diverse neighborhood (Simpson 0.75)
- Race & ethnicity
- White 33% Hispanic / Latino 30% Asian 21% Two or more races 18% Black 9%
- Hispanic origin (detail)
- Mexican 27%
- Common ancestry
- Slovak 2% Italian 2% Portuguese 1%
- Foreign-born
- 20% · Canada, China, Vietnam
- Languages at home
- 69% English-only · Spanish 14% Other Indo-European 4% Other Asian/Pacific 4%
Political lean MEDSL · San Joaquin
- 2024 margin
- Toss-up / Even · D 48.0% · R 48.9% · Other 3.0%
- 2008→2024 swing
- -11.6pp toward R · 2008: 10.7pp · 2024: -0.9pp
- All cycles
- 2024: R+0.9 2020: D+13.9 2016: D+12.9 2012: D+8.9 2008: D+10.7
Not yet ingested
- Civics
- —
Market trends
- HPI YoY
- ▲ 69.26%
- Current HPI
- 1122.61
- Rent YoY
- ▲ 4.16%
- Metro
- Stockton, CA
- State GDP YoY
- ▲ 3.21%
- F500 in state
- 116
Industry mix (Fortune 500 HQ in CA)
| Industry | F500 HQs | Revenue |
|---|---|---|
| Technology | 27 | $1,492B |
|
||
| Financial Services | 3 | $174B |
|
||
| Retail | 3 | $44B |
|
||
| Insurance | 3 | $26B |
|
||
| Media / Entertainment | 2 | $115B |
|
||
| Pharmaceuticals / Biotech | 2 | $62B |
|
||
Price history
-99.3% since first listed3 events — show timeline
- 2024-09-27 Rental Removed $3,200 APPFOLIO
- 2024-08-09 Listed for Rent $3,200 APPFOLIO
- 2003-08-08 Sold (Public Records) $475,000 Public Records
Property tax history
-1.1%/yrLatest (2025): $5,493 · +2.2% YoY. Source: county tax records.
Cash-flow waterfall
monthlySold comps — $/sqft
last 12 mo · ≤1 miLoading sold comps…