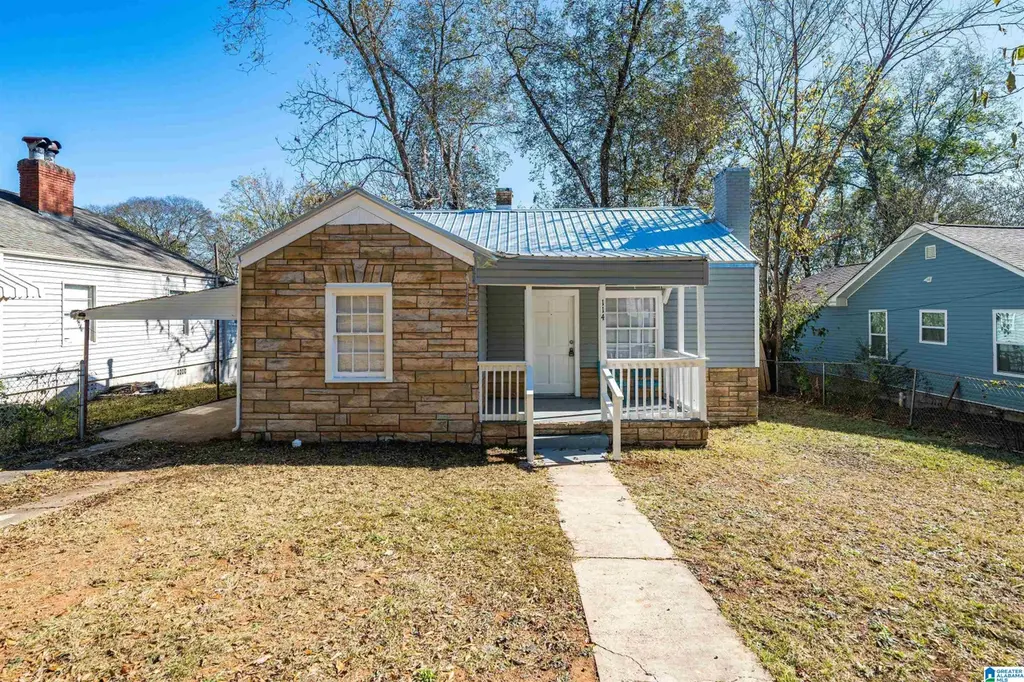
114 Pine St · Hueytown, AL
Flood risk 1/10 · Minimal
- FEMA flood zone
- X (unshaded)
- Chance of flooding over 30 yrs
- 0.0%
- Est. flood insurance / yr
- $507 – $1,088
Fire risk 2/10 · Minimal
- Est. fire insurance / yr
- $916 – $1,700
Heat risk 6/10 · Moderate
- Hot days now (above 108°F)
- 7 days/yr
- Hot days in 30 yrs
- 19 days/yr
Wind risk 6/10 · Moderate
- Chance of severe wind over 30 yrs
- 27.0%
Air-quality risk 3/10 · Minor
- Unhealthy air days now
- 3 days/yr
- Unhealthy air days in 30 yrs
- 5 days/yr
Risk factors via First Street. Map © Google.
Why this score? — see what drove the C grade
The composite is a weighted blend of 9 inputs, each scored 0–100. Each bar is that input's sub-score; the figure is the points it added to the 100-point composite (weight × sub-score).
- Cash flow +21.9/30.0
- ARV discount +7.4/15.0
- DSCR +7.0/10.0
- 1% rule +5.4/10.0
- Appreciation +4.7/10.0
- Rent growth +2.9/5.0
- Livability +2.9/5.0
- Condition / age +2.5/5.0
- Schools +1.8/10.0
$114,000
🖨 Deal sheet (PDF) 📄 Offer letter ✓ Due diligence
Listing remarks MLS
INVESTORS ONLY! TENANT OCCUPIED until October 2026
Key facts
- 6,534 sq ft lot
- Built 1945
- Listed 111 days
Neighborhood map
What this means for you Summary
Snapshot
- This is a 2-bed/1.0-bath single-family listed at $114k.
Deal economics
- At list price, monthly cash flow is $180 ($2k/yr) — positive.
- The deal already cash-flows at list — no discount required.
- Meets the 1% rule at list price ($1k rent vs $114k).
- Recommended offer: $104k (9.0% below list) — sets the bar for market timing.
- Cap rate 8.2% vs local median 5.9% in Hueytown — top-decile yield for the area; either an underpriced asset or a hidden risk that comps aren't pricing in. Stress-test before assuming the spread holds.
Location & tenants
- Location reads 57/100 on livability (#378 in AL) — a working-class tenant base; expect higher turnover. Strengths: cost of living A+, housing A+; Watch: employment D, crime F, amenities F.
- Jefferson County (suburban): math 9% / reading 32% proficiency, ranked #104 of 129 in AL (top 81%) — low school quality limits family demand, transient renter base, plan for 1-2y turnover.
- Zoned schools: Brighton School (math 5% / reading 15%, grade F, #566 of 627 statewide, top 90%, 365 students, 89% FRL); Pleasant Grove High School (math 0% / reading 18%, grade F, #260 of 305 statewide, top 85%, 729 students, 57% FRL) — zoned schools average 73% FRL vs 49% district-wide (24 pts higher); higher-poverty schools than district average — tighter screening recommended.
- Market conditions: Rents rising (+1.6%/yr); 255 active listings in the ZIP; 5 comparable units currently listed for rent nearby; rentals lingering (median 46d on market — plan ~5-8 weeks vacancy on turnover, expect pricing pressure); 60% of comp listings sitting > 30 days — soft ceiling on asking rent; 2,114 units permitted in Jefferson County in 2024 (556 in 5+ unit buildings).
Forward outlook
- In year one you build about $104 of equity ($788 loan paydown + $-684 appreciation (-0.6% local appreciation)).
- Jefferson County population projected to shrink 4% by 2050 — rents likely to lag national; underwrite the cash flow, not the appreciation.
- At projected returns (-0.6% appreciation + 1.6% rent growth), your $32k cash investment doubles in ~10 years — after that, you're playing with house money.
Negotiation context
- It's been on market 111 days — a 9% lower offer ($104k) is reasonable based on typical stale-listing flexibility.
- 3 sale attempts since 14y ago with the ask held roughly flat each time — persistent listings suggest the price (not the market) is what's stuck; bring a comps-based counter.
Risks & watch-outs
- Watch-outs: built in 1945 — expect roof / HVAC / electrical / plumbing capex.
- Climate carrying-cost: major wind risk, 27% chance of damaging wind over 30y; extreme-heat days projected 7→19/yr by 2055 (HVAC capex compounding) — expect insurance premiums to compound above CPI over the hold.
Questions for the listing agent
- It's been on market 111 days. Have you received any prior offers? Is the seller open to a 9% concession, seller financing, or rate buy-down credit?
- Built in 1945 — when were the roof, HVAC, electrical panel, plumbing, and water heater last replaced?
- Why hasn't it sold? Are there any deal-killer items the seller is aware of (foundation, flood, title, zoning, code violations)?
- Is there a deadline driving the sale (1031 exchange, divorce, estate, relocation)? That informs how much negotiation room exists.
- Schools are F-rated, which usually means shorter tenancies and higher turnover. Who's the typical renter profile here, and what's been the actual vacancy rate?
- Crime grade is F in this area — have there been break-ins, vandalism, or insurance claims at this property in the last 3 years? What carrier currently insures it and at what premium?
- What's the average days-on-market for RENTAL listings here right now (not sales)? A rising rental-DOM trend means longer vacancies and softer asking-rent achievability than the comps imply.
- What's the recent tenant-quality profile in this submarket — average credit score on applications, eviction rate, late-payment / NSF rate, and stable-employment percentage? A property-management company in the area should have these aggregated.
- How much new for-sale + rental construction is in the pipeline within 1–3 miles? Heavy new supply typically softens prices + rents 12–24 months out; constrained supply supports both.
Investment metrics
- 1% rule
- 1.04% ✓
- Cap rate
- 8.19%
- Cash-on-cash
- 6.78%
- DSCR
- 1.30
- GRM
- 8.0
CMA / ARV
- ARV (median comp)
- $113,683
- List price
- $114,000
- Delta
- 0.28%
- Verdict
- FAIR
- Comps
- 20 within 1.0 mi
Show comp detail 6 sales within ~0.75 mi
| Address | Dist | Beds/Ba | Sqft | Sold | Price | $/sf | Match |
|---|---|---|---|---|---|---|---|
| 223 Woodward Dr | 0.13mi | 3/1.0 (+1) | 988 (+1%) | 7mo | $100,000 | $101 | 81 |
| 200 Woodward Dr | 0.13mi | 3/1.0 (+1) | 890 (-9%) | 3mo | $102,000 | $115 | 71 |
| 103 Cedar St | 0.06mi | 2/1.0 | 839 (-14%) | 8mo | $54,000 | $64 | 66 |
| 1589 Carver St | 0.58mi | 3/1.0 (+1) | 957 (-2%) | 5mo | $120,000 | $125 | 60 |
| 2934 Allison Bonnett Memorial Dr | 0.72mi | 3/1.0 (+1) | 1,076 (+10%) | 12mo | $98,000 | $91 | 35 |
| 399 Clio St | 0.56mi | 3/1.0 (+1) | 1,118 (+14%) | 15mo | $115,000 | $103 | 33 |
Match score weights: distance 35% · size 25% · config 20% · recency 20%. Top-matched comps best support the ARV.
Projected returns pro-forma
-0.6% appreciation · 1.6% rent growth · sell at horizon
- IRR
- 2.3%
- Equity multiple
- 1.10×
- Total profit
- $3,315
- Equity at exit
- $29,723
- IRR
- 7.3%
- Equity multiple
- 1.71×
- Total profit
- $22,536
- Equity at exit
- $33,132
Cash invested: $31,920 (down + closing). Projections, not guarantees.
Landlord ↔ Tenant lean methodology
- Overall (STATE)
- 90 Strongly Landlord-Friendly
- State Alabama
- 90 Strongly Landlord-Friendly · R+15
- County
- — inherits STATE
- City
- — inherits STATE
ZIP-level market 35023
- Home prices YoY
- -0.1%
- Rents YoY
- 1.6%
- Active inventory
- 255
- Price-to-rent
- 8.0×
Monthly cashflow live
- Estimated rent
- $1,190 high interval (Pro) →
- Mortgage (P&I)
- −$598
- Tax from tax record
- −$115 /mo · $1,379/yr
- Insurance
- −$48
- HOA
- −$0
- Vacancy / Maint / Mgmt
- −$250
- Net cashflow
- $180
Break-even live
Sensitivity live
| Price | -10% $245 | -5% $212 | +0% $180 | +5% $148 | +10% $116 |
|---|---|---|---|---|---|
| Rent | -10% $86 | -5% $133 | +0% $180 | +5% $227 | +10% $274 |
| Rate | -1.0pp $238 | -0.5pp $209 | base $180 | +0.5pp $151 | +1.0pp $121 |
UW: 25.0% down · 7.5% · 30yr · 1.5% tax · 5.0% vac · 8.0% maint · 8.0% mgmt
Financing live
Cash to close
- Down payment
- $28,500
- Closing costs
- $3,420
- Reserves months
- —
- Total cash needed
- —
Loan-product check · same deal, 3 products live
Conventional
25% down · 7.5% · 30yr
- Down + closing
- —
- Monthly P&I
- —
- Monthly cashflow
- —
- DSCR
- —
- Eligible?
- —
Personal DTI + credit; lowest rate.
DSCR
20% down · 8.5% · 30yr
- Down + closing
- —
- Monthly P&I
- —
- Monthly cashflow
- —
- DSCR
- —
- Eligible?
- —
No personal income docs; deal must DSCR.
Hard money
10% down · 12.0% · 12mo
- Down + closing
- —
- Monthly P&I
- —
- Monthly cashflow
- —
- DSCR
- —
- Eligible?
- —
Short-term bridge; refi at stabilization.
Rent comps 5 comps
| Address | Beds | Baths | Sqft | Rent | $/sqft | DOM | Units | Dist |
|---|---|---|---|---|---|---|---|---|
| 216 Pine St Bessemer, AL | 3.0 | 2.0 | 1000 | $1,200 | $1.20 | 45d | 1 | 0.11mi |
| 200 Woodward Dr Bessemer, AL | 3.0 | 1.0 | 900 | $1,123 | $1.25 | 4d | 1 | 0.12mi |
| 1565 Miles St Dolomite, AL | 3.0 | 2.0 | 1120 | $1,175 | $1.05 | 18d | 1 | 0.41mi |
| 605 10th Ave Birmingham, AL | 3.0 | 1.0 | 1060 | $850 | $0.80 | 45d | 1 | 1.39mi |
| 200 Love St Bessemer, AL | 2.0 | 1.0 | 675 | $1,100 | $1.63 | 45d | 1 | 1.48mi |
Listing history 28 events
-
2026-06-22days on market $114,000 Active 111 DOM
-
2026-06-18days on market $114,000 Active 108 DOM
-
2026-06-17days on market $114,000 Active 107 DOM
-
2026-06-16days on market $114,000 Active 106 DOM
-
2026-06-15days on market $114,000 Active 105 DOM
-
2026-06-13days on market $114,000 Active 103 DOM
-
2026-06-10days on market $114,000 Active 100 DOM
-
2026-06-09days on market $114,000 Active 99 DOM
-
2026-06-08days on market $114,000 Active 98 DOM
-
2026-06-07days on market $114,000 Active 97 DOM
-
2026-06-03days on market $114,000 Active 93 DOM
-
2026-06-02days on market $114,000 Active 92 DOM
-
2026-06-01days on market $114,000 Active 91 DOM
-
2026-05-31days on market $114,000 Active 90 DOM
-
2026-03-02$114,000 Active 50-char remark
Show marketing remark (50 chars)
INVESTORS ONLY! TENANT OCCUPIED until October 2026
-
2025-09-22historical $1,075
-
2025-09-06price $1,075
-
2025-08-24price $1,095
-
2025-08-09$1,125
-
2022-12-15soldstatus $129,000
-
2022-09-07soldstatus $60,000
-
2014-04-11soldstatus $51,000
-
2014-01-15soldstatus $55,500
-
2013-07-12soldstatus $63,400
-
2013-06-07soldstatus $33,000
-
2012-12-11soldstatus $12,000 413-char remark
Show marketing remark (413 chars)
Cute two bedroom, one bath home. Good sized living room with fireplace. Separate dining room. Kitchen is good size with eat in area and good amount of cabinet space. Level lot with fenced in back yard. Back of house has a nice screened in deck along with an open area of the deck. * * UP TO $500 HOME WARRANTY INCENTIVE * * * - Bonus is available only for owner-occupant primary or secondary home purchases.
-
2012-10-31$14,900 413-char remark
Show marketing remark (413 chars)
Cute two bedroom, one bath home. Good sized living room with fireplace. Separate dining room. Kitchen is good size with eat in area and good amount of cabinet space. Level lot with fenced in back yard. Back of house has a nice screened in deck along with an open area of the deck. * * UP TO $500 HOME WARRANTY INCENTIVE * * * - Bonus is available only for owner-occupant primary or secondary home purchases.
-
2008-12-31soldstatus $77,000
ⓘ Source: listings_history table (triggers on properties + properties_extension) + one-shot
backfill from property_details.listing_events for pre-trigger history.
Tax reassessment forecast AL · Resets to sale price
- Current annual tax
- $1,379 · $115/mo
- Projected year-2 tax
- $1,379 · $115/mo
- Expected delta
- $0/yr ($0/mo · 0.0%)
ⓘ Screening estimate from a state-policy table — verify with the county assessor before closing.
Climate risk First Street
- Flood 1/10 Low FEMA zone X (unshaded) · 0% chance over 30 yrs
- Wildfire 2/10 Low
- Heat 6/10 Major 7 d/yr ≥108°F today · 19 d/yr by 30 yrs out
- Wind 6/10 Major 27% chance of damaging wind over 30 yrs
- Air quality 3/10 Moderate 3 unhealthy d/yr today · 5 by 30 yrs out
Nearby sold comps map
Loading sold comps map…
Walkable amenities ~0.75 mi
Loading nearby amenities…
Taxation est. · year 1
- Rental income
- $14,285
- − Mortgage interest
- −$6,386
- − Property taxes
- −$1,379
- − Insurance
- −$570
- − Repairs & maintenance
- −$1,143
- − Management
- −$1,143
- − Depreciation
- −$3,316
- Taxable income
- $349
- Est. tax owed @ 24.0%
- −$84
- After-tax cash flow
- $2,079/yr
For passive investors: Depreciation is non-cash, so a rental often shows a tax loss while cash-flowing — sheltering income. Rental losses are passive: they offset passive income freely, and up to $25,000/yr can offset ordinary (W-2) income if you actively participate and your MAGI is under $100k (phasing out to $0 by $150k); unused losses carry forward. On sale, claimed depreciation is recaptured at up to 25%, and gains may owe capital-gains tax (a 1031 exchange can defer both). Figures are a year-1 estimate at your 24.0% rate — not tax advice; consult a CPA.
Schools (NCES district)
- District
- Jefferson County
- NCES district ID
- 0101920
- Math proficiency
- 9% ▼ -24.00%
- Reading proficiency
- 32% ▼ -5.00%
- Median HH income
- $51,712
- Composite
- 18.4/100
- National rank
- #8937
- State rank
- #104 of 129 in AL
Livability — Hueytown
- Score
- 57/100
- State rank
- #378
- US rank
- #21611
Category grades
Schools grade is shown separately in the Schools card above.
Census & demographics
- Census place
- Hueytown, AL
- County
- Jefferson County · 527,445 people
- Metro
- Birmingham-Hoover, AL
- Population (ZIP)
- 25,533
- Household income
- $69,863
- Rent vs Own
- Severe rent burden
- 247.0
Population outlook (Jefferson County) Hauer SSP2
- Today (2025)
- 669,185 people
- By 2030
- 669,694 · +0.1%
- By 2040
- 661,388 · -1.2%
- By 2050
- 643,086 · -3.9%
- By 2075
- 577,267 · -13.7%
- By 2100
- 474,758 · -29.1%
Race, ethnicity, and origin ACS 2023
- Neighborhood character
- Diverse neighborhood (Simpson 0.56)
- Race & ethnicity
- White 58% Black 30% Hispanic / Latino 7% Two or more races 3%
- Hispanic origin (detail)
- Mexican 5%
- Common ancestry
- Slovak 1% Lithuanian 1% Serbian 1%
- Foreign-born
- 4% · Canada
- Languages at home
- 93% English-only · Spanish 7%
Political lean MEDSL · Jefferson
- 2024 margin
- D (+10.4) · D 54.6% · R 44.2% · Other 1.2%
- 2008→2024 swing
- +5.4pp toward D · 2008: 5.1pp · 2024: 10.4pp
- All cycles
- 2024: D+10.4 2020: D+13.2 2016: D+7.2 2012: D+6.0 2008: D+5.1
Not yet ingested
- Civics
- —
Market trends
- HPI YoY
- ▼ -0.60%
- Current HPI
- 389.38
- Rent YoY
- ▲ 1.60%
- Metro
- Birmingham-Hoover, AL
- State GDP YoY
- ▲ 2.94%
- F500 in state
- 4
Industry mix (Fortune 500 HQ in AL)
| Industry | F500 HQs | Revenue |
|---|---|---|
| Financial Services | 1 | $8B |
|
||
| Healthcare | 1 | $5B |
|
||
Price history
+48.1% since first listed14 events — show timeline
- 2026-03-02 Listed $114,000 Greater Alabama MLS
- 2025-09-22 Rental Removed $1,075 SHOWMOJO
- 2025-09-06 Price Changed $1,075 SHOWMOJO
- 2025-08-24 Price Changed $1,095 SHOWMOJO
- 2025-08-09 Listed for Rent $1,125 SHOWMOJO
- 2022-12-15 Sold (Public Records) $129,000 Public Records
- 2022-09-07 Sold (Public Records) $60,000 Public Records
- 2014-04-11 Sold (Public Records) $51,000 Public Records
- 2014-01-15 Sold (Public Records) $55,500 Public Records
- 2013-07-12 Sold (Public Records) $63,400 Public Records
- 2013-06-07 Sold (Public Records) $33,000 Public Records
- 2012-12-11 Sold (MLS) $12,000 Greater Alabama MLS
- 2012-10-31 Listed $14,900 Greater Alabama MLS
- 2008-12-31 Sold (Public Records) $77,000 Public Records
Property tax history
+4.8%/yrLatest (2025): $1,379 · +0.0% YoY. Source: county tax records.
Cash-flow waterfall
monthlySold comps — $/sqft
last 12 mo · ≤1 miLoading sold comps…