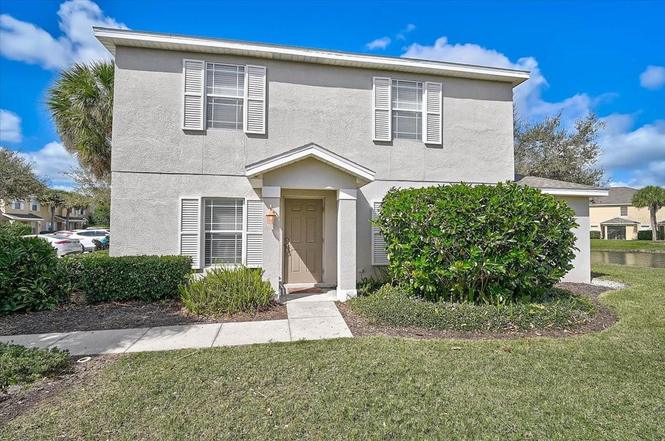
14931 Amberjack Ter · Lakewood Ranch, FL
Flood risk 1/10 · Minimal
- FEMA flood zone
- X (unshaded)
- Chance of flooding over 30 yrs
- 0.0%
- Est. flood insurance / yr
- $507 – $1,088
Fire risk 4/10 · Minor
- Est. fire insurance / yr
- $947 – $1,759
Heat risk 10/10 · Severe
- Hot days now (above 109°F)
- 7 days/yr
- Hot days in 30 yrs
- 29 days/yr
Wind risk 10/10 · Severe
- Chance of severe wind over 30 yrs
- 99.0%
Air-quality risk 3/10 · Minor
- Unhealthy air days now
- 2 days/yr
- Unhealthy air days in 30 yrs
- 2 days/yr
Risk factors via First Street. Map © Google.
Why this score? — see what drove the C- grade
The composite is a weighted blend of 9 inputs, each scored 0–100. Each bar is that input's sub-score; the figure is the points it added to the 100-point composite (weight × sub-score).
- Cash flow +15.6/30.0
- ARV discount +7.5/15.0
- 1% rule +6.7/10.0
- DSCR +4.8/10.0
- Appreciation +4.4/10.0
- Schools +4.4/10.0
- Livability +2.5/5.0
- Condition / age +2.5/5.0
- Rent growth +2.4/5.0
$218,999
🖨 Deal sheet (PDF) 📄 Offer letter ✓ Due diligence
Listing remarks MLS
Sold
Key facts
- Lake views
- Screened lanai
- Natural light
Tags
Property features AI
Finance
- Other: Unfurnished
- Financial info: Total annual association/fees approx. $5,498; Total monthly association/fees approx. $458.17
- HOA & community: Monthly condo fee (approx. $454); Annual association fee (approx. $50); Association covers pool, reserves, structure maintenance, grounds maintenance, management, and pest control; Community features: pool, street lights, irrigation with reclaimed water, deed restrictions, buyer approval required, community mailbox; Pets allowed
Exterior
- Parking: Parking details not provided
- Security: Community mailbox
- Utilities: Public water; Public sewer; Cable available; Electricity connected; Sewer connected; Water connected
- Home design: Townhouse; Two levels; Property faces south; Completed condition; CDD (community development district) present; Homestead exemption
- Construction: Block and stucco construction; Shingle roof; Slab foundation; Building completed; built as part of a multi-unit building (Building number 29)
- Exterior features: Rear screened porch; Sidewalk; Pond view; Mature landscaping; Asphalt road
Interior
- Kitchen: Dishwasher; Garbage disposal; Microwave; Range / Stove; Refrigerator; Electric water heater
- Bedrooms: 3 bedrooms
- Flooring: Carpet; Tile
- Bathrooms: 2 full bathrooms; 1 half bathroom
- Heating & cooling: Central heating (electric); Central air conditioning
- Interior features: Ceiling fans
- Laundry & utility: Laundry closet
Neighborhood map
What this means for you Summary
Snapshot
- This is a 3-bed/2.0-bath condo listed at $219k.
Deal economics
- At list price, monthly cash flow is $91 ($1k/yr) — positive.
- The deal already cash-flows at list — no discount required.
- Meets the 1% rule at list price ($3k rent vs $219k).
- Recommended offer: $199k (9.0% below list) — sets the bar for market timing.
- Cap rate 6.8% vs local median 3.3% in Lakewood Ranch — top-decile yield for the area; either an underpriced asset or a hidden risk that comps aren't pricing in. Stress-test before assuming the spread holds.
Location & tenants
- Location reads: area grade C — affects rentability + tenant quality, not the cash-flow math above.
- Manatee (suburban): math 54% / reading 50% proficiency, ranked #26 of 73 in FL (top 36%) — acceptable for families but not a draw, mixed tenant base, ~2y average lease.
- Zoned schools: Gilbert W Mcneal Elementary School (math 80% / reading 79%, grade A, #116 of 2,144 statewide, top 6%, 678 students, 20% FRL); R. Dan Nolan Middle School (math 79% / reading 72%, grade A, #38 of 571 statewide, top 7%, 760 students, 28% FRL); Lakewood Ranch High School (math 47% / reading 63%, grade C, #135 of 667 statewide, top 20%, 2,435 students, 22% FRL) — zoned schools average 23% FRL vs 51% district-wide (27 pts lower); this property's tenant base skews higher-income than the district average.
- Zoned-school proficiency averages 70% at this address vs 52% district-wide (+18 pts) — the actual schools serving this property are materially stronger than the Manatee average implies; a family-tenant draw the district grade alone would hide.
- Market conditions: Rents soft (-0.5%/yr); 507 active listings in the ZIP; 40 comparable units currently listed for rent nearby; rentals at typical pace (median 25d on market — plan ~3-4 weeks tenant-placement turnaround); high-income renter base; 7,472 units permitted in Manatee County in 2024 (1,782 in 5+ unit buildings).
Forward outlook
- Local home prices are declining (-1.2%/yr); year-one equity from $2k of loan paydown is wiped out by about $3k of value loss. Plan a longer hold.
- Manatee County population projected at +43% by 2050 — long-run rental-demand tailwind backs the buy-and-hold thesis.
Negotiation context
- It's been on market 91 days — a 9% lower offer ($199k) is reasonable based on typical stale-listing flexibility.
- 3 sale attempts since 20y ago with the ask held roughly flat each time — persistent listings suggest the price (not the market) is what's stuck; bring a comps-based counter.
- Current owner paid $130k; list at $219k implies a 68% gain — meaningful room to come down on a strong offer.
Risks & watch-outs
- Climate carrying-cost: severe wind risk, 99% chance of damaging wind over 30y; extreme-heat days projected 7→29/yr by 2055 (HVAC capex compounding) — expect insurance premiums to compound above CPI over the hold.
Questions for the listing agent
- It's been on market 91 days. Have you received any prior offers? Is the seller open to a 9% concession, seller financing, or rate buy-down credit?
- What does the HOA fee cover, when was the last increase, and are there any pending special assessments or reserve-fund shortfalls?
- Any open or pending special assessments — roof, HVAC, plumbing, elevator, façade? What's the per-unit balance and payoff schedule, and is the seller paying it off at close or rolling it to the buyer?
- Why hasn't it sold? Are there any deal-killer items the seller is aware of (foundation, flood, title, zoning, code violations)?
- Is there a deadline driving the sale (1031 exchange, divorce, estate, relocation)? That informs how much negotiation room exists.
- What's the average days-on-market for RENTAL listings here right now (not sales)? A rising rental-DOM trend means longer vacancies and softer asking-rent achievability than the comps imply.
- What's the recent tenant-quality profile in this submarket — average credit score on applications, eviction rate, late-payment / NSF rate, and stable-employment percentage? A property-management company in the area should have these aggregated.
- How much new apartment / multifamily construction is in the pipeline within 1–3 miles? Heavy new supply (>2% of stock underway) typically softens rents 12–24 months out; light construction supports rent growth.
Investment metrics
- 1% rule
- 1.17% ✓
- Cap rate
- 6.79%
- Cash-on-cash
- 1.79%
- DSCR
- 1.08
- GRM
- 7.1
CMA / ARV
No comps found within radius.
Projected returns pro-forma
-1.2% appreciation · 0.0% rent growth · sell at horizon
- IRR
- -7.8%
- Equity multiple
- 0.68×
- Total profit
- $-19,825
- Equity at exit
- $50,782
- IRR
- -4.5%
- Equity multiple
- 0.65×
- Total profit
- $-21,708
- Equity at exit
- $51,571
Cash invested: $61,320 (down + closing). Projections, not guarantees.
Landlord ↔ Tenant lean methodology
- Overall (STATE)
- 87 Strongly Landlord-Friendly
- State Florida
- 87 Strongly Landlord-Friendly · R+3
- County
- — inherits STATE
- City
- — inherits STATE
ZIP-level market 34202
- Home prices YoY
- -0.5%
- Rents YoY
- -0.5%
- Active inventory
- 507
- Price-to-rent
- 7.1×
Monthly cashflow live
- Estimated rent
- $2,559 high interval (Pro) →
- Mortgage (P&I)
- −$1,148
- Tax from tax record
- −$233 /mo · $2,792/yr
- Insurance
- −$91
- HOA
- −$458
- Vacancy / Maint / Mgmt
- −$537
- Net cashflow
- $91
Break-even live
Sensitivity live
| Price | -10% $215 | -5% $153 | +0% $91 | +5% $30 | +10% $-32 |
|---|---|---|---|---|---|
| Rent | -10% $-111 | -5% $-10 | +0% $91 | +5% $193 | +10% $294 |
| Rate | -1.0pp $202 | -0.5pp $147 | base $91 | +0.5pp $35 | +1.0pp $-23 |
UW: 25.0% down · 7.5% · 30yr · 1.5% tax · 5.0% vac · 8.0% maint · 8.0% mgmt
Financing live
Cash to close
- Down payment
- $54,750
- Closing costs
- $6,570
- Reserves months
- —
- Total cash needed
- —
Loan-product check · same deal, 3 products live
Conventional
25% down · 7.5% · 30yr
- Down + closing
- —
- Monthly P&I
- —
- Monthly cashflow
- —
- DSCR
- —
- Eligible?
- —
Personal DTI + credit; lowest rate.
DSCR
20% down · 8.5% · 30yr
- Down + closing
- —
- Monthly P&I
- —
- Monthly cashflow
- —
- DSCR
- —
- Eligible?
- —
No personal income docs; deal must DSCR.
Hard money
10% down · 12.0% · 12mo
- Down + closing
- —
- Monthly P&I
- —
- Monthly cashflow
- —
- DSCR
- —
- Eligible?
- —
Short-term bridge; refi at stabilization.
Rent comps 40 comps
| Address | Beds | Baths | Sqft | Rent | $/sqft | DOM | Units | Dist |
|---|---|---|---|---|---|---|---|---|
| 14909 Skip Jack Loop #102 Lakewood Ranch, FL | 2.0 | 2.5 | 1160 | $2,200 | $1.90 | 23d | 1 | 0.07mi |
| 6209 Flagfish Ct #102 Lakewood Ranch, FL | 3.0 | 2.5 | 1276 | $1,895 | $1.49 | 25d | 1 | 0.09mi |
| 14956 Amberjack Ter #103 Lakewood Ranch, FL | 3.0 | 2.5 | 1540 | $1,975 | $1.28 | 25d | 1 | 0.10mi |
| 6209 Flagfish Ct Lakewood Ranch, FL | 3.0 | 3.0 | 1276 | $1,845 | $1.45 | 17d | 1 | 0.11mi |
| 15121 Searobbin Dr Lakewood Ranch, FL | 4.0 | 2.5 | 1868 | $2,850 | $1.53 | 25d | 1 | 0.12mi |
| 6258 Blue Runner Ct Lakewood Ranch, FL | 3.0 | 2.0 | 1275 | $2,000 | $1.57 | 17d | 1 | 0.14mi |
| 6246 Blue Runner Ct Lakewood Ranch, FL | 3.0 | 2.0 | 1556 | $2,300 | $1.48 | 17d | 1 | 0.16mi |
| 14505 Westbrook Cir Bradenton, FL | 1.0–2.0 | 1.0–2.0 | 1016 | $1,906 | $1.88 | 5d | 10 | 0.44mi |
| 13700 Luxe Ave Bradenton, FL | 1.0–3.0 | 1.0–2.0 | 1068 | $2,205 | $2.06 | 3d | 25 | 0.86mi |
| 5510 Tidal Breeze Cv Unit 5510 Bradenton, FL | 2.0 | 2.0 | 1414 | $3,495 | $2.47 | 25d | 1 | 0.96mi |
| 5537 Tidal Breeze Cv Bradenton, FL | 3.0 | 2.0 | 1564 | $2,700 | $1.73 | 25d | 1 | 0.97mi |
| 14736 Lyla Ter Bradenton, FL | 3.0 | 2.5 | 1700 | $3,000 | $1.76 | 17d | 1 | 1.06mi |
| 15721 Sunny Day Dr Bradenton, FL | 2.0 | 2.0 | 1580 | $6,500 | $4.11 | 25d | 1 | 1.14mi |
| 15161 Serene Shores Loop Bradenton, FL | 3.0 | 3.0 | 1840 | $3,800 | $2.07 | 25d | 1 | 1.16mi |
| 5316 Crystal Harbor Cv Bradenton, FL | 2.0 | 2.0 | 1564 | $2,700 | $1.73 | 25d | 1 | 1.19mi |
| 5316 Crystal Harbor Cv Bradenton, FL | 3.0 | 2.0 | 1564 | $2,700 | $1.73 | 23d | 1 | 1.19mi |
| 13737 Messina Loop Bradenton, FL | 2.0 | 2.0 | 1528 | $4,750 | $3.11 | 25d | 2 | 1.21mi |
| 13732 Messina Loop #201 Bradenton, FL | 2.0 | 2.0 | 1528 | $2,775 | $1.82 | 17d | 1 | 1.22mi |
| 5307 Crystal Harbor Cv Bradenton, FL | 2.0 | 2.0 | 1557 | $3,000 | $1.93 | 25d | 1 | 1.24mi |
| 16706 Vardon Ter Bradenton, FL | 2.0–3.0 | 2.0 | 1203 | $6,000 | $4.99 | 16d | 5 | 1.24mi |
| 13823 Messina Loop Bradenton, FL | 2.0 | 2.0 | 1528 | $2,950 | $1.93 | 25d | 2 | 1.25mi |
| 13725 Messina Loop #201 Bradenton, FL | 2.0 | 2.0 | 1528 | $2,900 | $1.90 | 25d | 1 | 1.27mi |
| 13710 Messina Loop #203 Bradenton, FL | 2.0 | 2.0 | 1528 | $3,200 | $2.09 | 25d | 1 | 1.28mi |
| 16020 Sunny Day Dr Unit 1 Bradenton, FL | 3.0 | 2.0 | 1414 | $3,500 | $2.48 | 25d | 1 | 1.29mi |
| 13711 Messina Loop #104 Bradenton, FL | 2.0 | 2.0 | 1528 | $2,495 | $1.63 | 25d | 1 | 1.29mi |
| 13711 Messina Loop #203 Bradenton, FL | 2.0 | 2.0 | 1528 | $3,200 | $2.09 | 17d | 1 | 1.29mi |
| 16804 Vardon Ter Bradenton, FL | 2.0 | 2.0 | 1131 | $3,425 | $3.03 | 4d | 2 | 1.29mi |
| 13703 Messina Loop #102 Bradenton, FL | 2.0 | 2.0 | 1528 | $2,750 | $1.80 | 25d | 1 | 1.32mi |
| 5930 Cessna Run Bradenton, FL | 2.0 | 2.5 | 1850 | $12,500 | $6.76 | 25d | 1 | 1.32mi |
| 5225 Blue Crush St Bradenton, FL | 3.0 | 3.0 | 1849 | $5,000 | $2.70 | 25d | 1 | 1.32mi |
| 13720 Messina Loop Bradenton, FL | 2.0 | 2.0 | 1528 | $4,750 | $3.11 | 25d | 2 | 1.32mi |
| 5319 White Sand Cv Bradenton, FL | 3.0 | 2.0 | 1417 | $2,850 | $2.01 | 25d | 1 | 1.33mi |
| 16814 Vardon Ter Bradenton, FL | 2.0 | 2.0 | 1124 | $3,650 | $3.25 | 25d | 2 | 1.34mi |
| 13604 Messina Loop #103 Bradenton, FL | 2.0 | 2.0 | 1528 | $6,000 | $3.93 | 5d | 1 | 1.35mi |
| 13605 Messina Loop #104 Bradenton, FL | 2.0 | 2.0 | 1528 | $4,400 | $2.88 | 21d | 1 | 1.37mi |
| 13605 Messina Loop #104 Bradenton, FL | 2.0 | 2.0 | 1632 | $2,200 | $1.35 | 21d | 1 | 1.37mi |
| 13605 Messina Loop Bradenton, FL | 2.0 | 2.0 | 1528 | $3,450 | $2.26 | 25d | 2 | 1.37mi |
| 16904 Vardon Ter Bradenton, FL | 2.0–3.0 | 2.0 | 1195 | $6,500 | $5.44 | 5d | 5 | 1.39mi |
| 15934 Clear Skies Pl Bradenton, FL | 3.0 | 2.0 | 1414 | $2,900 | $2.05 | 25d | 1 | 1.40mi |
| 15950 Clear Skies Pl Bradenton, FL | 3.0 | 2.0 | 1414 | $4,500 | $3.18 | 25d | 1 | 1.43mi |
HOA detail condo
- Monthly dues
- $458 · $5,496/yr
- Assessments
- None detected in remarks — confirm with the listing agent.
Listing history 13 events
-
2026-06-08statusdays on market $218,999 Pending 91 DOM
-
2026-06-03days on market $218,999 Active 89 DOM
-
2026-06-02days on market $218,999 Active 88 DOM
-
2026-06-01days on market $218,999 Active 87 DOM
-
2026-05-31days on market $218,999 Active 86 DOM
-
2026-04-27price $218,999
-
2026-03-06$225,000 Active
-
2016-08-30soldstatus $130,000
-
2016-08-29status Pending 4-char remark
Show marketing remark (4 chars)
Sold
-
2016-08-29$130,000 Active 4-char remark
Show marketing remark (4 chars)
Sold
-
2016-08-29soldstatus $130,000 Sold 4-char remark
Show marketing remark (4 chars)
Sold
-
2015-04-09soldstatus $29,956
-
2006-04-11$254,900
ⓘ Source: listings_history table (triggers on properties + properties_extension) + one-shot
backfill from property_details.listing_events for pre-trigger history.
Tax reassessment forecast FL · Resets to sale price
- Current annual tax
- $2,792 · $233/mo
- Projected year-2 tax
- $2,792 · $233/mo
- Expected delta
- $0/yr ($0/mo · 0.0%)
ⓘ Screening estimate from a state-policy table — verify with the county assessor before closing.
Climate risk First Street
- Flood 1/10 Low FEMA zone X (unshaded) · 0% chance over 30 yrs
- Wildfire 4/10 Moderate
- Heat 10/10 Extreme 7 d/yr ≥109°F today · 29 d/yr by 30 yrs out
- Wind 10/10 Extreme 99% chance of damaging wind over 30 yrs
- Air quality 3/10 Moderate 2 unhealthy d/yr today · 2 by 30 yrs out
Nearby sold comps map
Loading sold comps map…
Walkable amenities ~0.75 mi
Loading nearby amenities…
Taxation est. · year 1
- Rental income
- $30,711
- − Mortgage interest
- −$12,267
- − Property taxes
- −$2,792
- − Insurance
- −$1,095
- − Repairs & maintenance
- −$2,457
- − Management
- −$2,457
- − HOA
- −$5,496
- − Depreciation
- −$6,371
- Taxable loss
- −$2,223
- Est. tax savings @ 24.0%
- +$534
- After-tax cash flow
- $1,632/yr
For passive investors: Depreciation is non-cash, so a rental often shows a tax loss while cash-flowing — sheltering income. Rental losses are passive: they offset passive income freely, and up to $25,000/yr can offset ordinary (W-2) income if you actively participate and your MAGI is under $100k (phasing out to $0 by $150k); unused losses carry forward. On sale, claimed depreciation is recaptured at up to 25%, and gains may owe capital-gains tax (a 1031 exchange can defer both). Figures are a year-1 estimate at your 24.0% rate — not tax advice; consult a CPA.
Schools (NCES district)
- District
- Manatee
- NCES district ID
- 1201230
- Math proficiency
- 54% ▼ -6.00%
- Reading proficiency
- 50% ▼ -2.00%
- Median HH income
- $49,607
- Composite
- 44.43/100
- National rank
- #2806
- State rank
- #26 of 73 in FL
Livability — Lakewood Ranch
No livability data for this city. (Only ~50 U.S. cities are tracked.)
Census & demographics
- Census place
- Lakewood Ranch, FL
- County
- Manatee County · 416,364 people
- City population
- 52,177
- Metro
- North Port-Sarasota-Bradenton, FL
- Population (ZIP)
- 27,197
- Household income
- $121,659
- Rent vs Own
- Severe rent burden
- 574.0
Population outlook (Manatee County) Hauer SSP2
- Today (2025)
- 447,342 people
- By 2030
- 488,911 · +9.3%
- By 2040
- 567,934 · +27.0%
- By 2050
- 637,995 · +42.6%
- By 2075
- 781,970 · +74.8%
- By 2100
- 848,272 · +89.6%
Race, ethnicity, and origin ACS 2023
- Neighborhood character
- Predominantly White (80%)
- Race & ethnicity
- White 80% Two or more races 10% Hispanic / Latino 9% Asian 3% Black 2%
- Hispanic origin (detail)
- Puerto Rican 4% Cuban 2%
- Common ancestry
- Romanian 4% Italian 4% Slovak 3%
- Foreign-born
- 12% · Canada, Vietnam, China
- Languages at home
- 88% English-only · Spanish 5% Arabic 1% Other Asian/Pacific 1%
Political lean MEDSL · Manatee
- 2024 margin
- Strong R (+23.5) · D 37.9% · R 61.4%
- 2008→2024 swing
- -16.5pp toward R · 2008: -7.0pp · 2024: -23.5pp
- All cycles
- 2024: R+23.5 2020: R+16.1 2016: R+17.1 2012: R+12.5 2008: R+7.0
Not yet ingested
- Civics
- —
Market trends
- HPI YoY
- ▼ -1.20%
- Current HPI
- 240.7087
- Rent YoY
- ▼ -0.54%
- Metro
- North Port-Sarasota-Bradenton, FL
- State GDP YoY
- ▲ 3.28%
- F500 in state
- 36
Industry mix (Fortune 500 HQ in FL)
| Industry | F500 HQs | Revenue |
|---|---|---|
| Industrial Technology | 2 | $29B |
|
||
| Insurance | 2 | $17B |
|
||
| Retail | 1 | $60B |
|
||
| Technology Distribution | 1 | $58B |
|
||
| Homebuilding | 1 | $35B |
|
||
| Technology Manufacturing | 1 | $35B |
|
||
Price history
-14.1% since first listed8 events — show timeline
- 2026-04-27 Price Changed $218,999 Stellar MLS as Distributed by MLS Grid
- 2026-03-06 Listed $225,000 Stellar MLS as Distributed by MLS Grid
- 2016-08-30 Sold (Public Records) $130,000 Public Records
- 2016-08-29 Pending — Stellar MLS as Distributed by MLS Grid
- 2016-08-29 Listed $130,000 Stellar MLS as Distributed by MLS Grid
- 2016-08-29 Sold (MLS) $130,000 Stellar MLS as Distributed by MLS Grid
- 2015-04-09 Sold (Public Records) $29,956 Public Records
- 2006-04-11 Listed $254,900 Stellar MLS as Distributed by MLS Grid
Property tax history
+3.3%/yrLatest (2025): $2,792 · +4.1% YoY. Source: county tax records.
Cash-flow waterfall
monthlySold comps — $/sqft
last 12 mo · ≤1 miLoading sold comps…