 🏗️ New Construction
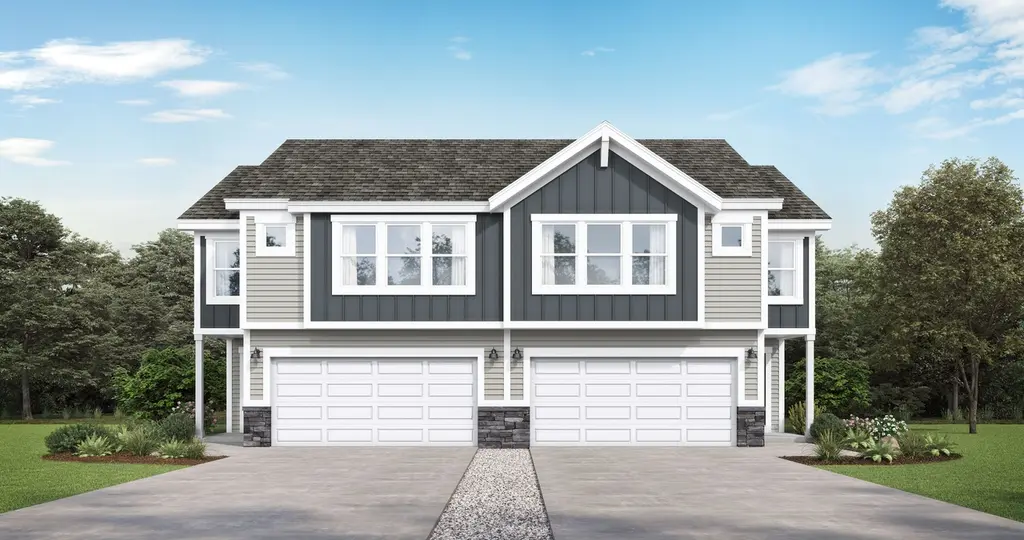
Twin Emerald Plan · Louisburg, KS
Flood risk 1/10 · Minimal
- FEMA flood zone
- X (unshaded)
- Chance of flooding over 30 yrs
- 0.0%
- Est. flood insurance / yr
- $507 – $1,088
Fire risk 5/10 · Moderate
- Est. fire insurance / yr
- $1,154 – $2,142
Heat risk 4/10 · Minor
- Hot days now (above 107°F)
- 7 days/yr
- Hot days in 30 yrs
- 17 days/yr
Wind risk 2/10 · Minimal
- Chance of severe wind over 30 yrs
- —
Air-quality risk 2/10 · Minimal
- Unhealthy air days now
- 2 days/yr
- Unhealthy air days in 30 yrs
- 2 days/yr
Risk factors via First Street. Map © Google.
Why this score? — see what drove the B- grade
The composite is a weighted blend of 9 inputs, each scored 0–100. Each bar is that input's sub-score; the figure is the points it added to the 100-point composite (weight × sub-score).
- Cash flow +27.6/30.0
- DSCR +9.7/10.0
- 1% rule +7.5/10.0
- ARV discount +7.5/15.0
- Schools +4.4/10.0
- Condition / age +4.0/5.0
- Livability +3.2/5.0
- Rent growth +2.5/5.0
- Appreciation +0.0/10.0
$285,000
🖨 Deal sheet 📄 Offer letter ✓ Due diligence
Listing remarks
This stylish emerald is the perfect split-level home plan with a large foyer. Walk up to the main level to the stunning open-concept kitchen with large quartz countertops, overlooking the spacious dining room and living room, which have tons of windows bringing in natural light. Don't forget to check out the spacious walk-in pantry! Upstairs, the primary bedroom offers a tranquil retreat. It has an attached en-suite bathroom with a large shower, an oversized quartz countertop with dual sinks, and a walk-in closet. The second floor also features a second bedroom, a bathroom, and a convenient laundry closet. Head downstairs to a fully finished basement featuring a spacious additional living
Key facts
- Dual sinks
- Open-concept kitchen
- Spacious dining room
Tags
Property features AI
Finance
- Financial info: List price $285,000
Exterior
- Utilities: Electric heating and power available; Central air for cooling
- Home design: Inventory type: Plan; Entry address listed as Twin Emerald Plan, Louisburg, KS
- Exterior features: Single-family plan home in Louisburg, KS
Interior
- Bedrooms: 3 bedrooms
- Bathrooms: 3 full bathrooms
- Heating & cooling: Electric forced-air heating; Central air conditioning
- Interior features: Plan: Twin Emerald
Neighborhood map
What this means for you Summary
Snapshot
- This is a 3-bed/3.0-bath multifamily listed at $285k. Condition is rated good.
Deal economics
- At list price, monthly cash flow is $852 ($10k/yr) — positive.
- The deal already cash-flows at list — no discount required.
- Meets the 1% rule at list price ($4k rent vs $285k).
- Recommended offer: $268k (6.0% below list) — sets the bar for market timing.
- Cap rate 9.9% vs local median 3.1% in Louisburg — top-decile yield for the area; either an underpriced asset or a hidden risk that comps aren't pricing in. Stress-test before assuming the spread holds.
Location & tenants
- Location reads 65/100 on livability (#281 in KS) — a middle-class / working-renter tenant base. Strengths: cost of living A+, housing A+, crime A; Watch: schools C-, amenities F, commute F.
- Louisburg (town): math 43% / reading 55% proficiency, ranked #10 of 169 in KS (top 6%) — families likely to look elsewhere, expect single-tenant / working-renter base with shorter leases; only 17% free/reduced lunch — higher-income household profile.
- Market conditions: 92 active listings in the ZIP; 2 comparable units currently listed for rent nearby; 100 units permitted in Miami County in 2024 (0 in 5+ unit buildings).
Forward outlook
- Local home prices are declining (-3.0%/yr); year-one equity from $2k of loan paydown is wiped out by about $9k of value loss. Plan a longer hold.
- Miami County population projected at -15% by 2050 — secular population decline; favor cash flow + early exit over multi-decade hold.
- At projected returns (-3.0% appreciation + 3.0% rent growth), your $80k cash investment doubles in ~9 years — after that, you're playing with house money.
Negotiation context
- It's been on market 83 days — a 6% lower offer ($268k) is reasonable based on typical stale-listing flexibility.
Risks & watch-outs
- Climate carrying-cost: moderate wildfire risk — expect insurance premiums to compound above CPI over the hold.
Questions for the listing agent
- It's been on market 83 days. Have you received any prior offers? Is the seller open to a 6% concession, seller financing, or rate buy-down credit?
- Why hasn't it sold? Are there any deal-killer items the seller is aware of (foundation, flood, title, zoning, code violations)?
- Is there a deadline driving the sale (1031 exchange, divorce, estate, relocation)? That informs how much negotiation room exists.
- What's the average days-on-market for RENTAL listings here right now (not sales)? A rising rental-DOM trend means longer vacancies and softer asking-rent achievability than the comps imply.
- What's the recent tenant-quality profile in this submarket — average credit score on applications, eviction rate, late-payment / NSF rate, and stable-employment percentage? A property-management company in the area should have these aggregated.
- How much new apartment / multifamily construction is in the pipeline within 1–3 miles? Heavy new supply (>2% of stock underway) typically softens rents 12–24 months out; light construction supports rent growth.
Investment metrics
- 1% rule
- 1.25% ✓
- Cap rate
- 9.88%
- Cash-on-cash
- 12.82%
- DSCR
- 1.57
- GRM
- 6.6
CMA / ARV
No comps found within radius.
Projected returns pro-forma
-3.0% appreciation · 3.0% rent growth · sell at horizon
- IRR
- 2.7%
- Equity multiple
- 1.10×
- Total profit
- $8,156
- Equity at exit
- $42,494
- IRR
- 12.2%
- Equity multiple
- 1.97×
- Total profit
- $77,220
- Equity at exit
- $24,642
Cash invested: $79,800 (down + closing). Projections, not guarantees.
Landlord ↔ Tenant lean methodology
- Overall (STATE)
- 83 Strongly Landlord-Friendly
- State Kansas
- 83 Strongly Landlord-Friendly · R+10
- County
- — inherits STATE
- City
- — inherits STATE
ZIP-level market 66053
- Home prices YoY
- -24.8%
- Active inventory
- 92
- Price-to-rent
- 13.3×
Monthly cashflow live
- Estimated rent
- $3,572 medium interval (Pro) →
- Mortgage (P&I)
- −$1,495
- Tax est. 1.5%
- −$356 /mo · $4,275/yr
- Insurance
- −$119
- HOA
- −$0
- Vacancy / Maint / Mgmt
- −$750
- Net cashflow
- $852
Break-even live
2-unit breakdown (identical units grouped — click to expand)
| Units | Beds | Baths | Est. rent |
|---|---|---|---|
| 2× units | 3 | 1.5 | $3,572 |
| #1 | 3 | 1.5 | $1,786 |
| #2 | 3 | 1.5 | $1,786 |
| Total (2 units) | $3,572 | ||
UW: 25.0% down · 7.5% · 30yr · 1.5% tax · 5.0% vac · 8.0% maint · 8.0% mgmt
Financing live
Cash to close
- Down payment
- $71,250
- Closing costs
- $8,550
- Reserves months
- —
- Total cash needed
- —
Loan-product check · same deal, 3 products live
Conventional
25% down · 7.5% · 30yr
- Down + closing
- —
- Monthly P&I
- —
- Monthly cashflow
- —
- DSCR
- —
- Eligible?
- —
Personal DTI + credit; lowest rate.
DSCR
20% down · 8.5% · 30yr
- Down + closing
- —
- Monthly P&I
- —
- Monthly cashflow
- —
- DSCR
- —
- Eligible?
- —
No personal income docs; deal must DSCR.
Hard money
10% down · 12.0% · 12mo
- Down + closing
- —
- Monthly P&I
- —
- Monthly cashflow
- —
- DSCR
- —
- Eligible?
- —
Short-term bridge; refi at stabilization.
Rent comps 2 comps
| Address | Beds | Baths | Sqft | Rent | $/sqft | DOM | Units | Dist |
|---|---|---|---|---|---|---|---|---|
| 341 N 5th Ter Louisburg, KS | 3.0 | 2.0 | 1414 | $1,795 | $1.27 | 43d | 1 | 1.18mi |
| 304 N 9th St Apt B Louisburg, KS | 3.0 | 2.5 | 1500 | $1,495 | $1.00 | 1d | 1 | 1.29mi |
Listing history 14 events
-
2026-06-18days on market $285,000 Active 83 DOM
-
2026-06-17days on market $285,000 Active 82 DOM
-
2026-06-16days on market $285,000 Active 81 DOM
-
2026-06-15days on market $285,000 Active 80 DOM
-
2026-06-13days on market $285,000 Active 78 DOM
-
2026-06-13days on market $285,000 Active 77 DOM
-
2026-06-09days on market $285,000 Active 74 DOM
-
2026-06-08days on market $285,000 Active 73 DOM
-
2026-06-07days on market $285,000 Active 72 DOM
-
2026-06-05days on market $285,000 Active 69 DOM
-
2026-06-03days on market $285,000 Active 68 DOM
-
2026-06-02days on market $285,000 Active 67 DOM
-
2026-06-01days on market $285,000 Active 66 DOM
-
2026-05-31days on market $285,000 Active 65 DOM
ⓘ Source: listings_history table (triggers on properties + properties_extension) + one-shot
backfill from property_details.listing_events for pre-trigger history.
Climate risk First Street
- Flood 1/10 Low FEMA zone X (unshaded) · 0% chance over 30 yrs
- Wildfire 5/10 Major
- Heat 4/10 Moderate 7 d/yr ≥107°F today · 17 d/yr by 30 yrs out
- Wind 2/10 Low
- Air quality 2/10 Low 2 unhealthy d/yr today · 2 by 30 yrs out
Nearby sold comps map
Loading sold comps map…
Walkable amenities ~0.75 mi
Loading nearby amenities…
Taxation est. · year 1
- Rental income
- $42,864
- − Mortgage interest
- −$15,964
- − Property taxes
- −$4,275
- − Insurance
- −$1,425
- − Repairs & maintenance
- −$3,429
- − Management
- −$3,429
- − Depreciation
- −$8,291
- Taxable income
- $6,050
- Est. tax owed @ 24.0%
- −$1,452
- After-tax cash flow
- $8,776/yr
For passive investors: Depreciation is non-cash, so a rental often shows a tax loss while cash-flowing — sheltering income. Rental losses are passive: they offset passive income freely, and up to $25,000/yr can offset ordinary (W-2) income if you actively participate and your MAGI is under $100k (phasing out to $0 by $150k); unused losses carry forward. On sale, claimed depreciation is recaptured at up to 25%, and gains may owe capital-gains tax (a 1031 exchange can defer both). Figures are a year-1 estimate at your 24.0% rate — not tax advice; consult a CPA.
Condition & rehab AI · 3 photos
This split-level home is in good condition with a fresh paint job and well-maintained landscaping. It offers a good balance of updates and maintenance, making it a solid investment for both resale and rental markets.
Value-add opportunities
- Both Painting exterior and interior walls — Fresh paint enhances curb appeal and interior aesthetics.
- Both Landscaping improvements — Well-maintained landscaping increases curb appeal and property value.
- Resale Kitchen appliances — Upgrading to high-end appliances can attract more buyers.
- Resale Bathroom fixtures — Upgrading to modern fixtures can enhance the appeal of the primary bathroom.
Renovation cost estimate screening
Value-add ROI direction
- Both Painting exterior and interior walls — Fresh paint enhances curb appeal and interior aesthetics. ↑
- Both Landscaping improvements — Well-maintained landscaping increases curb appeal and property value. ↑
- Resale Kitchen appliances — Upgrading to high-end appliances can attract more buyers. ↑
- Resale Bathroom fixtures — Upgrading to modern fixtures can enhance the appeal of the primary bathroom. ↑
ⓘ Cost ranges are severity-bucket heuristics (US national rule-of-thumb). Get contractor quotes + a written scope before underwriting a rehab budget.
Schools (NCES district)
- District
- Louisburg
- NCES district ID
- 2008970
- Math proficiency
- 43% ▼ -4.00%
- Reading proficiency
- 55% ▲ 6.00%
- Median HH income
- $69,723
- Composite
- 43.8/100
- National rank
- #2932
- State rank
- #10 of 169 in KS
Livability — Louisburg
- Score
- 65/100
- State rank
- #281
- US rank
- #12611
Category grades
Schools grade is shown separately in the Schools card above.
Census & demographics
- Census place
- Louisburg, KS
- Population (ZIP)
- 7,744
Population outlook (Miami County) Hauer SSP2
- Today (2025)
- 32,162 people
- By 2030
- 31,472 · -2.1%
- By 2040
- 29,611 · -7.9%
- By 2050
- 27,277 · -15.2%
- By 2075
- 22,738 · -29.3%
- By 2100
- 18,479 · -42.5%
Race, ethnicity, and origin ACS 2023
- Neighborhood character
- Predominantly White (95%)
- Race & ethnicity
- White 95% Two or more races 3% Hispanic / Latino 2%
- Common ancestry
- Italian 2% Slovak 2% Iranian 2%
- Foreign-born
- 1% · Canada
- Languages at home
- 98% English-only · Spanish 1% Russian/Polish/Slavic 1%
Political lean MEDSL · Miami
- 2024 margin
- Solid R (+39.5) · D 29.3% · R 68.8% · Other 1.9%
- 2008→2024 swing
- -15.8pp toward R · 2008: -23.7pp · 2024: -39.5pp
- All cycles
- 2024: R+39.5 2020: R+39.6 2016: R+40.0 2012: R+34.8 2008: R+23.7
Not yet ingested
- Civics
- —
Market trends
- HPI YoY
- ▼ -83.93%
- Current HPI
- 254.1138
- Rent YoY
- —
- Metro
- —
- State GDP YoY
- —
- F500 in state
- 0
Cash-flow waterfall
monthlySold comps — $/sqft
last 12 mo · ≤1 miLoading sold comps…