 16-Plex
1410 E Jefferson St · Franklin, IN
Flood risk 1/10 · Minimal
- FEMA flood zone
- X (unshaded)
- Chance of flooding over 30 yrs
- 0.0%
- Est. flood insurance / yr
- $507 – $1,088
Fire risk 1/10 · Minimal
- Est. fire insurance / yr
- $717 – $1,331
Heat risk 4/10 · Minor
- Hot days now (above 102°F)
- 7 days/yr
- Hot days in 30 yrs
- 19 days/yr
Wind risk 2/10 · Minimal
- Chance of severe wind over 30 yrs
- 1.0%
Air-quality risk 2/10 · Minimal
- Unhealthy air days now
- 1 days/yr
- Unhealthy air days in 30 yrs
- 2 days/yr
Risk factors via First Street. Map © Google.
Why this score? — see what drove the B grade
The composite is a weighted blend of 9 inputs, each scored 0–100. Each bar is that input's sub-score; the figure is the points it added to the 100-point composite (weight × sub-score).
- Cash flow +30.0/30.0
- DSCR +10.0/10.0
- 1% rule +9.8/10.0
- ARV discount +7.5/15.0
- Rent growth +3.7/5.0
- Schools +3.5/10.0
- Livability +3.2/5.0
- Condition / age +2.5/5.0
- Appreciation +0.0/10.0
$1,600,000
🖨 Deal sheet (PDF) 📄 Offer letter ✓ Due diligence
Multi-family units
County records classify this as Multi-Family (5+ Unit). Listing-text estimate: 16 units. confirmed
5+ unit building — per-unit beds/baths from public records are typically unavailable; the breakdown below (if shown) is an estimate from the listing text.
Listing remarks MLS
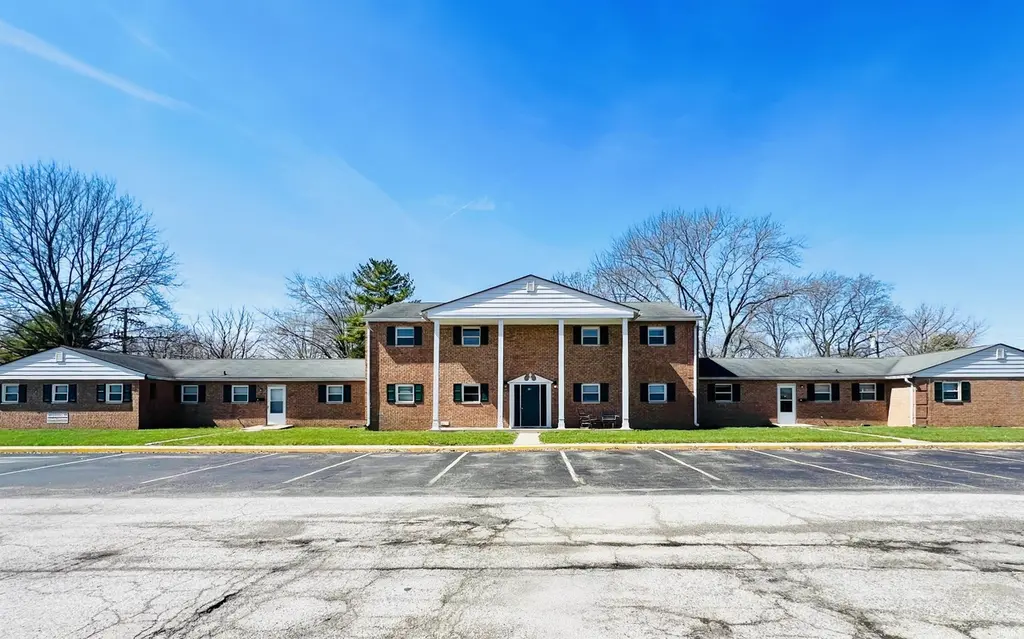
Nestled in the heart of Franklin, 1410 E Jefferson Street presents a well-maintained and fully occupied 16-unit investment opportunity comprised of two attractive brick buildings, each containing 8 spacious apartments. Many units have been recently updated with vinyl plank flooring, and each unit features a functional floorplan with a large private patio or balcony, enhancing overall tenant appeal. A common area laundry facility is available for tenant use, providing an additional income stream. The buildings are thoughtfully positioned across from one another, with a large central parking lot offering approximately 40 spaces. Tenants are responsible for all utilities. With consistent rental demand in the Franklin market, this asset presents a compelling opportunity for both stable in-place income and immediate upside, making it an ideal addition for investors seeking a balance of manageability and portfolio growth. Financials available upon request. Seller financing offers will not be considered.
Key facts
- Two brick buildings
- Large private patio
- 1.65 acre lot
Tags
Neighborhood map
What this means for you Summary
Snapshot
- This is a 16 × 3-bed/1-bath units multifamily listed at $1.60M.
Deal economics
- At list price, monthly cash flow is $8k ($100k/yr) — positive. Per door: $518/mo.
- The deal already cash-flows at list — no discount required.
- Meets the 1% rule at list price ($24k rent vs $1.60M).
- Recommended offer: $1.50M (6.0% below list) — sets the bar for market timing.
- Cap rate 12.5% vs local median 4.0% in Franklin — top-decile yield for the area; either an underpriced asset or a hidden risk that comps aren't pricing in. Stress-test before assuming the spread holds.
Location & tenants
- Location reads 65/100 on livability (#351 in IN) — a middle-class / working-renter tenant base. Strengths: crime A+, cost of living A+, housing A+; Watch: amenities F, commute F, health & safety F.
- Franklin Community School Corporation (suburban): math 36% / reading 44% proficiency, ranked #133 of 301 in IN (top 44%) — families likely to look elsewhere, expect single-tenant / working-renter base with shorter leases.
- Zoned schools: Webb Elementary School (math 47% / reading 32%, grade F, #500 of 994 statewide, top 53%, 281 students, 51% FRL); Franklin Community Middle School (math 25% / reading 42%, grade F, #176 of 330 statewide, top 54%, 759 students, 48% FRL); Franklin Community High School (math 29% / reading 69%, grade D, #136 of 369 statewide, top 37%, 1,610 students, 41% FRL).
- Market conditions: Rents rising fast (+4.7%/yr); 282 active listings in the ZIP; solid renter incomes; 1,133 units permitted in Johnson County in 2024 (0 in 5+ unit buildings).
- At $23,706/mo this rent would consume 334% of the median local household income ($85k/yr) (locally 984% of renters already pay >50% of income on rent) — very limited rent-growth headroom before tenants either downsize or default.
Forward outlook
- Local home prices are declining (-3.0%/yr); year-one equity from $11k of loan paydown is wiped out by about $48k of value loss. Plan a longer hold.
- Johnson County population projected at +26% by 2050 — long-run rental-demand tailwind backs the buy-and-hold thesis.
- At projected returns (-3.0% appreciation + 4.7% rent growth), your $448k cash investment doubles in ~6 years — after that, you're playing with house money.
Negotiation context
- It's been on market 63 days — a 6% lower offer ($1.50M) is reasonable based on typical stale-listing flexibility.
- 15 sale attempts since 24y ago; this cycle's ask has dropped $200k (11%) from the opening price — seller is motivated, your offer sets the floor, not the list.
- Current owner paid $600k; list at $1.60M implies a 167% gain — meaningful room to come down on a strong offer.
Questions for the listing agent
- It's been on market 63 days. Have you received any prior offers? Is the seller open to a 6% concession, seller financing, or rate buy-down credit?
- Can we see the unit-by-unit rent roll, current vacancy, and any below-market leases? What's the average tenancy length?
- What capital expenditures (roof, boiler, parking lot, exteriors) have been made in the last 5 years, and what's planned in the next 2?
- Built in 1967 — when were the roof, HVAC, electrical panel, plumbing, and water heater last replaced?
- Why hasn't it sold? Are there any deal-killer items the seller is aware of (foundation, flood, title, zoning, code violations)?
- Is there a deadline driving the sale (1031 exchange, divorce, estate, relocation)? That informs how much negotiation room exists.
- Schools are D-rated, which usually means shorter tenancies and higher turnover. Who's the typical renter profile here, and what's been the actual vacancy rate?
- What's the average days-on-market for RENTAL listings here right now (not sales)? A rising rental-DOM trend means longer vacancies and softer asking-rent achievability than the comps imply.
- What's the recent tenant-quality profile in this submarket — average credit score on applications, eviction rate, late-payment / NSF rate, and stable-employment percentage? A property-management company in the area should have these aggregated.
- How much new apartment / multifamily construction is in the pipeline within 1–3 miles? Heavy new supply (>2% of stock underway) typically softens rents 12–24 months out; light construction supports rent growth.
Investment metrics
- 1% rule
- 1.48% ✓
- Cap rate
- 12.51%
- Cash-on-cash
- 22.21%
- DSCR
- 1.99
- GRM
- 5.6
CMA / ARV
No comps found within radius.
Projected returns pro-forma
-3.0% appreciation · 4.68% rent growth · sell at horizon
- IRR
- 16.8%
- Equity multiple
- 1.69×
- Total profit
- $309,651
- Equity at exit
- $238,565
- IRR
- 26.5%
- Equity multiple
- 3.51×
- Total profit
- $1,122,701
- Equity at exit
- $138,339
Cash invested: $448,000 (down + closing). Projections, not guarantees.
Landlord ↔ Tenant lean methodology
- Overall (STATE)
- 90 Strongly Landlord-Friendly
- State Indiana
- 90 Strongly Landlord-Friendly · R+11
- County
- — inherits STATE
- City
- — inherits STATE
ZIP-level market 46131
- Home prices YoY
- -27.8%
- Rents YoY
- 4.7%
- Active inventory
- 282
- Price-to-rent
- 90.0×
Monthly cashflow live
- Estimated rent
- $23,706 medium interval (Pro) →
- Mortgage (P&I)
- −$8,391
- Tax from tax record
- −$1,377 /mo · $16,526/yr
- Insurance
- −$667
- HOA
- −$0
- Vacancy / Maint / Mgmt
- −$4,978
- Net cashflow
- $8,293
Break-even live
Sensitivity live
| Price | -10% $9,199 | -5% $8,746 | +0% $8,293 | +5% $7,840 | +10% $7,388 |
|---|---|---|---|---|---|
| Rent | -10% $6,421 | -5% $7,357 | +0% $8,293 | +5% $9,230 | +10% $10,166 |
| Rate | -1.0pp $9,099 | -0.5pp $8,700 | base $8,293 | +0.5pp $7,879 | +1.0pp $7,457 |
16-unit breakdown (identical units grouped — click to expand)
| Units | Beds | Baths | Est. rent |
|---|---|---|---|
| 16× units | 3 | 1 | $23,712 |
| #1 | 3 | 1 | $1,482 |
| #2 | 3 | 1 | $1,482 |
| #3 | 3 | 1 | $1,482 |
| #4 | 3 | 1 | $1,482 |
| #5 | 3 | 1 | $1,482 |
| #6 | 3 | 1 | $1,482 |
| #7 | 3 | 1 | $1,482 |
| #8 | 3 | 1 | $1,482 |
| #9 | 3 | 1 | $1,482 |
| #10 | 3 | 1 | $1,482 |
| #11 | 3 | 1 | $1,482 |
| #12 | 3 | 1 | $1,482 |
| #13 | 3 | 1 | $1,482 |
| #14 | 3 | 1 | $1,482 |
| #15 | 3 | 1 | $1,482 |
| #16 | 3 | 1 | $1,482 |
| Total (16 units) | $23,706 | ||
UW: 25.0% down · 7.5% · 30yr · 1.5% tax · 5.0% vac · 8.0% maint · 8.0% mgmt
Financing live
Cash to close
- Down payment
- $400,000
- Closing costs
- $48,000
- Reserves months
- —
- Total cash needed
- —
Loan-product check · same deal, 3 products live
Conventional
25% down · 7.5% · 30yr
- Down + closing
- —
- Monthly P&I
- —
- Monthly cashflow
- —
- DSCR
- —
- Eligible?
- —
Personal DTI + credit; lowest rate.
DSCR
20% down · 8.5% · 30yr
- Down + closing
- —
- Monthly P&I
- —
- Monthly cashflow
- —
- DSCR
- —
- Eligible?
- —
No personal income docs; deal must DSCR.
Hard money
10% down · 12.0% · 12mo
- Down + closing
- —
- Monthly P&I
- —
- Monthly cashflow
- —
- DSCR
- —
- Eligible?
- —
Short-term bridge; refi at stabilization.
Listing history 36 events
-
2026-05-19price $1,600,000 1012-char remark
Show marketing remark (1012 chars)
Nestled in the heart of Franklin, 1410 E Jefferson Street presents a well-maintained and fully occupied 16-unit investment opportunity comprised of two attractive brick buildings, each containing 8 spacious apartments. Many units have been recently updated with vinyl plank flooring, and each unit features a functional floorplan with a large private patio or balcony, enhancing overall tenant appeal. A common area laundry facility is available for tenant use, providing an additional income stream. The buildings are thoughtfully positioned across from one another, with a large central parking lot offering approximately 40 spaces. Tenants are responsible for all utilities. With consistent rental demand in the Franklin market, this asset presents a compelling opportunity for both stable in-place income and immediate upside, making it an ideal addition for investors seeking a balance of manageability and portfolio growth. Financials available upon request. Seller financing offers will not be considered.
-
2026-04-28price $1,699,000 1012-char remark
Show marketing remark (1012 chars)
Nestled in the heart of Franklin, 1410 E Jefferson Street presents a well-maintained and fully occupied 16-unit investment opportunity comprised of two attractive brick buildings, each containing 8 spacious apartments. Many units have been recently updated with vinyl plank flooring, and each unit features a functional floorplan with a large private patio or balcony, enhancing overall tenant appeal. A common area laundry facility is available for tenant use, providing an additional income stream. The buildings are thoughtfully positioned across from one another, with a large central parking lot offering approximately 40 spaces. Tenants are responsible for all utilities. With consistent rental demand in the Franklin market, this asset presents a compelling opportunity for both stable in-place income and immediate upside, making it an ideal addition for investors seeking a balance of manageability and portfolio growth. Financials available upon request. Seller financing offers will not be considered.
-
2026-03-27$1,800,000 Active 1012-char remark
Show marketing remark (1012 chars)
Nestled in the heart of Franklin, 1410 E Jefferson Street presents a well-maintained and fully occupied 16-unit investment opportunity comprised of two attractive brick buildings, each containing 8 spacious apartments. Many units have been recently updated with vinyl plank flooring, and each unit features a functional floorplan with a large private patio or balcony, enhancing overall tenant appeal. A common area laundry facility is available for tenant use, providing an additional income stream. The buildings are thoughtfully positioned across from one another, with a large central parking lot offering approximately 40 spaces. Tenants are responsible for all utilities. With consistent rental demand in the Franklin market, this asset presents a compelling opportunity for both stable in-place income and immediate upside, making it an ideal addition for investors seeking a balance of manageability and portfolio growth. Financials available upon request. Seller financing offers will not be considered.
-
2026-03-14historical $950
-
2026-03-08$950
-
2025-11-27historical $950
-
2025-10-31price $950
-
2025-10-23price $975
-
2025-09-25$995
-
2025-08-27historical $1,050
-
2025-06-21$1,050
-
2025-06-02historical $1,050
-
2025-03-11$1,050
-
2025-02-07historical $995
-
2025-02-07$995
-
2025-02-07historical $995
-
2025-01-09$995
-
2024-10-08historical $995
-
2024-10-01$995
-
2024-09-27historical $995
-
2024-09-27$995
-
2024-07-09historical $965
-
2024-05-23$965
-
2024-05-19historical $895
-
2024-05-14price $895
-
2024-05-10$965
-
2024-03-19historical $950
-
2024-03-12$950
-
2024-01-24historical $1,100
-
2024-01-20$1,100
-
2012-01-03historical 498-char remark
Show marketing remark (498 chars)
2 brick buildings with a total of 16 well kept apartments. Rents bring in about ninety five hundred per month. Expenses run about thirty-three hundred per month. A great money maker! Coin OP laundry brings in an average of one hundred thirty per month too! New roof, siding, gutters, downspouts, most windows & HVAC. These buildings are a money maker & your hedge on the future! Tenants pay electric incl electric heat. Building pays gas for hot water. 100% rented & quiet neighborhood.
-
2011-12-29soldstatus $600,000 498-char remark
Show marketing remark (498 chars)
2 brick buildings with a total of 16 well kept apartments. Rents bring in about ninety five hundred per month. Expenses run about thirty-three hundred per month. A great money maker! Coin OP laundry brings in an average of one hundred thirty per month too! New roof, siding, gutters, downspouts, most windows & HVAC. These buildings are a money maker & your hedge on the future! Tenants pay electric incl electric heat. Building pays gas for hot water. 100% rented & quiet neighborhood.
-
2011-12-29soldstatus $600,000
Show marketing remark (498 chars)
2 brick buildings with a total of 16 well kept apartments. Rents bring in about ninety five hundred per month. Expenses run about thirty-three hundred per month. A great money maker! Coin OP laundry brings in an average of one hundred thirty per month too! New roof, siding, gutters, downspouts, most windows & HVAC. These buildings are a money maker & your hedge on the future! Tenants pay electric incl electric heat. Building pays gas for hot water. 100% rented & quiet neighborhood.
-
2011-11-16$650,000 498-char remark
Show marketing remark (498 chars)
2 brick buildings with a total of 16 well kept apartments. Rents bring in about ninety five hundred per month. Expenses run about thirty-three hundred per month. A great money maker! Coin OP laundry brings in an average of one hundred thirty per month too! New roof, siding, gutters, downspouts, most windows & HVAC. These buildings are a money maker & your hedge on the future! Tenants pay electric incl electric heat. Building pays gas for hot water. 100% rented & quiet neighborhood.
-
2003-01-17historical
-
2002-06-17$492,250
ⓘ Source: listings_history table (triggers on properties + properties_extension) + one-shot
backfill from property_details.listing_events for pre-trigger history.
Tax reassessment forecast IN · Partial reset (capped growth)
- Current annual tax
- $16,526 · $1,377/mo
- Projected year-2 tax
- $16,526 · $1,377/mo
- Expected delta
- $0/yr ($0/mo · 0.0%)
ⓘ Screening estimate from a state-policy table — verify with the county assessor before closing.
Climate risk First Street
- Flood 1/10 Low FEMA zone X (unshaded) · 0% chance over 30 yrs
- Wildfire 1/10 Low
- Heat 4/10 Moderate 7 d/yr ≥102°F today · 19 d/yr by 30 yrs out
- Wind 2/10 Low 100% chance of damaging wind over 30 yrs
- Air quality 2/10 Low 1 unhealthy d/yr today · 2 by 30 yrs out
Nearby sold comps map
Loading sold comps map…
Walkable amenities ~0.75 mi
Loading nearby amenities…
Taxation est. · year 1
- Rental income
- $284,472
- − Mortgage interest
- −$89,625
- − Property taxes
- −$16,526
- − Insurance
- −$8,000
- − Repairs & maintenance
- −$22,758
- − Management
- −$22,758
- − Depreciation
- −$46,545
- Taxable income
- $78,260
- Est. tax owed @ 24.0%
- −$18,782
- After-tax cash flow
- $80,737/yr
For passive investors: Depreciation is non-cash, so a rental often shows a tax loss while cash-flowing — sheltering income. Rental losses are passive: they offset passive income freely, and up to $25,000/yr can offset ordinary (W-2) income if you actively participate and your MAGI is under $100k (phasing out to $0 by $150k); unused losses carry forward. On sale, claimed depreciation is recaptured at up to 25%, and gains may owe capital-gains tax (a 1031 exchange can defer both). Figures are a year-1 estimate at your 24.0% rate — not tax advice; consult a CPA.
Schools (NCES district)
- District
- Franklin Community School Corporation
- NCES district ID
- 1803690
- Math proficiency
- 36% ▼ -11.00%
- Reading proficiency
- 44% ▼ -8.00%
- Median HH income
- $54,855
- Composite
- 34.93/100
- National rank
- #5066
- State rank
- #133 of 301 in IN
Livability — Franklin
- Score
- 65/100
- State rank
- #351
- US rank
- #13428
Category grades
Schools grade is shown separately in the Schools card above.
Census & demographics
- Census place
- Franklin, IN
- County
- Johnson County · 154,261 people
- City population
- 34,647
- Metro
- Indianapolis-Carmel-Anderson, IN
- Population (ZIP)
- 34,647
- Household income
- $85,076
- Rent vs Own
- Severe rent burden
- 984.0
Population outlook (Johnson County) Hauer SSP2
- Today (2025)
- 170,080 people
- By 2030
- 179,983 · +5.8%
- By 2040
- 198,580 · +16.8%
- By 2050
- 214,661 · +26.2%
- By 2075
- 247,990 · +45.8%
- By 2100
- 257,821 · +51.6%
Race, ethnicity, and origin ACS 2023
- Neighborhood character
- Predominantly White (92%)
- Race & ethnicity
- White 92% Two or more races 4% Hispanic / Latino 2% Black 2%
- Common ancestry
- Slovak 2% Italian 1% Serbian 1%
- Foreign-born
- 2% · Canada
- Languages at home
- 97% English-only · Spanish 2% Russian/Polish/Slavic 1% Other Asian/Pacific 1%
Political lean MEDSL · Johnson
- 2024 margin
- Solid R (+34.3) · D 32.0% · R 66.3% · Other 1.7%
- 2008→2024 swing
- -8.9pp toward R · 2008: -25.5pp · 2024: -34.3pp
- All cycles
- 2024: R+34.3 2020: R+34.1 2016: R+42.5 2012: R+38.5 2008: R+25.5
Not yet ingested
- Civics
- —
Market trends
- HPI YoY
- ▼ -90.53%
- Current HPI
- 235.0009
- Rent YoY
- ▲ 4.68%
- Metro
- Indianapolis-Carmel-Anderson, IN
- State GDP YoY
- ▲ 2.90%
- F500 in state
- 18
Industry mix (Fortune 500 HQ in IN)
| Industry | F500 HQs | Revenue |
|---|---|---|
| Industrial Machinery | 2 | $37B |
|
||
| Healthcare | 1 | $177B |
|
||
| Pharmaceuticals | 1 | $45B |
|
||
| Metals / Steel | 1 | $18B |
|
||
| Agriculture | 1 | $17B |
|
||
| Packaging | 1 | $12B |
|
||
Price history
+225.0% since first listed36 events — show timeline
- 2026-05-19 Price Changed $1,600,000 IRMLS
- 2026-04-28 Price Changed $1,699,000 IRMLS
- 2026-03-27 Listed $1,800,000 IRMLS
- 2026-03-14 Rental Removed $950 MIBOR
- 2026-03-08 Listed for Rent $950 MIBOR
- 2025-11-27 Rental Removed $950 MIBOR
- 2025-10-31 Price Changed $950 MIBOR
- 2025-10-23 Price Changed $975 MIBOR
- 2025-09-25 Listed for Rent $995 MIBOR
- 2025-08-27 Rental Removed $1,050 MIBOR
- 2025-06-21 Listed for Rent $1,050 MIBOR
- 2025-06-02 Rental Removed $1,050 MIBOR
- 2025-03-11 Listed for Rent $1,050 MIBOR
- 2025-02-07 Rental Removed $995 MIBOR
- 2025-02-07 Listed for Rent $995 MIBOR
- 2025-02-07 Rental Removed $995 MIBOR
- 2025-01-09 Listed for Rent $995 MIBOR
- 2024-10-08 Rental Removed $995 MIBOR
- 2024-10-01 Listed for Rent $995 MIBOR
- 2024-09-27 Rental Removed $995 MIBOR
- 2024-09-27 Listed for Rent $995 MIBOR
- 2024-07-09 Rental Removed $965 MIBOR
- 2024-05-23 Listed for Rent $965 MIBOR
- 2024-05-19 Rental Removed $895 LEASESTAR
- 2024-05-14 Price Changed $895 LEASESTAR
- 2024-05-10 Listed for Rent $965 LEASESTAR
- 2024-03-19 Rental Removed $950 MIBOR
- 2024-03-12 Listed for Rent $950 MIBOR
- 2024-01-24 Rental Removed $1,100 LEASESTAR
- 2024-01-20 Listed for Rent $1,100 LEASESTAR
- 2012-01-03 Listing Removed — MIBOR as Distributed by MLS Grid
- 2011-12-29 Sold (Public Records) $600,000 Public Records
- 2011-12-29 Sold (MLS) $600,000 MIBOR as Distributed by MLS Grid
- 2011-11-16 Listed $650,000 MIBOR as Distributed by MLS Grid
- 2003-01-17 Listing Removed — MIBOR as Distributed by MLS Grid
- 2002-06-17 Listed $492,250 MIBOR as Distributed by MLS Grid
Property tax history
+5.5%/yrLatest (2024): $16,526 · -1.0% YoY. Source: county tax records.
Cash-flow waterfall
monthlySold comps — $/sqft
last 12 mo · ≤1 miLoading sold comps…