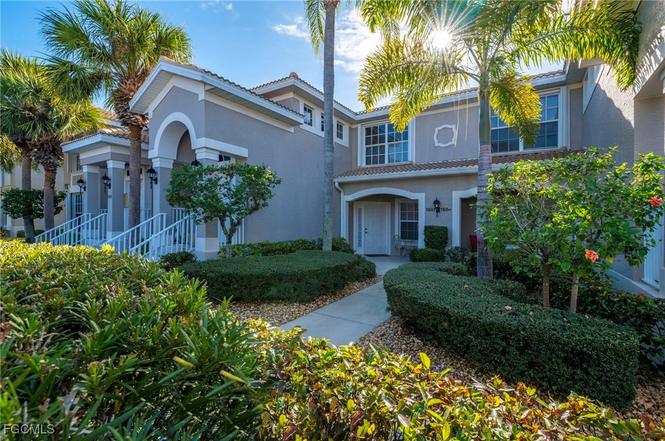
10129 Colonial Country Club Blvd #1507 · Fort Myers, FL
Flood risk 1/10 · Minimal
- FEMA flood zone
- AE
- Chance of flooding over 30 yrs
- 0.0%
- Est. flood insurance / yr
- $1,737 – $8,500
Fire risk 4/10 · Minor
- Est. fire insurance / yr
- $947 – $1,759
Heat risk 10/10 · Severe
- Hot days now (above 107°F)
- 7 days/yr
- Hot days in 30 yrs
- 29 days/yr
Wind risk 10/10 · Severe
- Chance of severe wind over 30 yrs
- 99.0%
Air-quality risk 2/10 · Minimal
- Unhealthy air days now
- 1 days/yr
- Unhealthy air days in 30 yrs
- 1 days/yr
Risk factors via First Street. Map © Google.
Why this score? — see what drove the B grade
The composite is a weighted blend of 9 inputs, each scored 0–100. Each bar is that input's sub-score; the figure is the points it added to the 100-point composite (weight × sub-score).
- Cash flow +30.0/30.0
- 1% rule +10.0/10.0
- DSCR +10.0/10.0
- ARV discount +7.5/15.0
- Livability +4.3/5.0
- Schools +4.1/10.0
- Rent growth +2.6/5.0
- Condition / age +2.5/5.0
- Appreciation +0.0/10.0
$204,900
🖨 Deal sheet (PDF) 📄 Offer letter ✓ Due diligence
Listing remarks
Welcome to this meticulously maintained Gardenia floor plan condominium located within the gated Colonial Country Club community in Fort Myers. Unit 1507 offers a functional layout designed for comfortable everyday living, featuring an open living and dining area with natural light and a screened lanai that overlooks a pond for peaceful evenings. The kitchen is positioned to serve both daily use and entertaining, with ample cabinet space and a convenient flow into the main living areas. The split-bedroom design provides privacy for occupants and guests, while the primary suite includes an en-suite bathroom and generous closet space. New dishwasher, AC new in 2021 and Hot water tank brand ne
Key facts
- Gardenia floor plan
- Screened lanai
- Pond views
Tags
Property features AI
Finance
- Financial info: Pets allowed conditionally; some breed restrictions (no aggressive breeds)
- HOA & community: Homeowners association (annual fee applies); Association fees may be paid quarterly; Association covers management, grounds maintenance, reserves, and water; Community amenities include clubhouse, fitness center, pool, spa/hot tub, tennis courts, pickleball, bocce court, barbecue/picnic areas, restaurant, trails, and management; Community features include golf, gated access, tennis courts, and street lights; Community size: 1,699 units
Exterior
- Parking: Assigned covered parking; Detached carport; One assigned parking space (covered); Has 1-car carport
- Security: Gated community with guard; Security gate; Smoke detector(s)
- Utilities: Public water; Public sewer; Cable available; High-speed internet available; Underground utilities; Reclaimed water irrigation
- Home design: Resale property; Entry level: 1; Faces north; 1 total story (listed stories: 2)
- Construction: Block, concrete and stucco construction; Tile roof
- Exterior features: Lanai; Porch (screened); Sprinkler/irrigation (automatic); Shutters (manual); Pond on lot; Rectangular lot; Private road frontage (private maintained road); South exposure; Lake waterfront
Interior
- Kitchen: Dishwasher; Disposal; Microwave; Range; Refrigerator; Eat-in kitchen
- Bedrooms: Includes bedroom on main level
- Flooring: Carpet; Tile
- Bathrooms: 2 full bathrooms
- Heating & cooling: Central heating (electric); Central air conditioning (electric); Ceiling fan(s); Humidity control
- Interior features: Furnished; Eat-in kitchen; Family/Dining room; Living/Dining room; Main level primary; Bedroom on main level; Split bedroom layout; Shower only (separate shower); Window treatments; Single hung and sliding windows
- Laundry & utility: Washer and dryer (inside laundry)
Neighborhood map
What this means for you Summary
Snapshot
- This is a 2-bed/2.0-bath condo listed at $205k.
Deal economics
- At list price, monthly cash flow is $743 ($9k/yr) — positive.
- The deal already cash-flows at list — no discount required.
- Meets the 1% rule at list price ($4k rent vs $205k).
- Recommended offer: $180k (12.0% below list) — sets the bar for market timing.
- Cap rate 13.1% vs local median 3.0% in Fort Myers — top-decile yield for the area; either an underpriced asset or a hidden risk that comps aren't pricing in. Stress-test before assuming the spread holds.
Location & tenants
- Location reads 86/100 on livability (#14 in FL, #383 nationally) — a professional / high-income tenant draw. Strengths: amenities A+, commute A+, housing A+.
- Lee (suburban): math 47% / reading 50% proficiency, ranked #42 of 73 in FL (top 58%) — families likely to look elsewhere, expect single-tenant / working-renter base with shorter leases.
- Market conditions: Rents flat; 811 active listings in the ZIP; 30 comparable units currently listed for rent nearby; rentals at typical pace (median 25d on market — plan ~3-4 weeks tenant-placement turnaround); high-income renter base; 15,411 units permitted in Lee County in 2024 (4,686 in 5+ unit buildings).
- At $4,480/mo this rent would consume 49% of the median local household income ($110k/yr) (locally 276% of renters already pay >50% of income on rent) — very limited rent-growth headroom before tenants either downsize or default.
Forward outlook
- Local home prices are declining (-3.0%/yr); year-one equity from $1k of loan paydown is wiped out by about $6k of value loss. Plan a longer hold.
- Lee County population projected at +44% by 2050 — long-run rental-demand tailwind backs the buy-and-hold thesis.
Negotiation context
- It's been on market 132 days — a 12% lower offer ($180k) is reasonable based on typical stale-listing flexibility.
Risks & watch-outs
- Watch-outs: flood insurance adds $427/mo.
- Climate carrying-cost: in FEMA flood zone AE (mandatory federal flood insurance); severe wind risk, 99% chance of damaging wind over 30y; extreme-heat days projected 7→29/yr by 2055 (HVAC capex compounding) — expect insurance premiums to compound above CPI over the hold.
Questions for the listing agent
- It's been on market 132 days. Have you received any prior offers? Is the seller open to a 12% concession, seller financing, or rate buy-down credit?
- What's the actual annual flood-insurance premium (NFIP or private), and is the property in a SFHA with mandatory coverage?
- What does the HOA fee cover, when was the last increase, and are there any pending special assessments or reserve-fund shortfalls?
- Any open or pending special assessments — roof, HVAC, plumbing, elevator, façade? What's the per-unit balance and payoff schedule, and is the seller paying it off at close or rolling it to the buyer?
- Why hasn't it sold? Are there any deal-killer items the seller is aware of (foundation, flood, title, zoning, code violations)?
- Is there a deadline driving the sale (1031 exchange, divorce, estate, relocation)? That informs how much negotiation room exists.
- What's the average days-on-market for RENTAL listings here right now (not sales)? A rising rental-DOM trend means longer vacancies and softer asking-rent achievability than the comps imply.
- What's the recent tenant-quality profile in this submarket — average credit score on applications, eviction rate, late-payment / NSF rate, and stable-employment percentage? A property-management company in the area should have these aggregated.
- How much new apartment / multifamily construction is in the pipeline within 1–3 miles? Heavy new supply (>2% of stock underway) typically softens rents 12–24 months out; light construction supports rent growth.
Investment metrics
- 1% rule
- 2.19% ✓
- Cap rate
- 13.14%
- Cash-on-cash
- 24.47%
- DSCR
- 2.09
- GRM
- 3.8
CMA / ARV
No comps found within radius.
Projected returns pro-forma
-3.0% appreciation · 0.37% rent growth · sell at horizon
- IRR
- 1.7%
- Equity multiple
- 1.06×
- Total profit
- $3,505
- Equity at exit
- $30,551
- IRR
- 6.6%
- Equity multiple
- 1.40×
- Total profit
- $22,761
- Equity at exit
- $17,716
Cash invested: $57,372 (down + closing). Projections, not guarantees.
Landlord ↔ Tenant lean methodology
- Overall (STATE)
- 87 Strongly Landlord-Friendly
- State Florida
- 87 Strongly Landlord-Friendly · R+3
- County
- — inherits STATE
- City
- — inherits STATE
ZIP-level market 33913
- Home prices YoY
- -10.3%
- Rents YoY
- 0.4%
- Active inventory
- 811
- Price-to-rent
- 3.8×
Monthly cashflow live
- Estimated rent
- $4,480 high interval (Pro) →
- Mortgage (P&I)
- −$1,075
- Tax from tax record
- −$332 /mo · $3,981/yr
- Insurance
- −$85
- Flood insurance flood zone
- −$427 /mo · $5,118/yr
- HOA
- −$878
- Vacancy / Maint / Mgmt
- −$941
- Net cashflow
- $743
Break-even live
Sensitivity live
| Price | -10% $859 | -5% $801 | +0% $743 | +5% $685 | +10% $627 |
|---|---|---|---|---|---|
| Rent | -10% $389 | -5% $566 | +0% $743 | +5% $920 | +10% $1,097 |
| Rate | -1.0pp $847 | -0.5pp $795 | base $743 | +0.5pp $690 | +1.0pp $636 |
UW: 25.0% down · 7.5% · 30yr · 1.5% tax · 5.0% vac · 8.0% maint · 8.0% mgmt
Financing live
Cash to close
- Down payment
- $51,225
- Closing costs
- $6,147
- Reserves months
- —
- Total cash needed
- —
Loan-product check · same deal, 3 products live
Conventional
25% down · 7.5% · 30yr
- Down + closing
- —
- Monthly P&I
- —
- Monthly cashflow
- —
- DSCR
- —
- Eligible?
- —
Personal DTI + credit; lowest rate.
DSCR
20% down · 8.5% · 30yr
- Down + closing
- —
- Monthly P&I
- —
- Monthly cashflow
- —
- DSCR
- —
- Eligible?
- —
No personal income docs; deal must DSCR.
Hard money
10% down · 12.0% · 12mo
- Down + closing
- —
- Monthly P&I
- —
- Monthly cashflow
- —
- DSCR
- —
- Eligible?
- —
Short-term bridge; refi at stabilization.
Rent comps 30 comps
| Address | Beds | Baths | Sqft | Rent | $/sqft | DOM | Units | Dist |
|---|---|---|---|---|---|---|---|---|
| 10130 Colonial Country Club Blvd #707 Fort Myers, FL | 2.0 | 2.0 | 1116 | $4,900 | $4.39 | 25d | 1 | 0.06mi |
| 10111 Colonial Country Club Blvd #2308 Fort Myers, FL | 2.0 | 2.0 | 1309 | $2,000 | $1.53 | 13d | 1 | 0.22mi |
| 11011 Mill Creek Way #1307 Fort Myers, FL | 2.0 | 2.0 | 1379 | $5,000 | $3.63 | 25d | 1 | 0.22mi |
| 11033 Mill Creek Way #202 Fort Myers, FL | 2.0 | 2.0 | 1379 | $5,400 | $3.92 | 25d | 1 | 0.22mi |
| 9667 Hemingway Ln Unit 3107 Fort Myers, FL | 2.0 | 2.0 | 1209 | $4,900 | $4.05 | 25d | 1 | 0.45mi |
| 9661 Hemingway Ln #3207 Fort Myers, FL | 2.0 | 2.0 | 1300 | $3,900 | $3.00 | 4d | 1 | 0.47mi |
| 9639 Hemingway Ln #3505 Fort Myers, FL | 2.0 | 2.0 | 1234 | $4,800 | $3.89 | 25d | 1 | 0.53mi |
| 9582 Hemingway Ln #3402 Fort Myers, FL | 2.0 | 2.0 | 1382 | $5,500 | $3.98 | 25d | 1 | 0.73mi |
| 9582 Hemingway Ln #3403 Fort Myers, FL | 2.0 | 2.0 | 1385 | $5,400 | $3.90 | 15d | 1 | 0.73mi |
| 9582 Hemingway Ln #3403 Fort Myers, FL | 2.0 | 2.0 | 1385 | $5,400 | $3.90 | 25d | 1 | 0.73mi |
| 10535 Carolina Willow Dr Fort Myers, FL | 3.0 | 2.0 | 1290 | $2,300 | $1.78 | 22d | 1 | 0.75mi |
| 10700 Palazzo Way #201 Fort Myers, FL | 2.0 | 2.0 | 1390 | $5,000 | $3.60 | 22d | 1 | 0.78mi |
| 10711 Palazzo Way Fort Myers, FL | 2.0 | 2.0 | 1257 | $3,900 | $3.10 | 17d | 2 | 0.79mi |
| 10711 Palazzo Way Unit 203 Fort Myers, FL | 2.0 | 2.0 | 1257 | $5,300 | $4.22 | 22d | 1 | 0.79mi |
| 10751 Palazzo Way #103 Fort Myers, FL | 2.0 | 2.0 | 1235 | $5,000 | $4.05 | 25d | 1 | 0.83mi |
| 10518 Avila Cir Fort Myers, FL | 2.0 | 2.0 | 1466 | $6,500 | $4.43 | 25d | 1 | 0.85mi |
| 10518 Avila Cir Fort Myers, FL | 2.0 | 2.0 | 1466 | $6,500 | $4.43 | 4d | 1 | 0.85mi |
| 10791 Palazzo Way #301 Fort Myers, FL | 2.0 | 2.0 | 1390 | $5,300 | $3.81 | 25d | 1 | 0.94mi |
| 10820 Palazzo Way #203 Fort Myers, FL | 2.0 | 2.0 | 1235 | $5,400 | $4.37 | 25d | 1 | 1.03mi |
| 10510 Amiata Way #302 Fort Myers, FL | 2.0 | 2.0 | 1245 | $4,900 | $3.94 | 25d | 1 | 1.15mi |
| 10700 Cetrella Dr Fort Myers, FL | 2.0 | 2.0 | 1227 | $3,500 | $2.85 | 25d | 1 | 1.19mi |
| 10702 Cetrella Dr Fort Myers, FL | 2.0 | 2.0 | 1347 | $5,500 | $4.08 | 25d | 1 | 1.20mi |
| 10530 Amiata Way #103 Fort Myers, FL | 2.0 | 2.0 | 1248 | $2,200 | $1.76 | 25d | 1 | 1.20mi |
| 10714 Cetrella Dr Fort Myers, FL | 2.0 | 2.0 | 1227 | $5,500 | $4.48 | 25d | 1 | 1.22mi |
| 10908 Clarendon St Fort Myers, FL | 3.0 | 2.0 | 1433 | $8,000 | $5.58 | 25d | 1 | 1.23mi |
| 10908 Clarendon St Fort Myers, FL | 3.0 | 2.0 | 1433 | $8,000 | $5.58 | 16d | 1 | 1.23mi |
| 10900 Glenhurst St Fort Myers, FL | 2.0 | 2.0 | 1355 | $2,200 | $1.62 | 4d | 1 | 1.28mi |
| 12171 Treeline Ave Fort Myers, FL | 1.0–3.0 | 1.0–2.0 | 1321 | $2,606 | $1.97 | 4d | 23 | 1.29mi |
| 10700 Ravenna Way Fort Myers, FL | 2.0 | 2.0 | 1251 | $3,488 | $2.79 | 25d | 2 | 1.35mi |
| 10720 Ravenna Way #104 Fort Myers, FL | 2.0 | 2.0 | 1251 | $5,000 | $4.00 | 25d | 1 | 1.37mi |
HOA detail condo
- Monthly dues
- $878 · $10,536/yr
- Likely covers
- watersecurity
- Assessments
- None detected in remarks — confirm with the listing agent.
Listing history 11 events
-
2026-06-13statusdays on market $204,900 Pending 132 DOM
-
2026-06-10days on market $204,900 Active 130 DOM
-
2026-06-09days on market $204,900 Active 129 DOM
-
2026-06-07days on market $204,900 Active 127 DOM
-
2026-06-02days on market $204,900 Active 122 DOM
-
2026-06-01days on market $204,900 Active 121 DOM
-
2026-06-01days on market $204,900 Active 120 DOM
-
2026-04-07price $204,900
-
2026-03-27price $214,900
-
2026-01-31$225,000 Active
-
2005-02-15soldstatus $189,000
ⓘ Source: listings_history table (triggers on properties + properties_extension) + one-shot
backfill from property_details.listing_events for pre-trigger history.
Tax reassessment forecast FL · Resets to sale price
- Current annual tax
- $3,981 · $332/mo
- Projected year-2 tax
- $3,981 · $332/mo
- Expected delta
- $0/yr ($0/mo · 0.0%)
ⓘ Screening estimate from a state-policy table — verify with the county assessor before closing.
Climate risk First Street
- Flood 1/10 Low FEMA zone AE · 0% chance over 30 yrs
- Wildfire 4/10 Moderate
- Heat 10/10 Extreme 7 d/yr ≥107°F today · 29 d/yr by 30 yrs out
- Wind 10/10 Extreme 99% chance of damaging wind over 30 yrs
- Air quality 2/10 Low 1 unhealthy d/yr today · 1 by 30 yrs out
Nearby sold comps map
Loading sold comps map…
Walkable amenities ~0.75 mi
Loading nearby amenities…
Taxation est. · year 1
- Rental income
- $53,766
- − Mortgage interest
- −$11,478
- − Property taxes
- −$3,981
- − Insurance
- −$6,143
- − Repairs & maintenance
- −$4,301
- − Management
- −$4,301
- − HOA
- −$10,536
- − Depreciation
- −$5,961
- Taxable income
- $7,064
- Est. tax owed @ 24.0%
- −$1,695
- After-tax cash flow
- $7,225/yr
For passive investors: Depreciation is non-cash, so a rental often shows a tax loss while cash-flowing — sheltering income. Rental losses are passive: they offset passive income freely, and up to $25,000/yr can offset ordinary (W-2) income if you actively participate and your MAGI is under $100k (phasing out to $0 by $150k); unused losses carry forward. On sale, claimed depreciation is recaptured at up to 25%, and gains may owe capital-gains tax (a 1031 exchange can defer both). Figures are a year-1 estimate at your 24.0% rate — not tax advice; consult a CPA.
Schools (NCES district)
- District
- Lee
- NCES district ID
- 1201080
- Math proficiency
- 47% ▼ -11.00%
- Reading proficiency
- 50% ▼ -4.00%
- Median HH income
- $49,518
- Composite
- 41.49/100
- National rank
- #3458
- State rank
- #42 of 73 in FL
Livability — Fort Myers
- Score
- 86/100
- State rank
- #14
- US rank
- #383
Category grades
Schools grade is shown separately in the Schools card above.
Census & demographics
- Census place
- Fort Myers, FL
- County
- Lee County · 788,662 people
- City population
- 278,598
- Metro
- Cape Coral-Fort Myers, FL
- Population (ZIP)
- 31,538
- Household income
- $110,373
- Rent vs Own
- Severe rent burden
- 276.0
Population outlook (Lee County) Hauer SSP2
- Today (2025)
- 871,946 people
- By 2030
- 955,468 · +9.6%
- By 2040
- 1,113,587 · +27.7%
- By 2050
- 1,256,891 · +44.1%
- By 2075
- 1,560,270 · +78.9%
- By 2100
- 1,726,848 · +98.0%
Race, ethnicity, and origin ACS 2023
- Neighborhood character
- Predominantly White (74%)
- Race & ethnicity
- White 74% Hispanic / Latino 13% Two or more races 11% Black 5% Asian 2%
- Hispanic origin (detail)
- Mexican 3% Puerto Rican 3% Cuban 2%
- Common ancestry
- Romanian 5% Lithuanian 3% Slovak 2%
- Foreign-born
- 14% · Canada, Vietnam, China
- Languages at home
- 84% English-only · Spanish 10% Other Indo-European 2% French/Haitian/Cajun 2%
Political lean MEDSL · Lee
- 2024 margin
- Strong R (+28.4) · D 35.5% · R 63.9%
- 2008→2024 swing
- -18.0pp toward R · 2008: -10.4pp · 2024: -28.4pp
- All cycles
- 2024: R+28.4 2020: R+19.2 2016: R+20.4 2012: R+16.6 2008: R+10.4
Not yet ingested
- Civics
- —
Market trends
- HPI YoY
- ▼ -25.45%
- Current HPI
- 221.7115
- Rent YoY
- ▲ 0.37%
- Metro
- Cape Coral-Fort Myers, FL
- State GDP YoY
- ▲ 3.28%
- F500 in state
- 36
Industry mix (Fortune 500 HQ in FL)
| Industry | F500 HQs | Revenue |
|---|---|---|
| Industrial Technology | 2 | $29B |
|
||
| Insurance | 2 | $17B |
|
||
| Retail | 1 | $60B |
|
||
| Technology Distribution | 1 | $58B |
|
||
| Homebuilding | 1 | $35B |
|
||
| Technology Manufacturing | 1 | $35B |
|
||
Price history
+8.4% since first listed4 events — show timeline
- 2026-04-07 Price Changed $204,900 FORTMLS
- 2026-03-27 Price Changed $214,900 FORTMLS
- 2026-01-31 Listed $225,000 FORTMLS
- 2005-02-15 Sold (Public Records) $189,000 Public Records
Property tax history
+3.2%/yrLatest (2025): $3,981 · +0.6% YoY. Source: county tax records.
Cash-flow waterfall
monthlySold comps — $/sqft
last 12 mo · ≤1 miLoading sold comps…