432 S Harbor Blvd #135 · Santa Ana, CA
Flood risk 2/10 · Minimal
- FEMA flood zone
- X
- Chance of flooding over 30 yrs
- 0.03%
- Est. flood insurance / yr
- $507 – $1,088
Fire risk 1/10 · Minimal
- Est. fire insurance / yr
- $659 – $1,223
Heat risk 5/10 · Moderate
- Hot days now (above 89°F)
- 7 days/yr
- Hot days in 30 yrs
- 23 days/yr
Wind risk 1/10 · Minimal
- Chance of severe wind over 30 yrs
- —
Air-quality risk 4/10 · Minor
- Unhealthy air days now
- 5 days/yr
- Unhealthy air days in 30 yrs
- 5 days/yr
Risk factors via First Street. Map © Google.
Why this score? — see what drove the B+ grade
The composite is a weighted blend of 9 inputs, each scored 0–100. Each bar is that input's sub-score; the figure is the points it added to the 100-point composite (weight × sub-score).
- Cash flow +30.0/30.0
- ARV discount +14.6/15.0
- 1% rule +10.0/10.0
- DSCR +10.0/10.0
- Schools +4.5/10.0
- Rent growth +3.0/5.0
- Livability +2.8/5.0
- Condition / age +2.5/5.0
- Appreciation +0.0/10.0
$87,000
🖨 Deal sheet (PDF) 📄 Offer letter ✓ Due diligence
Listing remarks MLS
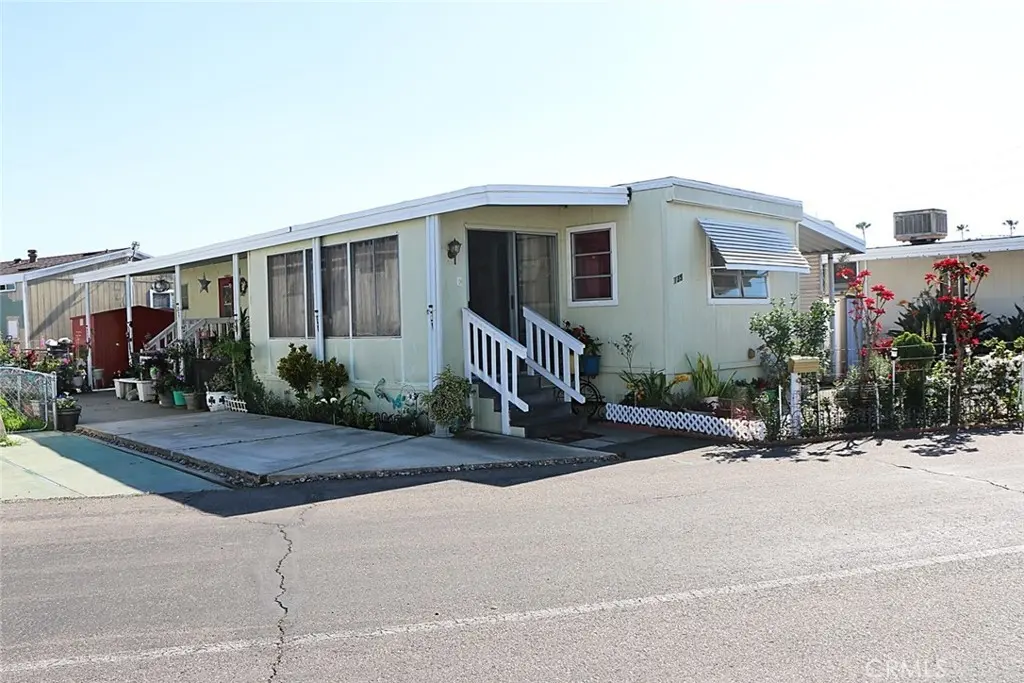
Charming Home in the Desirable Bali Hi Senior Gated Community (55+/45). Ideally situated near shopping, dining, transportation, entertainment, and everyday conveniences. From the moment you arrive, you’ll be greeted by beautiful plants and blooming flowers, creating a warm and relaxing outdoor setting. The exterior features a 2-car carport, additional third parking space, a long-covered porch, and an enclosed front entry room. Step inside to a bright and spacious living room that flows seamlessly into the kitchen, highlighted by a skylight that fills the space with natural light. The home also offers laminate flooring, window shades, a wall gas heater, and a convenient interior laundry area. A rear storage shed provides extra space for tools and belongings. For added value, the stove, refrigerator, microwave, washer, and dryer may remain with the home (without warranty). Residents of Bali Hi enjoy wonderful community amenities including an onsite manager, two sparkling swimming pools, and a clubhouse. MAKE THIS YOUR HOME!
Key facts
- Rear storage shed
- Long-covered porch
- Skylight
Tags
Neighborhood map
What this means for you Summary
Snapshot
- This is a 1-bed/1.0-bath manufactured listed at $87k.
Deal economics
- At list price, monthly cash flow is $1k ($14k/yr) — positive.
- The deal already cash-flows at list — no discount required.
- Meets the 1% rule at list price ($2k rent vs $87k).
- Recommended offer: $79k (9.0% below list) — sets the bar for market timing.
- Cap rate 22.2% vs local median 2.5% in Santa Ana — top-decile yield for the area; either an underpriced asset or a hidden risk that comps aren't pricing in. Stress-test before assuming the spread holds.
Location & tenants
- Location reads 55/100 on livability (#871 in CA) — a working-class tenant base; expect higher turnover. Strengths: employment A; Watch: crime D-, amenities F, commute F.
- Garden Grove Unified (suburban): math 38% / reading 65% proficiency, ranked #132 of 517 in CA (top 26%) — acceptable for families but not a draw, mixed tenant base, ~2y average lease; 60% free/reduced lunch — lower-income household profile, screen leases tightly.
- Zoned schools: James Monroe Elementary (568 students, 65% FRL); Stephen R. Fitz Intermediate (507 students, 91% FRL); Los Amigos High (math 25% / reading 64%, grade F, #434 of 1,170 statewide, top 39%, 1,604 students, 93% FRL) — zoned schools average 83% FRL vs 60% district-wide (23 pts higher); higher-poverty schools than district average — tighter screening recommended.
- Market conditions: Rents rising (+2.2%/yr); 78 active listings in the ZIP; 23 comparable units currently listed for rent nearby; rentals at typical pace (median 17d on market — plan ~3-4 weeks tenant-placement turnaround); solid renter incomes; 6,974 units permitted in Orange County in 2024 (3,839 in 5+ unit buildings).
Forward outlook
- Local home prices are declining (-3.0%/yr); year-one equity from $601 of loan paydown is wiped out by about $3k of value loss. Plan a longer hold.
- Orange County population projected at +14% by 2050 — modest demand growth; plan on rents tracking national, not racing it.
- At projected returns (-3.0% appreciation + 2.2% rent growth), your $24k cash investment doubles in ~3 years — after that, you're playing with house money.
Negotiation context
- It's been on market 100 days — a 9% lower offer ($79k) is reasonable based on typical stale-listing flexibility.
Risks & watch-outs
- Climate carrying-cost: extreme-heat days projected 7→23/yr by 2055 (HVAC capex compounding) — expect insurance premiums to compound above CPI over the hold.
Questions for the listing agent
- It's been on market 100 days. Have you received any prior offers? Is the seller open to a 9% concession, seller financing, or rate buy-down credit?
- Built in 1965 — when were the roof, HVAC, electrical panel, plumbing, and water heater last replaced?
- Why hasn't it sold? Are there any deal-killer items the seller is aware of (foundation, flood, title, zoning, code violations)?
- Is there a deadline driving the sale (1031 exchange, divorce, estate, relocation)? That informs how much negotiation room exists.
- Schools are D-rated, which usually means shorter tenancies and higher turnover. Who's the typical renter profile here, and what's been the actual vacancy rate?
- Crime grade is D in this area — have there been break-ins, vandalism, or insurance claims at this property in the last 3 years? What carrier currently insures it and at what premium?
- What's the average days-on-market for RENTAL listings here right now (not sales)? A rising rental-DOM trend means longer vacancies and softer asking-rent achievability than the comps imply.
- What's the recent tenant-quality profile in this submarket — average credit score on applications, eviction rate, late-payment / NSF rate, and stable-employment percentage? A property-management company in the area should have these aggregated.
- How much new for-sale + rental construction is in the pipeline within 1–3 miles? Heavy new supply typically softens prices + rents 12–24 months out; constrained supply supports both.
Investment metrics
- 1% rule
- 2.55% ✓
- Cap rate
- 22.15%
- Cash-on-cash
- 56.63%
- DSCR
- 3.52
- GRM
- 3.3
CMA / ARV
- ARV (median comp)
- $103,394
- List price
- $87,000
- Delta
- -15.86%
- Verdict
- UNDERPRICED
- Comps
- 5 within 2.0 mi
Projected returns pro-forma
-3.0% appreciation · 2.16% rent growth · sell at horizon
- IRR
- 54.1%
- Equity multiple
- 3.35×
- Total profit
- $57,302
- Equity at exit
- $12,972
- IRR
- 58.9%
- Equity multiple
- 6.62×
- Total profit
- $136,826
- Equity at exit
- $7,522
Cash invested: $24,360 (down + closing). Projections, not guarantees.
Landlord ↔ Tenant lean methodology
- Overall (STATE)
- 18 Strongly Tenant-Friendly
- State California
- 18 Strongly Tenant-Friendly · D+13
- County
- — inherits STATE
- City
- — inherits STATE
ZIP-level market 92704
- Rents YoY
- 2.2%
- Active inventory
- 78
- Price-to-rent
- 3.3×
Monthly cashflow live
- Estimated rent
- $2,216 high interval (Pro) →
- Mortgage (P&I)
- −$456
- Tax est. 1.5%
- −$109 /mo · $1,305/yr
- Insurance
- −$36
- HOA
- −$0
- Vacancy / Maint / Mgmt
- −$465
- Net cashflow
- $1,150
Break-even live
Sensitivity live
| Price | -10% $1,210 | -5% $1,180 | +0% $1,150 | +5% $1,120 | +10% $1,090 |
|---|---|---|---|---|---|
| Rent | -10% $975 | -5% $1,062 | +0% $1,150 | +5% $1,237 | +10% $1,325 |
| Rate | -1.0pp $1,194 | -0.5pp $1,172 | base $1,150 | +0.5pp $1,127 | +1.0pp $1,104 |
UW: 25.0% down · 7.5% · 30yr · 1.5% tax · 5.0% vac · 8.0% maint · 8.0% mgmt
Financing live
Cash to close
- Down payment
- $21,750
- Closing costs
- $2,610
- Reserves months
- —
- Total cash needed
- —
Loan-product check · same deal, 3 products live
Conventional
25% down · 7.5% · 30yr
- Down + closing
- —
- Monthly P&I
- —
- Monthly cashflow
- —
- DSCR
- —
- Eligible?
- —
Personal DTI + credit; lowest rate.
DSCR
20% down · 8.5% · 30yr
- Down + closing
- —
- Monthly P&I
- —
- Monthly cashflow
- —
- DSCR
- —
- Eligible?
- —
No personal income docs; deal must DSCR.
Hard money
10% down · 12.0% · 12mo
- Down + closing
- —
- Monthly P&I
- —
- Monthly cashflow
- —
- DSCR
- —
- Eligible?
- —
Short-term bridge; refi at stabilization.
Rent comps 23 comps
| Address | Beds | Baths | Sqft | Rent | $/sqft | DOM | Units | Dist |
|---|---|---|---|---|---|---|---|---|
| 4200 W 1st St Santa Ana, CA | 1.0–2.0 | 1.0–2.0 | 714 | $2,239 | $3.13 | 0d | 5 | 0.34mi |
| 225 S Newhope St Santa Ana, CA | 1.0–2.0 | 1.0–2.0 | 822 | $1,863 | $2.27 | 1d | 2 | 0.37mi |
| 901 S Harbor Blvd Unit 0251 Santa Ana, CA | 1.0 | 1.0 | 516 | $2,185 | $4.23 | 1d | 1 | 0.40mi |
| 901 S Harbor Blvd Unit 0307 Santa Ana, CA | 1.0 | 1.0 | 516 | $2,260 | $4.38 | 45d | 1 | 0.40mi |
| 901 S Harbor Blvd Unit 130 Santa Ana, CA | — | 1.0 | 386 | $1,855 | $4.81 | 45d | 1 | 0.40mi |
| 901 S Harbor Blvd Unit 146 Santa Ana, CA | — | 1.0 | 386 | $1,895 | $4.91 | 5d | 1 | 0.40mi |
| 901 S Harbor Blvd Unit 0161 Santa Ana, CA | — | 1.0 | 386 | $1,885 | $4.88 | 45d | 1 | 0.40mi |
| 901 S Harbor Blvd Unit 0133 Santa Ana, CA | 1.0 | 1.0 | 516 | $2,180 | $4.22 | 1d | 1 | 0.40mi |
| 901 S Harbor Blvd Unit 0136 Santa Ana, CA | 1.0 | 1.0 | 516 | $2,055 | $3.98 | 1d | 1 | 0.40mi |
| 901 S Harbor Blvd Unit 0167 Santa Ana, CA | — | 1.0 | 386 | $1,830 | $4.74 | 1d | 1 | 0.40mi |
| 901 S Harbor Blvd Unit 109 Santa Ana, CA | — | 1.0 | 386 | $1,940 | $5.03 | 45d | 1 | 0.40mi |
| 901 S Harbor Blvd Unit 340 Santa Ana, CA | 1.0 | 1.0 | 516 | $2,180 | $4.22 | 26d | 1 | 0.40mi |
| 901 S Harbor Blvd Apt 247 Santa Ana, CA | 1.0 | 1.0 | 516 | $2,215 | $4.29 | 13d | 1 | 0.40mi |
| 3900 W 5th St Santa Ana, CA | 1.0–2.0 | 1.0–2.0 | 780 | $2,175 | $2.79 | 14d | 1 | 0.47mi |
| 3200 W 5th St Santa Ana, CA | 1.0–2.0 | 1.0–2.0 | 769 | $2,978 | $3.87 | 0d | 9 | 0.71mi |
| 2701 W McFadden Ave Unit 84 Santa Ana, CA | 1.0 | 1.0 | 480 | $2,360 | $4.92 | 26d | 1 | 1.03mi |
| 2701 W McFadden Ave Unit 108 Santa Ana, CA | 1.0 | 1.0 | 480 | $2,295 | $4.78 | 26d | 1 | 1.04mi |
| 2701 W McFadden Ave Unit 18 Santa Ana, CA | 1.0 | 1.0 | 480 | $2,385 | $4.97 | 0d | 1 | 1.05mi |
| 2701 W McFadden Ave Santa Ana, CA | 1.0 | 1.0 | 480 | $2,228 | $4.64 | 17d | 3 | 1.05mi |
| 2701 W McFadden Ave Apt 107 Santa Ana, CA | 1.0 | 1.0 | 480 | $2,095 | $4.36 | 26d | 1 | 1.06mi |
| 16350 S Harbor Blvd Santa Ana, CA | 1.0–2.0 | 1.0 | 800 | $2,210 | $2.76 | 45d | 1 | 1.09mi |
| 1500 N Harbor Blvd Santa Ana, CA | 1.0–2.0 | 1.0–2.0 | 780 | $2,575 | $3.30 | 17d | 1 | 1.16mi |
| 3630 Westminster Ave Santa Ana, CA | 1.0 | 1.0 | 696 | $2,508 | $3.60 | 23d | 1 | 1.24mi |
Listing history 14 events
-
2026-06-17days on market $87,000 Active 100 DOM
-
2026-06-16days on market $87,000 Active 99 DOM
-
2026-06-15days on market $87,000 Active 98 DOM
-
2026-06-13days on market $87,000 Active 96 DOM
-
2026-06-13days on market $87,000 Active 95 DOM
-
2026-06-09days on market $87,000 Active 92 DOM
-
2026-06-08days on market $87,000 Active 91 DOM
-
2026-06-07days on market $87,000 Active 90 DOM
-
2026-06-04days on market $87,000 Active 87 DOM
-
2026-06-03days on market $87,000 Active 86 DOM
-
2026-06-02days on market $87,000 Active 85 DOM
-
2026-06-01days on market $87,000 Active 84 DOM
-
2026-05-31days on market $87,000 Active 83 DOM
-
2026-03-09$87,000 Active 1043-char remark
Show marketing remark (1043 chars)
Charming Home in the Desirable Bali Hi Senior Gated Community (55+/45). Ideally situated near shopping, dining, transportation, entertainment, and everyday conveniences. From the moment you arrive, you’ll be greeted by beautiful plants and blooming flowers, creating a warm and relaxing outdoor setting. The exterior features a 2-car carport, additional third parking space, a long-covered porch, and an enclosed front entry room. Step inside to a bright and spacious living room that flows seamlessly into the kitchen, highlighted by a skylight that fills the space with natural light. The home also offers laminate flooring, window shades, a wall gas heater, and a convenient interior laundry area. A rear storage shed provides extra space for tools and belongings. For added value, the stove, refrigerator, microwave, washer, and dryer may remain with the home (without warranty). Residents of Bali Hi enjoy wonderful community amenities including an onsite manager, two sparkling swimming pools, and a clubhouse. MAKE THIS YOUR HOME!
ⓘ Source: listings_history table (triggers on properties + properties_extension) + one-shot
backfill from property_details.listing_events for pre-trigger history.
Climate risk First Street
- Flood 2/10 Low FEMA zone X · 3% chance over 30 yrs
- Wildfire 1/10 Low
- Heat 5/10 Major 7 d/yr ≥89°F today · 23 d/yr by 30 yrs out
- Wind 1/10 Low
- Air quality 4/10 Moderate 5 unhealthy d/yr today · 5 by 30 yrs out
Nearby sold comps map
Loading sold comps map…
Walkable amenities ~0.75 mi
Loading nearby amenities…
Taxation est. · year 1
- Rental income
- $26,596
- − Mortgage interest
- −$4,873
- − Property taxes
- −$1,305
- − Insurance
- −$435
- − Repairs & maintenance
- −$2,128
- − Management
- −$2,128
- − Depreciation
- −$2,531
- Taxable income
- $13,197
- Est. tax owed @ 24.0%
- −$3,167
- After-tax cash flow
- $10,629/yr
For passive investors: Depreciation is non-cash, so a rental often shows a tax loss while cash-flowing — sheltering income. Rental losses are passive: they offset passive income freely, and up to $25,000/yr can offset ordinary (W-2) income if you actively participate and your MAGI is under $100k (phasing out to $0 by $150k); unused losses carry forward. On sale, claimed depreciation is recaptured at up to 25%, and gains may owe capital-gains tax (a 1031 exchange can defer both). Figures are a year-1 estimate at your 24.0% rate — not tax advice; consult a CPA.
Schools (NCES district)
- District
- Garden Grove Unified
- NCES district ID
- 0614880
- Math proficiency
- 38% ▼ -14.00%
- Reading proficiency
- 65% ▲ 4.00%
- Median HH income
- $60,089
- Composite
- 44.89/100
- National rank
- #2715
- State rank
- #132 of 517 in CA
Livability — Santa Ana
- Score
- 55/100
- State rank
- #871
- US rank
- #23502
Category grades
Schools grade is shown separately in the Schools card above.
Census & demographics
- Census place
- Santa Ana, CA
- County
- Orange County · 3,096,323 people
- City population
- 288,255
- Metro
- Los Angeles-Long Beach-Anaheim, CA
- Population (ZIP)
- 82,120
- Household income
- $99,777
- Rent vs Own
- Severe rent burden
- 2188.0
Population outlook (Orange County) Hauer SSP2
- Today (2025)
- 3,477,456 people
- By 2030
- 3,613,117 · +3.9%
- By 2040
- 3,835,945 · +10.3%
- By 2050
- 3,968,736 · +14.1%
- By 2075
- 4,097,053 · +17.8%
- By 2100
- 3,903,633 · +12.3%
Race, ethnicity, and origin ACS 2023
- Neighborhood character
- Predominantly Hispanic (71%)
- Race & ethnicity
- Hispanic / Latino 71% Asian 18% Two or more races 17% White 9% Native American 2%
- Hispanic origin (detail)
- Mexican 65%
- Common ancestry
- Italian 1%
- Foreign-born
- 44% · Canada, Vietnam, China
- Languages at home
- 22% English-only · Spanish 61% Vietnamese 13% Other Asian/Pacific 2%
Political lean MEDSL · Orange
- 2024 margin
- Toss-up / Even · D 49.7% · R 47.1% · Other 3.2%
- 2008→2024 swing
- +5.2pp toward D · 2008: -2.6pp · 2024: 2.6pp
- All cycles
- 2024: D+2.6 2020: D+9.0 2016: D+7.7 2012: R+8.3 2008: R+2.6
Not yet ingested
- Civics
- —
Market trends
- HPI YoY
- ▼ -991.35%
- Current HPI
- 449.8874
- Rent YoY
- ▲ 2.16%
- Metro
- Los Angeles-Long Beach-Anaheim, CA
- State GDP YoY
- ▲ 3.21%
- F500 in state
- 116
Industry mix (Fortune 500 HQ in CA)
| Industry | F500 HQs | Revenue |
|---|---|---|
| Technology | 27 | $1,492B |
|
||
| Financial Services | 3 | $174B |
|
||
| Retail | 3 | $44B |
|
||
| Insurance | 3 | $26B |
|
||
| Media / Entertainment | 2 | $115B |
|
||
| Pharmaceuticals / Biotech | 2 | $62B |
|
||
Price history
1 event — show timeline
- 2026-03-09 Listed $87,000 CRMLS
Cash-flow waterfall
monthlySold comps — $/sqft
last 12 mo · ≤1 miLoading sold comps…