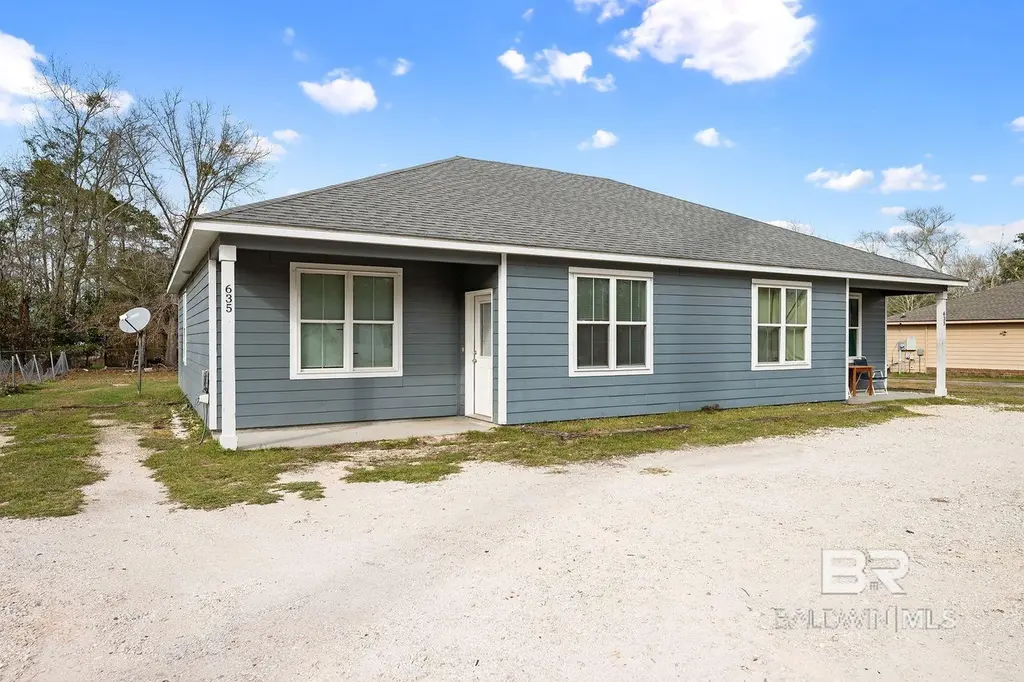
 Duplex
635 E Azalea Ave · Foley, AL
Flood risk 1/10 · Minimal
- FEMA flood zone
- X (unshaded)
- Chance of flooding over 30 yrs
- 0.0%
- Est. flood insurance / yr
- $507 – $1,088
Fire risk 3/10 · Minor
- Est. fire insurance / yr
- $916 – $1,700
Heat risk 10/10 · Severe
- Hot days now (above 105°F)
- 7 days/yr
- Hot days in 30 yrs
- 22 days/yr
Wind risk 9/10 · Severe
- Chance of severe wind over 30 yrs
- 99.0%
Air-quality risk 3/10 · Minor
- Unhealthy air days now
- 2 days/yr
- Unhealthy air days in 30 yrs
- 4 days/yr
Risk factors via First Street. Map © Google.
Why this score? — see what drove the D grade
The composite is a weighted blend of 9 inputs, each scored 0–100. Each bar is that input's sub-score; the figure is the points it added to the 100-point composite (weight × sub-score).
- Cash flow +12.9/30.0
- ARV discount +7.5/15.0
- DSCR +3.9/10.0
- Schools +3.9/10.0
- 1% rule +3.7/10.0
- Livability +3.1/5.0
- Rent growth +3.0/5.0
- Condition / age +2.2/5.0
- Appreciation +0.0/10.0
$355,000
🖨 Deal sheet (PDF) 📄 Offer letter ✓ Due diligence
Multi-family units
County records classify this as Multi-Family (2-4 Unit). Listing-text estimate: 2 units. confirmed
Listing remarks MLS
Immediate income producing duplex in Foley. Built in 2016. 3/1 per side. Tenants in place that must remain per seller. Serious inquirers may request monthly rent amount from agent. This is a great opportunity for investors looking to expand their rental portfolio with tenants in place.
Key facts
- Functional kitchen
- Short term rentals
- Vinyl flooring
Tags
Property features AI
Finance
- Other: Listing office: RE/MAX of Orange Beach
- HOA & community: Community features: Other; No transfer fees
Exterior
- Parking: See remarks for parking details
- Utilities: Riviera Utilities; Electric power; Public or conventional sewer (not specified)
- Home design: Duplex; Single-story; Resale condition; Slab foundation
- Construction: Concrete board and wood frame construction; Fortified Gold construction standard; Composition roof
- Exterior features: Less than 1 acre lot; No waterfront; Attached property
Interior
- Kitchen: Electric range; Refrigerator
- Bedrooms: Primary bedroom on the main level (approx. 9' x 12'); Two additional bedrooms (each approx. 8' x 12')
- Flooring: Carpet; Vinyl
- Bathrooms: Two full bathrooms
- Heating & cooling: Heat pump heating and cooling; Electric heating available; Ceiling fans assist cooling
- Interior features: Ceiling fans throughout; No fireplace; Living/dining combination
Neighborhood map
What this means for you Summary
Snapshot
- This is a 2 × 3-bed/1.0-bath units multifamily listed at $355k. Condition is rated fair.
Deal economics
- At list price, monthly cash flow is $-25 ($-298/yr) — negative. Per door: $-12/mo.
- To cash-flow at today's rent, offer at most $351k (1.0% below list).
- To meet the 1% rule (rent ≥ 1% of price), the offer needs to be $307k (13.4% below list).
- Recommended offer: $307k (13.4% below list) — sets the bar for 1% rule.
- Cap rate 6.2% vs local median 4.0% in Foley — top-decile yield for the area; either an underpriced asset or a hidden risk that comps aren't pricing in. Stress-test before assuming the spread holds.
Location & tenants
- Location reads 61/100 on livability (#241 in AL) — a middle-class / working-renter tenant base. Strengths: housing A+, cost of living A-, crime B; Watch: employment D+, amenities F, commute F.
- Baldwin County (rural): math 33% / reading 57% proficiency, ranked #18 of 129 in AL (top 14%) — families likely to look elsewhere, expect single-tenant / working-renter base with shorter leases.
- Zoned schools: Foley Elementary School (math 22% / reading 44%, grade F, #323 of 627 statewide, top 52%, 992 students, 76% FRL); Foley Middle School (math 11% / reading 36%, grade F, #172 of 257 statewide, top 68%, 783 students, 82% FRL); Foley High School (math 24% / reading 25%, grade F, #118 of 305 statewide, top 45%, 1,578 students, 75% FRL) — zoned schools average 78% FRL vs 38% district-wide (40 pts higher); higher-poverty schools than district average — tighter screening recommended.
- Zoned-school proficiency averages 27% at this address vs 45% district-wide (-18 pts) — the specific schools serving this property underperform the Baldwin County average; the district grade overstates school quality for this exact location.
- Market conditions: Rents rising (+1.8%/yr); 883 active listings in the ZIP; 1 comparable units currently listed for rent nearby; 3,883 units permitted in Baldwin County in 2024 (481 in 5+ unit buildings).
- At $3,074/mo this rent would consume 55% of the median local household income ($67k/yr) (locally 803% of renters already pay >50% of income on rent) — very limited rent-growth headroom before tenants either downsize or default.
Forward outlook
- Local home prices are declining (-3.0%/yr); year-one equity from $2k of loan paydown is wiped out by about $11k of value loss. Plan a longer hold.
- Baldwin County population projected at +42% by 2050 — long-run rental-demand tailwind backs the buy-and-hold thesis.
Negotiation context
- It's been on market 19 days — a 2% lower offer ($350k) is reasonable based on typical stale-listing flexibility.
- 5 sale attempts since 5y ago with the ask held roughly flat each time — persistent listings suggest the price (not the market) is what's stuck; bring a comps-based counter.
- Current owner paid $212k; list at $355k implies a 67% gain — meaningful room to come down on a strong offer.
Risks & watch-outs
- Climate carrying-cost: severe wind risk, 99% chance of damaging wind over 30y; extreme-heat days projected 7→22/yr by 2055 (HVAC capex compounding) — expect insurance premiums to compound above CPI over the hold.
Questions for the listing agent
- What do current leases actually rent for vs. the listed asking? Can we see a recent rent roll and the last 12 months of T-12 income?
- Can we see the unit-by-unit rent roll, current vacancy, and any below-market leases? What's the average tenancy length?
- What capital expenditures (roof, boiler, parking lot, exteriors) have been made in the last 5 years, and what's planned in the next 2?
- Have any recent inspections been done? Can we get a copy of the seller's disclosures and any deferred-maintenance estimates?
- Is there a deadline driving the sale (1031 exchange, divorce, estate, relocation)? That informs how much negotiation room exists.
- Schools are D-rated, which usually means shorter tenancies and higher turnover. Who's the typical renter profile here, and what's been the actual vacancy rate?
- The area grade is low — what's the realistic commute time and amenity access for the typical tenant pool here? Any planned neighborhood developments (good or bad) we should know about?
- What's the average days-on-market for RENTAL listings here right now (not sales)? A rising rental-DOM trend means longer vacancies and softer asking-rent achievability than the comps imply.
- What's the recent tenant-quality profile in this submarket — average credit score on applications, eviction rate, late-payment / NSF rate, and stable-employment percentage? A property-management company in the area should have these aggregated.
- How much new apartment / multifamily construction is in the pipeline within 1–3 miles? Heavy new supply (>2% of stock underway) typically softens rents 12–24 months out; light construction supports rent growth.
Investment metrics
- 1% rule
- 0.87% ✗
- Cap rate
- 6.21%
- Cash-on-cash
- -0.30%
- DSCR
- 0.99
- GRM
- 9.6
CMA / ARV
No comps found within radius.
Projected returns pro-forma
-3.0% appreciation · 1.81% rent growth · sell at horizon
- IRR
- -18.1%
- Equity multiple
- 0.37×
- Total profit
- $-62,700
- Equity at exit
- $52,932
- IRR
- -12.8%
- Equity multiple
- 0.29×
- Total profit
- $-71,023
- Equity at exit
- $30,694
Cash invested: $99,400 (down + closing). Projections, not guarantees.
Landlord ↔ Tenant lean methodology
- Overall (STATE)
- 90 Strongly Landlord-Friendly
- State Alabama
- 90 Strongly Landlord-Friendly · R+15
- County
- — inherits STATE
- City
- — inherits STATE
ZIP-level market 36535
- Home prices YoY
- -24.9%
- Rents YoY
- 1.8%
- Active inventory
- 883
- Price-to-rent
- 19.2×
Monthly cashflow live
- Estimated rent
- $3,074 high interval (Pro) →
- Mortgage (P&I)
- −$1,862
- Tax est. 1.5%
- −$444 /mo · $5,325/yr
- Insurance
- −$148
- HOA
- −$0
- Vacancy / Maint / Mgmt
- −$646
- Net cashflow
- $-25
Break-even live
Sensitivity live
| Price | -10% $220 | -5% $98 | +0% $-25 | +5% $-148 | +10% $-270 |
|---|---|---|---|---|---|
| Rent | -10% $-268 | -5% $-146 | +0% $-25 | +5% $97 | +10% $218 |
| Rate | -1.0pp $154 | -0.5pp $65 | base $-25 | +0.5pp $-117 | +1.0pp $-210 |
2-unit breakdown (identical units grouped — click to expand)
| Units | Beds | Baths | Est. rent |
|---|---|---|---|
| 2× units | 3 | 1 | $3,074 |
| #1 | 3 | 1 | $1,537 |
| #2 | 3 | 1 | $1,537 |
| Total (2 units) | $3,074 | ||
UW: 25.0% down · 7.5% · 30yr · 1.5% tax · 5.0% vac · 8.0% maint · 8.0% mgmt
Financing live
Cash to close
- Down payment
- $88,750
- Closing costs
- $10,650
- Reserves months
- —
- Total cash needed
- —
Loan-product check · same deal, 3 products live
Conventional
25% down · 7.5% · 30yr
- Down + closing
- —
- Monthly P&I
- —
- Monthly cashflow
- —
- DSCR
- —
- Eligible?
- —
Personal DTI + credit; lowest rate.
DSCR
20% down · 8.5% · 30yr
- Down + closing
- —
- Monthly P&I
- —
- Monthly cashflow
- —
- DSCR
- —
- Eligible?
- —
No personal income docs; deal must DSCR.
Hard money
10% down · 12.0% · 12mo
- Down + closing
- —
- Monthly P&I
- —
- Monthly cashflow
- —
- DSCR
- —
- Eligible?
- —
Short-term bridge; refi at stabilization.
Rent comps 1 comps
| Address | Beds | Baths | Sqft | Rent | $/sqft | DOM | Units | Dist |
|---|---|---|---|---|---|---|---|---|
| 1802 Cashew Cir Foley, AL | 2.0–5.0 | 2.0–2.5 | 1702 | $2,552 | $1.50 | 45d | 1 | 1.12mi |
Listing history 15 events
-
2026-06-21days on market $355,000 Active 19 DOM
-
2026-06-19days on market $355,000 Active 17 DOM
-
2026-06-18days on market $355,000 Active 16 DOM
-
2026-06-17days on market $355,000 Active 15 DOM
-
2026-06-16days on market $355,000 Active 14 DOM
-
2026-06-15days on market $355,000 Active 13 DOM
-
2026-06-14days on market $355,000 Active 11 DOM
-
2026-06-13days on market $355,000 Active 10 DOM
-
2026-06-10days on market $355,000 Active 8 DOM
-
2026-06-09days on market $355,000 Active 7 DOM
-
2026-06-08days on market $355,000 Active 6 DOM
-
2026-06-07days on market $355,000 Active 5 DOM
-
2026-06-05days on market $355,000 Active 2 DOM
-
2026-06-03remarks 662-char remark
-
2026-06-03$355,000 Active 1 DOM
ⓘ Source: listings_history table (triggers on properties + properties_extension) + one-shot
backfill from property_details.listing_events for pre-trigger history.
Climate risk First Street
- Flood 1/10 Low FEMA zone X (unshaded) · 0% chance over 30 yrs
- Wildfire 3/10 Moderate
- Heat 10/10 Extreme 7 d/yr ≥105°F today · 22 d/yr by 30 yrs out
- Wind 9/10 Extreme 99% chance of damaging wind over 30 yrs
- Air quality 3/10 Moderate 2 unhealthy d/yr today · 4 by 30 yrs out
Nearby sold comps map
Loading sold comps map…
Walkable amenities ~0.75 mi
Loading nearby amenities…
Taxation est. · year 1
- Rental income
- $36,888
- − Mortgage interest
- −$19,886
- − Property taxes
- −$5,325
- − Insurance
- −$1,775
- − Repairs & maintenance
- −$2,951
- − Management
- −$2,951
- − Depreciation
- −$10,327
- Taxable loss
- −$6,327
- Est. tax savings @ 24.0%
- +$1,518
- After-tax cash flow
- $1,220/yr
For passive investors: Depreciation is non-cash, so a rental often shows a tax loss while cash-flowing — sheltering income. Rental losses are passive: they offset passive income freely, and up to $25,000/yr can offset ordinary (W-2) income if you actively participate and your MAGI is under $100k (phasing out to $0 by $150k); unused losses carry forward. On sale, claimed depreciation is recaptured at up to 25%, and gains may owe capital-gains tax (a 1031 exchange can defer both). Figures are a year-1 estimate at your 24.0% rate — not tax advice; consult a CPA.
Condition & rehab AI · 12 photos
This two-unit property requires moderate repairs to the exterior and landscaping, but is otherwise in good condition. Updates to the exterior and interior can significantly increase its value.
Repairs flagged
- Major exterior siding — Significant weathering and discoloration
- Minor landscaping — Sparse grass and some debris
Value-add opportunities
- Both paint exterior — Enhances curb appeal and value
- Both landscaping — Improves curb appeal and rental appeal
- Both update flooring — Modernizes interior and enhances rental appeal
Renovation cost estimate screening
| Repair item | Severity | Est. cost |
|---|---|---|
| exterior siding · Significant weathering and discoloration | Major | $15,000–50,000 |
| landscaping · Sparse grass and some debris | Minor | $500–3,000 |
| Total estimated repair cost · 2 items | $15,500–53,000 |
Value-add ROI direction
- Both paint exterior — Enhances curb appeal and value ↑
- Both landscaping — Improves curb appeal and rental appeal ↑
- Both update flooring — Modernizes interior and enhances rental appeal ↑
ⓘ Cost ranges are severity-bucket heuristics (US national rule-of-thumb). Get contractor quotes + a written scope before underwriting a rehab budget.
Schools (NCES district)
- District
- Baldwin County
- NCES district ID
- 0100270
- Math proficiency
- 33% ▼ -26.00%
- Reading proficiency
- 57% ▲ 1.00%
- Median HH income
- $50,677
- Composite
- 38.61/100
- National rank
- #4157
- State rank
- #18 of 129 in AL
Livability — Foley
- Score
- 61/100
- State rank
- #241
- US rank
- #17616
Category grades
Schools grade is shown separately in the Schools card above.
Census & demographics
- Census place
- Foley, AL
- County
- Baldwin County · 181,514 people
- City population
- 40,628
- Metro
- Daphne-Fairhope-Foley, AL
- Population (ZIP)
- 40,628
- Household income
- $66,714
- Rent vs Own
- Severe rent burden
- 803.0
Population outlook (Baldwin County) Hauer SSP2
- Today (2025)
- 248,264 people
- By 2030
- 270,315 · +8.9%
- By 2040
- 312,967 · +26.1%
- By 2050
- 352,262 · +41.9%
- By 2075
- 438,841 · +76.8%
- By 2100
- 487,736 · +96.5%
Race, ethnicity, and origin ACS 2023
- Neighborhood character
- Predominantly White (78%)
- Race & ethnicity
- White 78% Hispanic / Latino 10% Two or more races 8% Black 5% Asian 2%
- Hispanic origin (detail)
- Mexican 6%
- Common ancestry
- Lithuanian 2% Romanian 2% Slovak 1%
- Foreign-born
- 6% · Canada, China
- Languages at home
- 89% English-only · Spanish 7% Other Indo-European 2% Chinese 1%
Political lean MEDSL · Baldwin
- 2024 margin
- Solid R (+58.2) · D 20.5% · R 78.7%
- 2008→2024 swing
- -6.7pp toward R · 2008: -51.5pp · 2024: -58.2pp
- All cycles
- 2024: R+58.2 2020: R+53.8 2016: R+57.8 2012: R+55.8 2008: R+51.5
Not yet ingested
- Civics
- —
Market trends
- HPI YoY
- ▼ -86.82%
- Current HPI
- 262.2796
- Rent YoY
- ▲ 1.81%
- Metro
- Daphne-Fairhope-Foley, AL
- State GDP YoY
- ▲ 2.94%
- F500 in state
- 4
Industry mix (Fortune 500 HQ in AL)
| Industry | F500 HQs | Revenue |
|---|---|---|
| Financial Services | 1 | $8B |
|
||
| Healthcare | 1 | $5B |
|
||
Price history
+57.8% since first listed8 events — show timeline
- 2026-06-02 Listed $355,000 BCAR
- 2026-05-19 Listed for Rent $1,100 BCAR
- 2026-05-02 Rental Removed $1,100 BCAR
- 2026-05-01 Listed for Rent $1,100 BCAR
- 2025-03-28 Rental Removed $1,450 BCAR
- 2025-03-19 Listed for Rent $1,450 BCAR
- 2021-07-14 Sold (MLS) $212,500 BCAR
- 2021-04-15 Listed $225,000 BCAR
Cash-flow waterfall
monthlySold comps — $/sqft
last 12 mo · ≤1 miLoading sold comps…