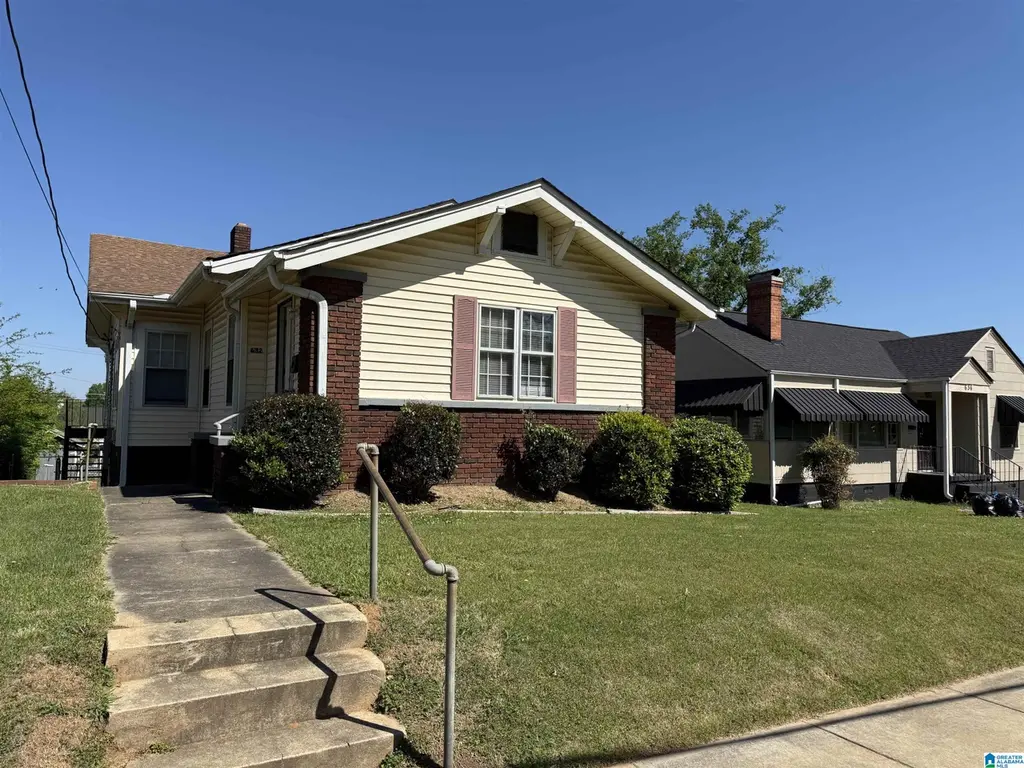
632 Oakland Ave · Fairfield, AL
Flood risk 1/10 · Minimal
- FEMA flood zone
- X (unshaded)
- Chance of flooding over 30 yrs
- 0.0%
- Est. flood insurance / yr
- $473 – $860
Fire risk 1/10 · Minimal
- Est. fire insurance / yr
- $916 – $1,700
Heat risk 6/10 · Moderate
- Hot days now (above 107°F)
- 7 days/yr
- Hot days in 30 yrs
- 19 days/yr
Wind risk 6/10 · Moderate
- Chance of severe wind over 30 yrs
- 27.0%
Air-quality risk 4/10 · Minor
- Unhealthy air days now
- 5 days/yr
- Unhealthy air days in 30 yrs
- 5 days/yr
Risk factors via First Street. Map © Google.
Why this score? — see what drove the B grade
The composite is a weighted blend of 9 inputs, each scored 0–100. Each bar is that input's sub-score; the figure is the points it added to the 100-point composite (weight × sub-score).
- Cash flow +29.8/30.0
- ARV discount +15.0/15.0
- DSCR +10.0/10.0
- 1% rule +8.5/10.0
- Livability +3.2/5.0
- Rent growth +2.5/5.0
- Condition / age +2.5/5.0
- Schools +0.7/10.0
- Appreciation +0.0/10.0
$99,900
🖨 Deal sheet (PDF) 📄 Offer letter ✓ Due diligence
Listing remarks MLS
Check out this charming 3 bedroom 1.5 bath home with lots of character, like a brick fireplace with surrounding built-ins, as well as a large enclosed front porch! Nice hardwood floors with lots of space and room to expand in the basement! With updated paint colors, flooring and lighting, this home is ready for you to make it yours! It will also make a great rental property! It is close to schools (walkable to Fairfield HS and Donald MS), shopping, etc. Home is currently rented, please do not bother tenants.
Key facts
- Brick fireplace
- Hardwood floors
- Built-ins
Tags
Neighborhood map
What this means for you Summary
Snapshot
- This is a 3-bed/1.5-bath single-family listed at $100k.
Deal economics
- At list price, monthly cash flow is $366 ($4k/yr) — positive.
- The deal already cash-flows at list — no discount required.
- Meets the 1% rule at list price ($1k rent vs $100k).
- Recommended offer: $98k (1.5% below list) — sets the bar for market timing.
Location & tenants
- Location reads 64/100 on livability (#160 in AL) — a middle-class / working-renter tenant base. Strengths: commute A+, cost of living A+, housing A+; Watch: crime D+, schools F, amenities F.
- Fairfield City (suburban): math 2% / reading 15% proficiency, ranked #125 of 129 in AL (top 97%) — low school quality limits family demand, transient renter base, plan for 1-2y turnover; 84% free/reduced lunch — lower-income household profile, screen leases tightly.
- Market conditions: 52 active listings in the ZIP; 4 comparable units currently listed for rent nearby; rentals lingering (median 45d on market — plan ~5-8 weeks vacancy on turnover, expect pricing pressure); 50% of comp listings sitting > 30 days — soft ceiling on asking rent; 2,114 units permitted in Jefferson County in 2024 (556 in 5+ unit buildings).
- This rent runs 33% of the median local income ($49k/yr) — at the standard rent-burdened threshold; future hikes will face affordability resistance.
Forward outlook
- Local home prices are declining (-3.0%/yr); year-one equity from $691 of loan paydown is wiped out by about $3k of value loss. Plan a longer hold.
- Jefferson County population projected to shrink 4% by 2050 — rents likely to lag national; underwrite the cash flow, not the appreciation.
- At projected returns (-3.0% appreciation + 3.0% rent growth), your $28k cash investment doubles in ~8 years — after that, you're playing with house money.
Negotiation context
- It's been on market 30 days — a 2% lower offer ($98k) is reasonable based on typical stale-listing flexibility.
- 2 sale attempts with the ask held roughly flat each time — persistent listings suggest the price (not the market) is what's stuck; bring a comps-based counter.
- Current owner paid $70k; 43% above their basis — modest negotiation headroom, anchor on the comps not their cost.
Risks & watch-outs
- Watch-outs: built in 1925 — expect roof / HVAC / electrical / plumbing capex.
- Climate carrying-cost: major wind risk, 27% chance of damaging wind over 30y; extreme-heat days projected 7→19/yr by 2055 (HVAC capex compounding) — expect insurance premiums to compound above CPI over the hold.
Questions for the listing agent
- Built in 1925 — when were the roof, HVAC, electrical panel, plumbing, and water heater last replaced?
- Is there a deadline driving the sale (1031 exchange, divorce, estate, relocation)? That informs how much negotiation room exists.
- Schools are F-rated, which usually means shorter tenancies and higher turnover. Who's the typical renter profile here, and what's been the actual vacancy rate?
- Crime grade is D in this area — have there been break-ins, vandalism, or insurance claims at this property in the last 3 years? What carrier currently insures it and at what premium?
- What's the average days-on-market for RENTAL listings here right now (not sales)? A rising rental-DOM trend means longer vacancies and softer asking-rent achievability than the comps imply.
- What's the recent tenant-quality profile in this submarket — average credit score on applications, eviction rate, late-payment / NSF rate, and stable-employment percentage? A property-management company in the area should have these aggregated.
- How much new for-sale + rental construction is in the pipeline within 1–3 miles? Heavy new supply typically softens prices + rents 12–24 months out; constrained supply supports both.
Investment metrics
- 1% rule
- 1.35% ✓
- Cap rate
- 10.68%
- Cash-on-cash
- 15.69%
- DSCR
- 1.70
- GRM
- 6.2
CMA / ARV
- ARV (on-the-fly)
- $186,507
- Comps found
- 4
Show comp detail 4 sales within ~0.75 mi
| Address | Dist | Beds/Ba | Sqft | Sold | Price | $/sf | Match |
|---|---|---|---|---|---|---|---|
| 2311 Katie St | 0.37mi | 4/2.0 (+1) | 2,500 (-8%) | 3mo | $310,000 | $124 | 61 |
| 1337 44th St | 0.72mi | 3/1.5 | 2,938 (+9%) | 9mo | $100,000 | $34 | 45 |
| 4401 Avenue K | 0.51mi | 3/1.0 | 2,966 (+10%) | 20mo | $83,500 | $28 | 42 |
| 3218 Avenue I | 0.73mi | 4/2.0 (+1) | 2,391 (-12%) | 10mo | $165,000 | $69 | 32 |
Match score weights: distance 35% · size 25% · config 20% · recency 20%. Top-matched comps best support the ARV.
Projected returns pro-forma
-3.0% appreciation · 3.0% rent growth · sell at horizon
- IRR
- 6.5%
- Equity multiple
- 1.25×
- Total profit
- $7,125
- Equity at exit
- $14,895
- IRR
- 15.9%
- Equity multiple
- 2.30×
- Total profit
- $36,297
- Equity at exit
- $8,638
Cash invested: $27,972 (down + closing). Projections, not guarantees.
Landlord ↔ Tenant lean methodology
- Overall (STATE)
- 90 Strongly Landlord-Friendly
- State Alabama
- 90 Strongly Landlord-Friendly · R+15
- County
- — inherits STATE
- City
- — inherits STATE
ZIP-level market 35064
- Home prices YoY
- -28.8%
- Active inventory
- 52
- Price-to-rent
- 6.2×
Monthly cashflow live
- Estimated rent
- $1,349 medium interval (Pro) →
- Mortgage (P&I)
- −$524
- Tax from tax record
- −$134 /mo · $1,614/yr
- Insurance
- −$42
- HOA
- −$0
- Vacancy / Maint / Mgmt
- −$283
- Net cashflow
- $366
Break-even live
Sensitivity live
| Price | -10% $422 | -5% $394 | +0% $366 | +5% $337 | +10% $309 |
|---|---|---|---|---|---|
| Rent | -10% $259 | -5% $312 | +0% $366 | +5% $419 | +10% $472 |
| Rate | -1.0pp $416 | -0.5pp $391 | base $366 | +0.5pp $340 | +1.0pp $313 |
UW: 25.0% down · 7.5% · 30yr · 1.5% tax · 5.0% vac · 8.0% maint · 8.0% mgmt
Financing live
Cash to close
- Down payment
- $24,975
- Closing costs
- $2,997
- Reserves months
- —
- Total cash needed
- —
Loan-product check · same deal, 3 products live
Conventional
25% down · 7.5% · 30yr
- Down + closing
- —
- Monthly P&I
- —
- Monthly cashflow
- —
- DSCR
- —
- Eligible?
- —
Personal DTI + credit; lowest rate.
DSCR
20% down · 8.5% · 30yr
- Down + closing
- —
- Monthly P&I
- —
- Monthly cashflow
- —
- DSCR
- —
- Eligible?
- —
No personal income docs; deal must DSCR.
Hard money
10% down · 12.0% · 12mo
- Down + closing
- —
- Monthly P&I
- —
- Monthly cashflow
- —
- DSCR
- —
- Eligible?
- —
Short-term bridge; refi at stabilization.
Rent comps 4 comps
| Address | Beds | Baths | Sqft | Rent | $/sqft | DOM | Units | Dist |
|---|---|---|---|---|---|---|---|---|
| 521 41st St Fairfield, AL | 4.0 | 2.0 | 1800 | $1,300 | $0.72 | 45d | 1 | 0.31mi |
| 1563 Martin Ave Birmingham, AL | 4.0 | 2.0 | 1848 | $1,495 | $0.81 | 3d | 1 | 0.98mi |
| 1300 Gulfport St Birmingham, AL | 3.0 | 2.0 | 1778 | $1,200 | $0.67 | 45d | 1 | 1.00mi |
| 4105 Avenue Q Unit Q Birmingham, AL | 3.0 | 3.0 | 1760 | $1,250 | $0.71 | 4d | 1 | 1.15mi |
Listing history 20 events
-
2026-06-18days on market $99,900 Active 30 DOM
-
2026-06-17days on market $99,900 Active 29 DOM
-
2026-06-16days on market $99,900 Active 28 DOM
-
2026-06-15days on market $99,900 Active 27 DOM
-
2026-06-13days on market $99,900 Active 25 DOM
-
2026-06-10days on market $99,900 Active 22 DOM
-
2026-06-09days on market $99,900 Active 21 DOM
-
2026-06-08days on market $99,900 Active 20 DOM
-
2026-06-07days on market $99,900 Active 19 DOM
-
2026-06-03days on market $99,900 Active 15 DOM
-
2026-06-02days on market $99,900 Active 14 DOM
-
2026-06-01days on market $99,900 Active 13 DOM
-
2026-05-31days on market $99,900 Active 12 DOM
-
2026-05-19$99,900 Active
Show marketing remark (516 chars)
Check out this charming 3 bedroom 1.5 bath home with lots of character, like a brick fireplace with surrounding built-ins, as well as a large enclosed front porch! Nice hardwood floors with lots of space and room to expand in the basement! With updated paint colors, flooring and lighting, this home is ready for you to make it yours! It will also make a great rental property! It is close to schools (walkable to Fairfield HS and Donald MS), shopping, etc. Home is currently rented, please do not bother tenants.
-
2026-04-09historical $1,050
-
2026-01-28$1,050
-
2022-02-28price $875
-
2019-11-18soldstatus $69,900
-
2018-11-21soldstatus $17,815
-
2002-01-11soldstatus $66,000
ⓘ Source: listings_history table (triggers on properties + properties_extension) + one-shot
backfill from property_details.listing_events for pre-trigger history.
Tax reassessment forecast AL · Resets to sale price
- Current annual tax
- $1,614 · $134/mo
- Projected year-2 tax
- $1,614 · $134/mo
- Expected delta
- $0/yr ($0/mo · 0.0%)
ⓘ Screening estimate from a state-policy table — verify with the county assessor before closing.
Climate risk First Street
- Flood 1/10 Low FEMA zone X (unshaded) · 0% chance over 30 yrs
- Wildfire 1/10 Low
- Heat 6/10 Major 7 d/yr ≥107°F today · 19 d/yr by 30 yrs out
- Wind 6/10 Major 27% chance of damaging wind over 30 yrs
- Air quality 4/10 Moderate 5 unhealthy d/yr today · 5 by 30 yrs out
Nearby sold comps map
Loading sold comps map…
Walkable amenities ~0.75 mi
Loading nearby amenities…
Taxation est. · year 1
- Rental income
- $16,187
- − Mortgage interest
- −$5,596
- − Property taxes
- −$1,614
- − Insurance
- −$500
- − Repairs & maintenance
- −$1,295
- − Management
- −$1,295
- − Depreciation
- −$2,906
- Taxable income
- $2,981
- Est. tax owed @ 24.0%
- −$716
- After-tax cash flow
- $3,672/yr
For passive investors: Depreciation is non-cash, so a rental often shows a tax loss while cash-flowing — sheltering income. Rental losses are passive: they offset passive income freely, and up to $25,000/yr can offset ordinary (W-2) income if you actively participate and your MAGI is under $100k (phasing out to $0 by $150k); unused losses carry forward. On sale, claimed depreciation is recaptured at up to 25%, and gains may owe capital-gains tax (a 1031 exchange can defer both). Figures are a year-1 estimate at your 24.0% rate — not tax advice; consult a CPA.
Schools (NCES district)
- District
- Fairfield City
- NCES district ID
- 0101440
- Math proficiency
- 2% ▼ -18.00%
- Reading proficiency
- 15% ▼ -4.00%
- Median HH income
- $35,288
- Composite
- 6.92/100
- National rank
- #9974
- State rank
- #125 of 129 in AL
Livability — Fairfield
- Score
- 64/100
- State rank
- #160
- US rank
- #14390
Category grades
Schools grade is shown separately in the Schools card above.
Census & demographics
- Census place
- Fairfield, AL
- County
- Jefferson County · 527,445 people
- City population
- 9,872
- Metro
- Birmingham-Hoover, AL
- Population (ZIP)
- 9,872
- Household income
- $48,692
- Rent vs Own
- Severe rent burden
- 784.0
Population outlook (Jefferson County) Hauer SSP2
- Today (2025)
- 669,185 people
- By 2030
- 669,694 · +0.1%
- By 2040
- 661,388 · -1.2%
- By 2050
- 643,086 · -3.9%
- By 2075
- 577,267 · -13.7%
- By 2100
- 474,758 · -29.1%
Race, ethnicity, and origin ACS 2023
- Neighborhood character
- Predominantly Black (91%)
- Race & ethnicity
- Black 91% White 7% Two or more races 2%
- Foreign-born
- 1% · Canada
- Languages at home
- 99% English-only · Spanish 1%
Political lean MEDSL · Jefferson
- 2024 margin
- D (+10.4) · D 54.6% · R 44.2% · Other 1.2%
- 2008→2024 swing
- +5.4pp toward D · 2008: 5.1pp · 2024: 10.4pp
- All cycles
- 2024: D+10.4 2020: D+13.2 2016: D+7.2 2012: D+6.0 2008: D+5.1
Not yet ingested
- Civics
- —
Market trends
- HPI YoY
- ▼ -50.47%
- Current HPI
- 124.7012
- Rent YoY
- —
- Metro
- Birmingham-Hoover, AL
- State GDP YoY
- ▲ 2.94%
- F500 in state
- 4
Industry mix (Fortune 500 HQ in AL)
| Industry | F500 HQs | Revenue |
|---|---|---|
| Financial Services | 1 | $8B |
|
||
| Healthcare | 1 | $5B |
|
||
Price history
+51.4% since first listed7 events — show timeline
- 2026-05-19 Listed $99,900 Greater Alabama MLS
- 2026-04-09 Rental Removed $1,050 APPFOLIO
- 2026-01-28 Listed for Rent $1,050 APPFOLIO
- 2022-02-28 Price Changed $875 RENT.
- 2019-11-18 Sold (Public Records) $69,900 Public Records
- 2018-11-21 Sold (Public Records) $17,815 Public Records
- 2002-01-11 Sold (Public Records) $66,000 Public Records
Property tax history
+9.7%/yrLatest (2025): $1,614 · +0.0% YoY. Source: county tax records.
Cash-flow waterfall
monthlySold comps — $/sqft
last 12 mo · ≤1 miLoading sold comps…