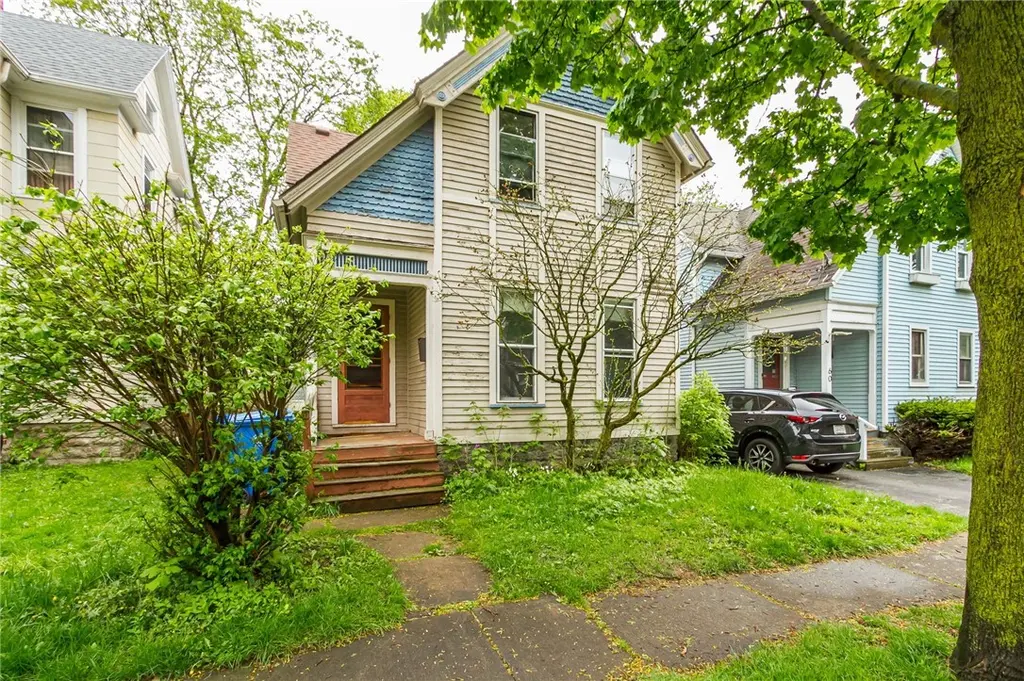
56 Nicholson St · Rochester, NY
Flood risk 1/10 · Minimal
- FEMA flood zone
- X (unshaded)
- Chance of flooding over 30 yrs
- 0.0%
- Est. flood insurance / yr
- $473 – $860
Fire risk 1/10 · Minimal
- Est. fire insurance / yr
- $691 – $1,283
Heat risk 2/10 · Minimal
- Hot days now (above 96°F)
- 7 days/yr
- Hot days in 30 yrs
- 15 days/yr
Wind risk 1/10 · Minimal
- Chance of severe wind over 30 yrs
- —
Air-quality risk 2/10 · Minimal
- Unhealthy air days now
- 1 days/yr
- Unhealthy air days in 30 yrs
- 1 days/yr
Risk factors via First Street. Map © Google.
Why this score? — see what drove the B- grade
The composite is a weighted blend of 9 inputs, each scored 0–100. Each bar is that input's sub-score; the figure is the points it added to the 100-point composite (weight × sub-score).
- Cash flow +30.0/30.0
- 1% rule +10.0/10.0
- DSCR +10.0/10.0
- ARV discount +7.5/15.0
- Livability +3.8/5.0
- Rent growth +2.8/5.0
- Condition / age +2.5/5.0
- Schools +1.9/10.0
- Appreciation +0.0/10.0
$99,900
🖨 Deal sheet 📄 Offer letter ✓ Due diligence
Listing remarks
LOOKING FOR A PROJECT?! Opportunity is knocking in the heart of the South Wedge! This home is packed with potential and perfectly positioned in one of Rochester’s most desirable and walkable neighborhoods - close to Highland Park, Highland & Strong Hospital, and some of the city’s best dining and nightlife. Inside, you’ll find a spacious and functional floor plan featuring 4 bedrooms, a large bathroom, and expansive living spaces looking for your personal touch. A generously sized first-floor bedroom offers flexibility, while upstairs you’ll find the additional 3 large bedrooms. Original hardwood floors and trim run throughout the home—just waiting to be
Key facts
- 3,526 sq ft lot
- Parking
- Built 1890
Property features AI
Finance
- Other: Rectangular residential lot (approx. 32 x 107 feet)
Exterior
- Parking: No garage; Driveway
- Utilities: Electricity connected; Public water connected; Sewer connected
- Home design: Two-story house; Resale property
- Construction: Wood siding; Spray foam insulation; Architectural shingle roof; Stone foundation; Existing construction
- Exterior features: Fully fenced yard; See remarks
Interior
- Kitchen: Eat-in kitchen; Walk-in pantry
- Bedrooms: One bedroom on the main level
- Flooring: Hardwood; Varies
- Bathrooms: One full bathroom
- Heating & cooling: Gas forced-air heating
- Interior features: Separate/formal dining room; Eat-in kitchen; Walk-in pantry; Natural woodwork; Has basement (full)
- Laundry & utility: Laundry in basement; Gas water heater
Neighborhood map
What this means for you Summary
Snapshot
- This is a 4-bed/1.0-bath single-family listed at $100k.
Deal economics
- At list price, monthly cash flow is $910 ($11k/yr) — positive.
- The deal already cash-flows at list — no discount required.
- Meets the 1% rule at list price ($2k rent vs $100k).
- Cap rate 17.2% vs local median 9.3% in Rochester — top-decile yield for the area; either an underpriced asset or a hidden risk that comps aren't pricing in. Stress-test before assuming the spread holds.
Location & tenants
- Location reads 76/100 on livability (#222 in NY, #3,482 nationally) — a middle-class / working-renter tenant base. Strengths: commute A+, cost of living A+, housing A+; Watch: schools D+, crime F, employment F.
- Rochester City School District (urban): math 21% / reading 26% proficiency, ranked #589 of 590 in NY (top 100%) — low school quality limits family demand, transient renter base, plan for 1-2y turnover; 82% free/reduced lunch — lower-income household profile, screen leases tightly.
- Market conditions: Rents rising (+1.2%/yr); 74 active listings in the ZIP; 23 comparable units currently listed for rent nearby; rentals at typical pace (median 19d on market — plan ~3-4 weeks tenant-placement turnaround); 1,169 units permitted in Monroe County in 2024 (591 in 5+ unit buildings).
- This rent runs 39% of the median local income ($62k/yr) — at the standard rent-burdened threshold; future hikes will face affordability resistance.
Forward outlook
- Local home prices are declining (-3.0%/yr); year-one equity from $691 of loan paydown is wiped out by about $3k of value loss. Plan a longer hold.
- Monroe County population projected to shrink 6% by 2050 — rents likely to lag national; underwrite the cash flow, not the appreciation.
- At projected returns (-3.0% appreciation + 1.2% rent growth), your $28k cash investment doubles in ~4 years — after that, you're playing with house money.
Negotiation context
- Only 7 days on market — expect competitive offers; lowballing is unlikely to land.
Risks & watch-outs
- Watch-outs: built in 1890 — expect roof / HVAC / electrical / plumbing capex.
Questions for the listing agent
- Built in 1890 — when were the roof, HVAC, electrical panel, plumbing, and water heater last replaced?
- Is there a deadline driving the sale (1031 exchange, divorce, estate, relocation)? That informs how much negotiation room exists.
- Schools are D-rated, which usually means shorter tenancies and higher turnover. Who's the typical renter profile here, and what's been the actual vacancy rate?
- Crime grade is F in this area — have there been break-ins, vandalism, or insurance claims at this property in the last 3 years? What carrier currently insures it and at what premium?
- What's the average days-on-market for RENTAL listings here right now (not sales)? A rising rental-DOM trend means longer vacancies and softer asking-rent achievability than the comps imply.
- What's the recent tenant-quality profile in this submarket — average credit score on applications, eviction rate, late-payment / NSF rate, and stable-employment percentage? A property-management company in the area should have these aggregated.
- How much new for-sale + rental construction is in the pipeline within 1–3 miles? Heavy new supply typically softens prices + rents 12–24 months out; constrained supply supports both.
Investment metrics
- 1% rule
- 2.02% ✓
- Cap rate
- 17.22%
- Cash-on-cash
- 39.04%
- DSCR
- 2.74
- GRM
- 4.1
CMA / ARV
- ARV (median comp)
- $247,634
- List price
- $99,900
- Delta
- -59.66%
- Verdict
- UNDERPRICED
- Comps
- 20 within 1.0 mi
Show comp detail 12 sales within ~0.75 mi
| Address | Dist | Beds/Ba | Sqft | Sold | Price | $/sf | Match |
|---|---|---|---|---|---|---|---|
| 185 Caroline St | 0.15mi | 3/1.0 (-1) | 1,334 (-4%) | 1mo | $242,005 | $181 | 81 |
| 24 Goebel Pl | 0.15mi | 3/2.0 (-1) | 1,430 (+3%) | 3mo | $248,000 | $173 | 76 |
| 262 Linden St | 0.27mi | 4/1.0 | 1,532 (+10%) | 5mo | $175,000 | $114 | 65 |
| 755 Goodman St S | 0.32mi | 3/1.0 (-1) | 1,220 (-12%) | 1mo | $153,500 | $126 | 59 |
| 61 Allmeroth St | 0.48mi | 3/1.0 (-1) | 1,289 (-7%) | 3mo | $244,000 | $189 | 59 |
| 38 Hamilton St | 0.44mi | 3/1.0 (-1) | 1,290 (-7%) | 6mo | $210,000 | $163 | 58 |
| 521 Benton St | 0.65mi | 3/1.0 (-1) | 1,440 (+4%) | 1mo | $250,000 | $174 | 57 |
| 461 Benton St | 0.57mi | 4/1.5 | 1,500 (+8%) | 1mo | $270,000 | $180 | 57 |
| 24 Bloomfield Pl | 0.41mi | 3/2.0 (-1) | 1,241 (-10%) | 1mo | $215,000 | $173 | 54 |
| 383 Benton St | 0.48mi | 3/1.5 (-1) | 1,257 (-9%) | 5mo | $255,000 | $203 | 51 |
| 890 South Goodman St | 0.41mi | 4/2.0 | 1,586 (+14%) | 4mo | $215,000 | $136 | 50 |
| 56 Alpine St | 0.59mi | 3/1.5 (-1) | 1,232 (-11%) | 6mo | $375,000 | $304 | 42 |
Match score weights: distance 35% · size 25% · config 20% · recency 20%. Top-matched comps best support the ARV.
Projected returns pro-forma
-3.0% appreciation · 1.2% rent growth · sell at horizon
- IRR
- 33.2%
- Equity multiple
- 2.37×
- Total profit
- $38,201
- Equity at exit
- $14,895
- IRR
- 39.2%
- Equity multiple
- 4.35×
- Total profit
- $93,782
- Equity at exit
- $8,638
Cash invested: $27,972 (down + closing). Projections, not guarantees.
Landlord ↔ Tenant lean methodology
- Overall (STATE)
- 15 Strongly Tenant-Friendly
- State New York
- 15 Strongly Tenant-Friendly · D+10
- County
- — inherits STATE
- City
- — inherits STATE
ZIP-level market 14620
- Home prices YoY
- -20.1%
- Rents YoY
- 1.2%
- Active inventory
- 74
- Price-to-rent
- 4.1×
Monthly cashflow live
- Estimated rent
- $2,019 high interval (Pro) →
- Mortgage (P&I)
- −$524
- Tax from tax record
- −$120 /mo · $1,439/yr
- Insurance
- −$42
- HOA
- −$0
- Vacancy / Maint / Mgmt
- −$424
- Net cashflow
- $910
Break-even live
UW: 25.0% down · 7.5% · 30yr · 1.5% tax · 5.0% vac · 8.0% maint · 8.0% mgmt
Financing live
Cash to close
- Down payment
- $24,975
- Closing costs
- $2,997
- Reserves months
- —
- Total cash needed
- —
Loan-product check · same deal, 3 products live
Conventional
25% down · 7.5% · 30yr
- Down + closing
- —
- Monthly P&I
- —
- Monthly cashflow
- —
- DSCR
- —
- Eligible?
- —
Personal DTI + credit; lowest rate.
DSCR
20% down · 8.5% · 30yr
- Down + closing
- —
- Monthly P&I
- —
- Monthly cashflow
- —
- DSCR
- —
- Eligible?
- —
No personal income docs; deal must DSCR.
Hard money
10% down · 12.0% · 12mo
- Down + closing
- —
- Monthly P&I
- —
- Monthly cashflow
- —
- DSCR
- —
- Eligible?
- —
Short-term bridge; refi at stabilization.
Rent comps 23 comps
| Address | Beds | Baths | Sqft | Rent | $/sqft | DOM | Units | Dist |
|---|---|---|---|---|---|---|---|---|
| 416 Gregory St Unit Down Rochester, NY | 3.0 | 1.0 | 1374 | $1,995 | $1.45 | 23d | 1 | 0.17mi |
| 256 Gregory St Rochester, NY | 3.0 | 1.0 | 1150 | $1,700 | $1.48 | 43d | 1 | 0.19mi |
| 355 Caroline St Rochester, NY | 3.0 | 1.0 | 1143 | $1,650 | $1.44 | 21d | 1 | 0.30mi |
| 271 Pearl St Unit 273 Rochester, NY | 3.0 | 1.0 | 1200 | $1,795 | $1.50 | 3d | 1 | 0.34mi |
| 507 Meigs St Rochester, NY | 3.0 | 1.0 | 1577 | $1,650 | $1.05 | 43d | 1 | 0.36mi |
| 106 Gregory St Rochester, NY | 3.0 | 1.5 | 1680 | $1,995 | $1.19 | 23d | 1 | 0.39mi |
| 261 Henrietta St Rochester, NY | 3.0 | 1.0 | 1200 | $1,600 | $1.33 | 10d | 1 | 0.68mi |
| 948 Monroe Ave Rochester, NY | 3.0 | 1.0 | 1200 | $1,850 | $1.54 | 10d | 1 | 0.93mi |
| 948 Monroe Ave Rochester, NY | 3.0 | 1.0 | 1200 | $1,850 | $1.54 | 2d | 1 | 0.93mi |
| 188 Laney Rd Rochester, NY | 3.0 | 1.5 | 1604 | $2,350 | $1.47 | 2d | 1 | 1.03mi |
| 1600 Elmwood Ave Rochester, NY | 3.0 | 1.0–2.0 | 824 | $2,089 | $2.54 | 18d | 1 | 1.10mi |
| 260 E Main St Rochester, NY | 3.0 | 1.0–2.0 | 1144 | $2,999 | $2.62 | 3d | 14 | 1.17mi |
| 95 Elmwood Ter Rochester, NY | 1.0–3.0 | 1.0–1.5 | 1107 | $2,255 | $2.04 | 2d | 19 | 1.20mi |
| 59 Gold St Rochester, NY | 3.0 | 1.5 | 1264 | $2,000 | $1.58 | 43d | 1 | 1.23mi |
| 193 Reynolds St Rochester, NY | 3.0 | 1.5 | 1342 | $1,800 | $1.34 | 21d | 1 | 1.26mi |
| 249 1/2 Columbia Ave #249 Rochester, NY | 3.0 | 1.0 | 1600 | $1,300 | $0.81 | 14d | 1 | 1.28mi |
| 839 Elmwood Ave Rochester, NY | 3.0 | 1.0 | 1500 | $2,600 | $1.73 | 23d | 1 | 1.34mi |
| 733 University Ave #3 Rochester, NY | 3.0 | 1.5 | 1400 | $1,850 | $1.32 | 43d | 1 | 1.36mi |
| 36 Morningside Park Rochester, NY | 4.0 | 1.0 | 1446 | $2,400 | $1.66 | 3d | 1 | 1.36mi |
| 478 Tremont St Rochester, NY | 3.0 | 2.0 | 1424 | $1,500 | $1.05 | 43d | 1 | 1.42mi |
| 214 Culver Rd Apt 2 Rochester, NY | 3.0 | 1.0 | 1700 | $2,400 | $1.41 | 14d | 1 | 1.47mi |
| 192 Bartlett St Unit 192 Rochester, NY | 3.0 | 1.0 | 1099 | $1,295 | $1.18 | 14d | 1 | 1.49mi |
| 367 Hawley St Rochester, NY | 4.0 | 1.5 | 1210 | $1,395 | $1.15 | 43d | 1 | 1.49mi |
Listing history 2 events
-
2026-05-15status Pending 1240-char remark
-
2026-05-07$99,900 Active 1240-char remark
ⓘ Source: listings_history table (triggers on properties + properties_extension) + one-shot
backfill from property_details.listing_events for pre-trigger history.
Tax reassessment forecast NY · Partial reset (capped growth)
- Current annual tax
- $1,439 · $120/mo
- Projected year-2 tax
- $1,563 · $130/mo
- Expected delta
- +$125/yr (+$10/mo · 8.7%)
ⓘ Screening estimate from a state-policy table — verify with the county assessor before closing.
Climate risk First Street
- Flood 1/10 Low FEMA zone X (unshaded) · 0% chance over 30 yrs
- Wildfire 1/10 Low
- Heat 2/10 Low 7 d/yr ≥96°F today · 15 d/yr by 30 yrs out
- Wind 1/10 Low
- Air quality 2/10 Low 1 unhealthy d/yr today · 1 by 30 yrs out
Nearby sold comps map
Loading sold comps map…
Walkable amenities ~0.75 mi
Loading nearby amenities…
Taxation est. · year 1
- Rental income
- $24,233
- − Mortgage interest
- −$5,596
- − Property taxes
- −$1,439
- − Insurance
- −$500
- − Repairs & maintenance
- −$1,939
- − Management
- −$1,939
- − Depreciation
- −$2,906
- Taxable income
- $9,915
- Est. tax owed @ 24.0%
- −$2,380
- After-tax cash flow
- $8,540/yr
For passive investors: Depreciation is non-cash, so a rental often shows a tax loss while cash-flowing — sheltering income. Rental losses are passive: they offset passive income freely, and up to $25,000/yr can offset ordinary (W-2) income if you actively participate and your MAGI is under $100k (phasing out to $0 by $150k); unused losses carry forward. On sale, claimed depreciation is recaptured at up to 25%, and gains may owe capital-gains tax (a 1031 exchange can defer both). Figures are a year-1 estimate at your 24.0% rate — not tax advice; consult a CPA.
Schools (NCES district)
- District
- Rochester City School District
- NCES district ID
- 3624750
- Math proficiency
- 21% ▬ 0.00%
- Reading proficiency
- 26% ▲ 4.00%
- Median HH income
- $30,923
- Composite
- 18.98/100
- National rank
- #8850
- State rank
- #589 of 590 in NY
Livability — Rochester
- Score
- 76/100
- State rank
- #222
- US rank
- #3482
Category grades
Schools grade is shown separately in the Schools card above.
Census & demographics
- Census place
- Rochester, NY
- County
- Monroe County · 674,131 people
- City population
- 432,803
- Metro
- Rochester, NY
- Population (ZIP)
- 23,769
- Household income
- $61,783
- Rent vs Own
- Severe rent burden
- 2013.0
Population outlook (Monroe County) Hauer SSP2
- Today (2025)
- 759,460 people
- By 2030
- 757,154 · -0.3%
- By 2040
- 740,644 · -2.5%
- By 2050
- 714,443 · -5.9%
- By 2075
- 645,883 · -15.0%
- By 2100
- 547,084 · -28.0%
Race, ethnicity, and origin ACS 2023
- Neighborhood character
- Predominantly White (68%)
- Race & ethnicity
- White 68% Black 12% Asian 9% Hispanic / Latino 6% Two or more races 6%
- Hispanic origin (detail)
- Puerto Rican 3%
- Common ancestry
- Romanian 5% Iranian 3% Lithuanian 2%
- Foreign-born
- 13% · China, Canada, South Korea
- Languages at home
- 85% English-only · Chinese 4% Spanish 4% Other Indo-European 3%
Political lean MEDSL · Monroe
- 2024 margin
- D (+19.1) · D 59.5% · R 40.5%
- 2008→2024 swing
- +1.4pp toward D · 2008: 17.7pp · 2024: 19.1pp
- All cycles
- 2024: D+19.1 2020: D+21.0 2016: D+14.1 2012: D+17.4 2008: D+17.7
Not yet ingested
- Civics
- —
Market trends
- HPI YoY
- ▼ -84.77%
- Current HPI
- 337.6917
- Rent YoY
- ▲ 1.20%
- Metro
- Rochester, NY
- State GDP YoY
- ▲ 2.60%
- F500 in state
- 92
Industry mix (Fortune 500 HQ in NY)
| Industry | F500 HQs | Revenue |
|---|---|---|
| Financial Services | 10 | $950B |
|
||
| Consumer Goods | 9 | $162B |
|
||
| Insurance | 4 | $225B |
|
||
| Telecommunications | 2 | $144B |
|
||
| Pharmaceuticals | 2 | $112B |
|
||
| Media / Entertainment | 2 | $69B |
|
||
Price history
2 events — show timeline
- 2026-05-15 Pending — UNYREIS
- 2026-05-07 Listed $99,900 UNYREIS
Property tax history
+5.3%/yrLatest (2025): $1,439 · +7.9% YoY. Source: county tax records.
Cash-flow waterfall
monthlySold comps — $/sqft
last 12 mo · ≤1 miLoading sold comps…