 12-Plex
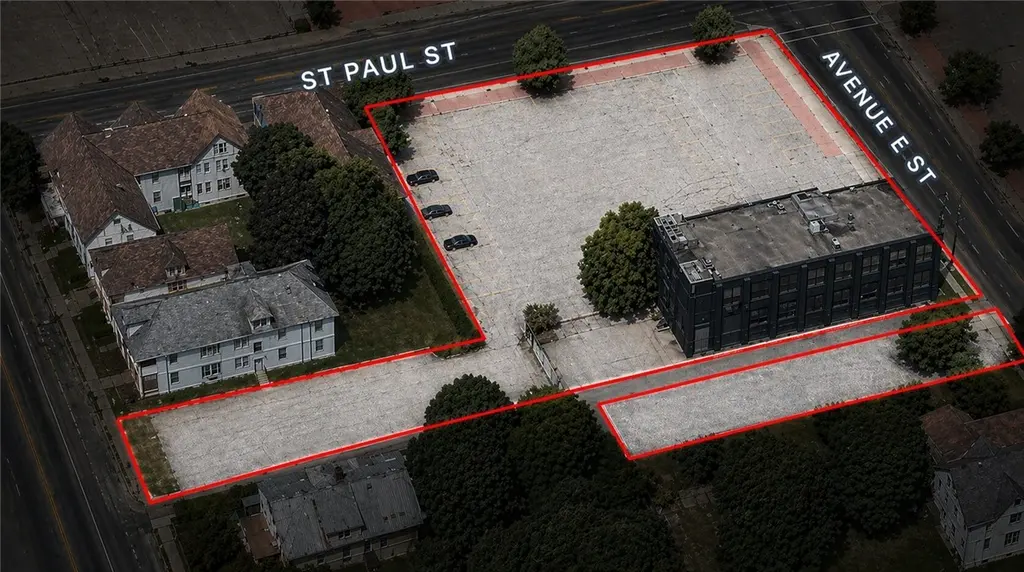
1350 St Paul St · Rochester, NY
Flood risk No data
- FEMA flood zone
- —
- Chance of flooding over 30 yrs
- —
- Est. flood insurance / yr
- —
Fire risk No data
- Est. fire insurance / yr
- —
Heat risk No data
- Hot days now (above threshold)
- —
- Hot days in 30 yrs
- —
Wind risk No data
- Chance of severe wind over 30 yrs
- —
Air-quality risk No data
- Unhealthy air days now
- —
- Unhealthy air days in 30 yrs
- —
Risk factors via First Street. Map © Google.
Why this score? — see what drove the D grade
The composite is a weighted blend of 9 inputs, each scored 0–100. Each bar is that input's sub-score; the figure is the points it added to the 100-point composite (weight × sub-score).
- Cash flow +15.0/30.0
- ARV discount +7.5/15.0
- 1% rule +5.0/10.0
- DSCR +5.0/10.0
- Rent growth +4.7/5.0
- Livability +3.8/5.0
- Schools +1.9/10.0
- Condition / age +1.0/5.0
- Appreciation +0.0/10.0
$224,900
🖨 Deal sheet 📄 Offer letter ✓ Due diligence
Multi-family units
County records classify this as Multi-Family (5+ Unit). Listing-text estimate: 12 units. confirmed
5+ unit building — per-unit beds/baths from public records are typically unavailable; the breakdown below (if shown) is an estimate from the listing text.
Listing remarks
FLEX WAREHOUSE / COMMERCIAL BUILDING & OVER 1 ACRE SURFACE LOT – EASY SELLER FINANCING - M1 INDUSTRIAL ZONING – NEARLY ALL USES PERMITTED – APPROVED FOR 12 UNIT APARTMENT BUILDING - CONTRACTORS / PROP MGMT / WAREHOUSE / SELF STORAGE / OUTDOOR STORAGE YARD / MFG / INDUSTRIAL / AUTO / ARTIST LOFTS / APTS / MIXED USE / CHURCH SPACE / LIVE WORK – CLEAN SLATE – STRUCTURALLY SOUND – BRAND NEW ELECTRICAL SERVICE INSTALLED – ROOF SERVICED & TEAR OFF ROOF ON FIRE STAIRCASES - BRING YOUR OFFERS & YOUR FINISHES –ALSO LISTED UNDER MLS: R1678549
Key facts
- M1 industrial zoning
- Roof serviced
- 7,841 sq ft lot
Tags
Property features AI
Finance
- Financial info: Operated as a multi-unit property with 12 total units; 13 separate electric meters; 1 separate gas meter; Operating expense details: see remarks; Owner pays: other (see remarks); Rent includes: see remarks
Exterior
- Parking: Driveway parking; Three or more parking spaces; No garage
- Utilities: Electricity available (circuit breakers); Public water connected; Sewer connected
- Home design: Three-story building; Existing structure; Flat roof
- Construction: Brick construction; Copper and PEX plumbing
- Exterior features: Blacktop driveway; Near public transit; Irregular lot shape; Lot dimensions approximately 52 x 170 ft
Interior
- Heating & cooling: Electric heating available; Gas heating available; Heating details: see remarks
- Interior features: Full basement
Neighborhood map
What this means for you Summary
Snapshot
- This is a 12 × 1-bed/1-bath units multifamily listed at $225k. Condition is rated poor.
Deal economics
- At list price, monthly cash flow is $10k ($118k/yr) — positive. Per door: $816/mo.
- The deal already cash-flows at list — no discount required.
- Meets the 1% rule at list price ($14k rent vs $225k).
- Recommended offer: $222k (1.5% below list) — sets the bar for market timing.
- Cap rate 58.6% vs local median 9.3% in Rochester — top-decile yield for the area; either an underpriced asset or a hidden risk that comps aren't pricing in. Stress-test before assuming the spread holds.
Location & tenants
- Location reads 76/100 on livability (#222 in NY, #3,482 nationally) — a middle-class / working-renter tenant base. Strengths: commute A+, cost of living A+, housing A+; Watch: schools D+, crime F, employment F.
- Rochester City School District (urban): math 21% / reading 26% proficiency, ranked #589 of 590 in NY (top 100%) — low school quality limits family demand, transient renter base, plan for 1-2y turnover; 82% free/reduced lunch — lower-income household profile, screen leases tightly.
- Market conditions: Rents rising fast (+8.9%/yr); 114 active listings in the ZIP; lower-income renter base — watch delinquency; 1,169 units permitted in Monroe County in 2024 (591 in 5+ unit buildings).
- At $14,368/mo this rent would consume 487% of the median local household income ($35k/yr) (locally 2756% of renters already pay >50% of income on rent) — very limited rent-growth headroom before tenants either downsize or default.
Forward outlook
- Local home prices are declining (-3.0%/yr); year-one equity from $2k of loan paydown is wiped out by about $7k of value loss. Plan a longer hold.
- Monroe County population projected to shrink 6% by 2050 — rents likely to lag national; underwrite the cash flow, not the appreciation.
- At projected returns (-3.0% appreciation + 8.0% rent growth), your $63k cash investment doubles in ~1 year — after that, you're playing with house money.
Negotiation context
- It's been on market 22 days — a 2% lower offer ($222k) is reasonable based on typical stale-listing flexibility.
- 2 sale attempts with the ask held roughly flat each time — persistent listings suggest the price (not the market) is what's stuck; bring a comps-based counter.
Risks & watch-outs
- Watch-outs: built in 1930 — expect roof / HVAC / electrical / plumbing capex.
Questions for the listing agent
- Can we see the unit-by-unit rent roll, current vacancy, and any below-market leases? What's the average tenancy length?
- What capital expenditures (roof, boiler, parking lot, exteriors) have been made in the last 5 years, and what's planned in the next 2?
- Have any recent inspections been done? Can we get a copy of the seller's disclosures and any deferred-maintenance estimates?
- Built in 1930 — when were the roof, HVAC, electrical panel, plumbing, and water heater last replaced?
- Is there a deadline driving the sale (1031 exchange, divorce, estate, relocation)? That informs how much negotiation room exists.
- Schools are D-rated, which usually means shorter tenancies and higher turnover. Who's the typical renter profile here, and what's been the actual vacancy rate?
- Crime grade is F in this area — have there been break-ins, vandalism, or insurance claims at this property in the last 3 years? What carrier currently insures it and at what premium?
- The area grade is low — what's the realistic commute time and amenity access for the typical tenant pool here? Any planned neighborhood developments (good or bad) we should know about?
- What's the average days-on-market for RENTAL listings here right now (not sales)? A rising rental-DOM trend means longer vacancies and softer asking-rent achievability than the comps imply.
- What's the recent tenant-quality profile in this submarket — average credit score on applications, eviction rate, late-payment / NSF rate, and stable-employment percentage? A property-management company in the area should have these aggregated.
- How much new apartment / multifamily construction is in the pipeline within 1–3 miles? Heavy new supply (>2% of stock underway) typically softens rents 12–24 months out; light construction supports rent growth.
Investment metrics
- 1% rule
- 6.39% ✓
- Cap rate
- 58.56%
- Cash-on-cash
- 186.68%
- DSCR
- 9.31
- GRM
- 1.3
CMA / ARV
- ARV (median comp)
- $1,462,152
- List price
- $224,900
- Delta
- -84.62%
- Verdict
- UNDERPRICED
- Comps
- 6 within 1.0 mi
Projected returns pro-forma
-3.0% appreciation · 8.0% rent growth · sell at horizon
- IRR
- —
- Equity multiple
- 11.54×
- Total profit
- $663,648
- Equity at exit
- $33,533
- IRR
- —
- Equity multiple
- 28.44×
- Total profit
- $1,727,797
- Equity at exit
- $19,445
Cash invested: $62,972 (down + closing). Projections, not guarantees.
Landlord ↔ Tenant lean methodology
- Overall (STATE)
- 15 Strongly Tenant-Friendly
- State New York
- 15 Strongly Tenant-Friendly · D+10
- County
- — inherits STATE
- City
- — inherits STATE
ZIP-level market 14621
- Home prices YoY
- -4.0%
- Rents YoY
- 8.9%
- Active inventory
- 114
- Price-to-rent
- 15.7×
Monthly cashflow live
- Estimated rent
- $14,368 high interval (Pro) →
- Mortgage (P&I)
- −$1,179
- Tax est. 1.5%
- −$281 /mo · $3,374/yr
- Insurance
- −$94
- HOA
- −$0
- Vacancy / Maint / Mgmt
- −$3,017
- Net cashflow
- $9,796
Break-even live
12-unit breakdown (identical units grouped — click to expand)
| Units | Beds | Baths | Est. rent |
|---|---|---|---|
| 12× units | 1 | 1 | $14,364 |
| #1 | 1 | 1 | $1,197 |
| #2 | 1 | 1 | $1,197 |
| #3 | 1 | 1 | $1,197 |
| #4 | 1 | 1 | $1,197 |
| #5 | 1 | 1 | $1,197 |
| #6 | 1 | 1 | $1,197 |
| #7 | 1 | 1 | $1,197 |
| #8 | 1 | 1 | $1,197 |
| #9 | 1 | 1 | $1,197 |
| #10 | 1 | 1 | $1,197 |
| #11 | 1 | 1 | $1,197 |
| #12 | 1 | 1 | $1,197 |
| Total (12 units) | $14,368 | ||
UW: 25.0% down · 7.5% · 30yr · 1.5% tax · 5.0% vac · 8.0% maint · 8.0% mgmt
Financing live
Cash to close
- Down payment
- $56,225
- Closing costs
- $6,747
- Reserves months
- —
- Total cash needed
- —
Loan-product check · same deal, 3 products live
Conventional
25% down · 7.5% · 30yr
- Down + closing
- —
- Monthly P&I
- —
- Monthly cashflow
- —
- DSCR
- —
- Eligible?
- —
Personal DTI + credit; lowest rate.
DSCR
20% down · 8.5% · 30yr
- Down + closing
- —
- Monthly P&I
- —
- Monthly cashflow
- —
- DSCR
- —
- Eligible?
- —
No personal income docs; deal must DSCR.
Hard money
10% down · 12.0% · 12mo
- Down + closing
- —
- Monthly P&I
- —
- Monthly cashflow
- —
- DSCR
- —
- Eligible?
- —
Short-term bridge; refi at stabilization.
Listing history 3 events
-
2026-05-12historical
-
2026-05-05$224,900 Active
-
2026-05-05$224,900 Active 606-char remark
ⓘ Source: listings_history table (triggers on properties + properties_extension) + one-shot
backfill from property_details.listing_events for pre-trigger history.
Nearby sold comps map
Loading sold comps map…
Walkable amenities ~0.75 mi
Loading nearby amenities…
Taxation est. · year 1
- Rental income
- $172,416
- − Mortgage interest
- −$12,598
- − Property taxes
- −$3,374
- − Insurance
- −$1,124
- − Repairs & maintenance
- −$13,793
- − Management
- −$13,793
- − Depreciation
- −$6,543
- Taxable income
- $121,191
- Est. tax owed @ 24.0%
- −$29,086
- After-tax cash flow
- $88,472/yr
For passive investors: Depreciation is non-cash, so a rental often shows a tax loss while cash-flowing — sheltering income. Rental losses are passive: they offset passive income freely, and up to $25,000/yr can offset ordinary (W-2) income if you actively participate and your MAGI is under $100k (phasing out to $0 by $150k); unused losses carry forward. On sale, claimed depreciation is recaptured at up to 25%, and gains may owe capital-gains tax (a 1031 exchange can defer both). Figures are a year-1 estimate at your 24.0% rate — not tax advice; consult a CPA.
Condition & rehab AI · 1 photo
This property is a large, vacant commercial building with extensive structural and interior issues. Significant renovations are required to make it move-in ready and suitable for various uses, including apartments and storage. The highest-ROI updates include roof replacement, HVAC upgrades, and interior renovations.
Repairs flagged
- Major roof — Tear-off roof on fire stairs
- Major HVAC/mechanicals — No photos of the HVAC/mechanicals
- Major interior walls/paint — No photos of the interior walls/paint
- Major exterior — No photos of the exterior
- Major flooring — No photos of the flooring
- Major kitchen — No photos of the kitchen
- Major bathrooms — No photos of the bathrooms
- Major windows — No photos of the windows
- Major HVAC/mechanicals — No photos of the HVAC/mechanicals
- Major landscaping/curb appeal — No photos of the landscaping/curb appeal
Value-add opportunities
- Both roof replacement — Improves safety and appearance
- Both HVAC upgrade — Enhances comfort and energy efficiency
- Both exterior paint and landscaping — Enhances curb appeal and property value
- Both interior updates — Improves living conditions and aesthetics
- Both kitchen and bathroom renovations — Enhances functionality and appeal
Renovation cost estimate screening
| Repair item | Severity | Est. cost |
|---|---|---|
| roof · Tear-off roof on fire stairs | Major | $15,000–50,000 |
| HVAC/mechanicals · No photos of the HVAC/mechanicals | Major | $15,000–50,000 |
| interior walls/paint · No photos of the interior walls/paint | Major | $15,000–50,000 |
| exterior · No photos of the exterior | Major | $15,000–50,000 |
| flooring · No photos of the flooring | Major | $15,000–50,000 |
| kitchen · No photos of the kitchen | Major | $15,000–50,000 |
| bathrooms · No photos of the bathrooms | Major | $15,000–50,000 |
| windows · No photos of the windows | Major | $15,000–50,000 |
| HVAC/mechanicals · No photos of the HVAC/mechanicals | Major | $15,000–50,000 |
| landscaping/curb appeal · No photos of the landscaping/curb appeal | Major | $15,000–50,000 |
| Total estimated repair cost · 10 items | $150,000–500,000 |
Value-add ROI direction
- Both roof replacement — Improves safety and appearance ↑
- Both HVAC upgrade — Enhances comfort and energy efficiency ↑
- Both exterior paint and landscaping — Enhances curb appeal and property value ↑
- Both interior updates — Improves living conditions and aesthetics ↑
- Both kitchen and bathroom renovations — Enhances functionality and appeal ↑
ⓘ Cost ranges are severity-bucket heuristics (US national rule-of-thumb). Get contractor quotes + a written scope before underwriting a rehab budget.
Schools (NCES district)
- District
- Rochester City School District
- NCES district ID
- 3624750
- Math proficiency
- 21% ▬ 0.00%
- Reading proficiency
- 26% ▲ 4.00%
- Median HH income
- $30,923
- Composite
- 18.98/100
- National rank
- #8850
- State rank
- #589 of 590 in NY
Livability — Rochester
- Score
- 76/100
- State rank
- #222
- US rank
- #3482
Category grades
Schools grade is shown separately in the Schools card above.
Census & demographics
- Census place
- Rochester, NY
- County
- Monroe County · 674,131 people
- City population
- 432,803
- Metro
- Rochester, NY
- Population (ZIP)
- 32,381
- Household income
- $35,383
- Rent vs Own
- Severe rent burden
- 2756.0
Population outlook (Monroe County) Hauer SSP2
- Today (2025)
- 759,460 people
- By 2030
- 757,154 · -0.3%
- By 2040
- 740,644 · -2.5%
- By 2050
- 714,443 · -5.9%
- By 2075
- 645,883 · -15.0%
- By 2100
- 547,084 · -28.0%
Race, ethnicity, and origin ACS 2023
- Neighborhood character
- Diverse neighborhood (Simpson 0.66)
- Race & ethnicity
- Hispanic / Latino 40% Black 40% White 14% Two or more races 12% Asian 1%
- Hispanic origin (detail)
- Mexican 1% Puerto Rican 32% Dominican 3%
- Common ancestry
- Romanian 1% Lithuanian 1% Serbian 1%
- Foreign-born
- 8% · Canada, Jamaica
- Languages at home
- 65% English-only · Spanish 30% Other Asian/Pacific 2% French/Haitian/Cajun 1%
Political lean MEDSL · Monroe
- 2024 margin
- D (+19.1) · D 59.5% · R 40.5%
- 2008→2024 swing
- +1.4pp toward D · 2008: 17.7pp · 2024: 19.1pp
- All cycles
- 2024: D+19.1 2020: D+21.0 2016: D+14.1 2012: D+17.4 2008: D+17.7
Not yet ingested
- Civics
- —
Market trends
- HPI YoY
- ▼ -10.66%
- Current HPI
- 254.1805
- Rent YoY
- ▲ 8.88%
- Metro
- Rochester, NY
- State GDP YoY
- ▲ 2.60%
- F500 in state
- 92
Industry mix (Fortune 500 HQ in NY)
| Industry | F500 HQs | Revenue |
|---|---|---|
| Financial Services | 10 | $950B |
|
||
| Consumer Goods | 9 | $162B |
|
||
| Insurance | 4 | $225B |
|
||
| Telecommunications | 2 | $144B |
|
||
| Pharmaceuticals | 2 | $112B |
|
||
| Media / Entertainment | 2 | $69B |
|
||
Price history
+0.0% since first listed4 events — show timeline
- 2026-05-27 Pending — UNYREIS
- 2026-05-12 Listing Removed — UNYREIS
- 2026-05-05 Listed $224,900 UNYREIS
- 2026-05-05 Listed $224,900 UNYREIS
Cash-flow waterfall
monthlySold comps — $/sqft
last 12 mo · ≤1 miLoading sold comps…