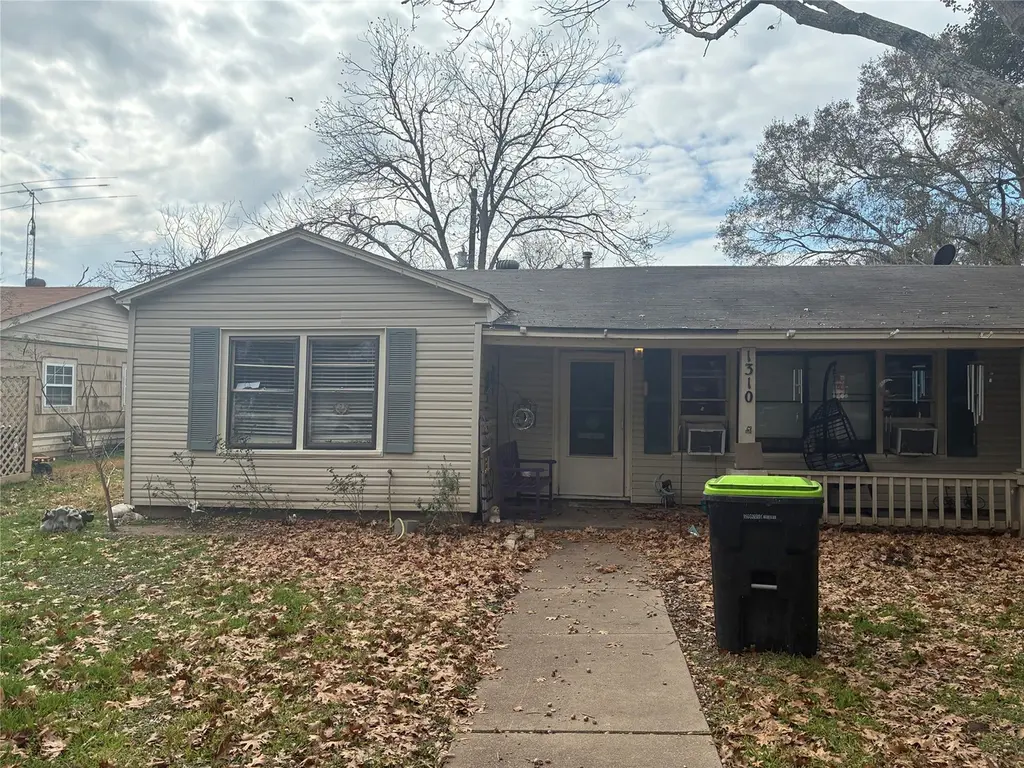
1310 Dudley St · Richmond, TX
Flood risk 1/10 · Minimal
- FEMA flood zone
- X (unshaded)
- Chance of flooding over 30 yrs
- 0.0%
- Est. flood insurance / yr
- $507 – $1,088
Fire risk 1/10 · Minimal
- Est. fire insurance / yr
- $1,222 – $2,270
Heat risk 9/10 · Severe
- Hot days now (above 110°F)
- 7 days/yr
- Hot days in 30 yrs
- 21 days/yr
Wind risk 9/10 · Severe
- Chance of severe wind over 30 yrs
- 99.0%
Air-quality risk 2/10 · Minimal
- Unhealthy air days now
- 1 days/yr
- Unhealthy air days in 30 yrs
- 1 days/yr
Risk factors via First Street. Map © Google.
Why this score? — see what drove the C- grade
The composite is a weighted blend of 9 inputs, each scored 0–100. Each bar is that input's sub-score; the figure is the points it added to the 100-point composite (weight × sub-score).
- Cash flow +16.6/30.0
- ARV discount +15.0/15.0
- DSCR +5.1/10.0
- 1% rule +5.0/10.0
- Schools +4.6/10.0
- Livability +3.5/5.0
- Condition / age +2.5/5.0
- Rent growth +2.0/5.0
- Appreciation +0.0/10.0
$139,900
🖨 Deal sheet 📄 Offer letter ✓ Due diligence
Listing remarks MLS
BUYER TO VERIFY ROOM MEASUREMENTS AND SCHOOL DISTRICT. FIXER UPPER SELLING AS-IS
Key facts
- Garage
- Built 1953
- Listed 57 days
Neighborhood map
What this means for you Summary
Snapshot
- This is a 2-bed/1.0-bath single-family listed at $140k.
Deal economics
- At list price, monthly cash flow is $84 ($1k/yr) — positive.
- The deal already cash-flows at list — no discount required.
- To meet the 1% rule (rent ≥ 1% of price), the offer needs to be $140k (0.1% below list).
- Recommended offer: $136k (3.0% below list) — sets the bar for market timing.
- Cap rate 7.0% vs local median 2.6% in Richmond — top-decile yield for the area; either an underpriced asset or a hidden risk that comps aren't pricing in. Stress-test before assuming the spread holds.
Location & tenants
- Location reads 70/100 on livability (#363 in TX) — a middle-class / working-renter tenant base. Strengths: cost of living A+, housing A+, health & safety B+; Watch: schools C-, crime C-, amenities F.
- Lamar CISD (suburban): math 50% / reading 53% proficiency, ranked #116 of 826 in TX (top 14%) — acceptable for families but not a draw, mixed tenant base, ~2y average lease.
- Market conditions: Rents soft (-1.8%/yr); 1332 active listings in the ZIP; 22 comparable units currently listed for rent nearby; rentals leasing fast (median 13d on market — plan ~1-2 weeks tenant-placement turnaround); 41% of comp listings sitting > 30 days — soft ceiling on asking rent; solid renter incomes; 12,093 units permitted in Fort Bend County in 2024 (815 in 5+ unit buildings).
- This rent is only 16% of the median local income ($102k/yr) — well below the 30% rent-burden line; pricing power to push rent on renewal without tenant pushback.
Forward outlook
- Local home prices are declining (-3.0%/yr); year-one equity from $967 of loan paydown is wiped out by about $4k of value loss. Plan a longer hold.
- Fort Bend County population projected at +75% by 2050 — long-run rental-demand tailwind backs the buy-and-hold thesis.
Negotiation context
- It's been on market 58 days — a 3% lower offer ($136k) is reasonable based on typical stale-listing flexibility.
Risks & watch-outs
- Watch-outs: built in 1953 — expect roof / HVAC / electrical / plumbing capex.
- Climate carrying-cost: severe wind risk, 99% chance of damaging wind over 30y; extreme-heat days projected 7→21/yr by 2055 (HVAC capex compounding) — expect insurance premiums to compound above CPI over the hold.
Questions for the listing agent
- It's been on market 58 days. Have you received any prior offers? Is the seller open to a 3% concession, seller financing, or rate buy-down credit?
- Built in 1953 — when were the roof, HVAC, electrical panel, plumbing, and water heater last replaced?
- Is there a deadline driving the sale (1031 exchange, divorce, estate, relocation)? That informs how much negotiation room exists.
- What's the average days-on-market for RENTAL listings here right now (not sales)? A rising rental-DOM trend means longer vacancies and softer asking-rent achievability than the comps imply.
- What's the recent tenant-quality profile in this submarket — average credit score on applications, eviction rate, late-payment / NSF rate, and stable-employment percentage? A property-management company in the area should have these aggregated.
- How much new for-sale + rental construction is in the pipeline within 1–3 miles? Heavy new supply typically softens prices + rents 12–24 months out; constrained supply supports both.
Investment metrics
- 1% rule
- 1.00% ✗
- Cap rate
- 7.01%
- Cash-on-cash
- 2.57%
- DSCR
- 1.11
- GRM
- 8.3
CMA / ARV
- ARV (median comp)
- $196,611
- List price
- $139,900
- Delta
- -28.84%
- Verdict
- UNDERPRICED
- Comps
- 20 within 1.0 mi
Show comp detail 2 sales within ~0.75 mi
| Address | Dist | Beds/Ba | Sqft | Sold | Price | $/sf | Match |
|---|---|---|---|---|---|---|---|
| 1202 Fort St | 0.38mi | 3/2.0 (+1) | 1,217 (+12%) | 11mo | $250,000 | $205 | 44 |
| 1206 Fort St | 0.39mi | 3/2.0 (+1) | 1,241 (+14%) | 21mo | $240,000 | $193 | 31 |
Match score weights: distance 35% · size 25% · config 20% · recency 20%. Top-matched comps best support the ARV.
Projected returns pro-forma
-3.0% appreciation · 0.0% rent growth · sell at horizon
- IRR
- -15.8%
- Equity multiple
- 0.45×
- Total profit
- $-21,358
- Equity at exit
- $20,860
- IRR
- -14.1%
- Equity multiple
- 0.30×
- Total profit
- $-27,311
- Equity at exit
- $12,096
Cash invested: $39,172 (down + closing). Projections, not guarantees.
Landlord ↔ Tenant lean methodology
- Overall (STATE)
- 87 Strongly Landlord-Friendly
- State Texas
- 87 Strongly Landlord-Friendly · R+5
- County
- — inherits STATE
- City
- — inherits STATE
ZIP-level market 77469
- Home prices YoY
- -25.1%
- Rents YoY
- -1.8%
- Active inventory
- 1332
- Price-to-rent
- 8.3×
Monthly cashflow live
- Estimated rent
- $1,397 high interval (Pro) →
- Mortgage (P&I)
- −$734
- Tax from tax record
- −$228 /mo · $2,732/yr
- Insurance
- −$58
- HOA
- −$0
- Vacancy / Maint / Mgmt
- −$293
- Net cashflow
- $84
Break-even live
UW: 25.0% down · 7.5% · 30yr · 1.5% tax · 5.0% vac · 8.0% maint · 8.0% mgmt
Financing live
Cash to close
- Down payment
- $34,975
- Closing costs
- $4,197
- Reserves months
- —
- Total cash needed
- —
Loan-product check · same deal, 3 products live
Conventional
25% down · 7.5% · 30yr
- Down + closing
- —
- Monthly P&I
- —
- Monthly cashflow
- —
- DSCR
- —
- Eligible?
- —
Personal DTI + credit; lowest rate.
DSCR
20% down · 8.5% · 30yr
- Down + closing
- —
- Monthly P&I
- —
- Monthly cashflow
- —
- DSCR
- —
- Eligible?
- —
No personal income docs; deal must DSCR.
Hard money
10% down · 12.0% · 12mo
- Down + closing
- —
- Monthly P&I
- —
- Monthly cashflow
- —
- DSCR
- —
- Eligible?
- —
Short-term bridge; refi at stabilization.
Rent comps 22 comps
| Address | Beds | Baths | Sqft | Rent | $/sqft | DOM | Units | Dist |
|---|---|---|---|---|---|---|---|---|
| 1217 Westwood Dr Rosenberg, TX | 1.0 | 1.0 | 700 | $953 | $1.36 | 12d | 1 | 0.35mi |
| 1217 Westwood Dr Unit 1274 Rosenberg, TX | 2.0 | 2.0 | 900 | $1,121 | $1.25 | 2d | 1 | 0.35mi |
| 1217 Westwood Dr Unit 1291 Rosenberg, TX | 1.0 | 1.0 | 700 | $961 | $1.37 | 2d | 1 | 0.35mi |
| 1217 Westwood Dr Unit 424 Rosenberg, TX | 2.0 | 2.0 | 900 | $1,129 | $1.25 | 5d | 1 | 0.35mi |
| 1217 Westwood Dr Unit 1268 Rosenberg, TX | 1.0 | 1.0 | 700 | $994 | $1.42 | 43d | 1 | 0.35mi |
| 1217 Westwood Dr Unit 1162 Rosenberg, TX | 1.0 | 1.0 | 700 | $964 | $1.38 | 5d | 1 | 0.38mi |
| 1217 Westwood Dr Unit 1238 Rosenberg, TX | 1.0 | 1.0 | 700 | $999 | $1.43 | 12d | 1 | 0.38mi |
| 1108 Fort St Unit 1108 Richmond, TX | 3.0 | 1.0 | 1000 | $1,450 | $1.45 | 16d | 1 | 0.41mi |
| 2010 Thompson Rd Richmond, TX | 1.0–2.0 | 1.0 | 757 | $1,100 | $1.45 | 3d | 3 | 0.42mi |
| 2117 Thompson Rd Richmond, TX | 2.0 | 1.0 | 966 | $975 | $1.01 | 43d | 1 | 0.59mi |
| 1806 Mustang Dr Richmond, TX | 3.0 | 2.0 | 1296 | $1,100 | $0.85 | 43d | 1 | 0.65mi |
| 1111 Golfview Dr Unit 1162 Richmond, TX | 1.0 | 1.0 | 771 | $1,029 | $1.33 | 43d | 1 | 0.71mi |
| 1111 Golfview Dr Unit 1148 Richmond, TX | 2.0 | 2.0 | 1000 | $1,899 | $1.90 | 43d | 1 | 0.71mi |
| 1111 Golfview Dr Richmond, TX | 1.0 | 1.0 | 754 | $1,092 | $1.45 | 1d | 13 | 0.71mi |
| 4726 Reading Rd Rosenberg, TX | 3.0 | 2.0 | 1060 | $1,275 | $1.20 | 43d | 1 | 0.84mi |
| 4719 Reading Rd Rosenberg, TX | 1.0–2.0 | 1.0–2.0 | 820 | $1,450 | $1.77 | 5d | 6 | 0.86mi |
| 4720 Reading Rd Rosenberg, TX | 2.0–3.0 | 1.0–2.0 | 930 | $1,166 | $1.25 | 1d | 15 | 0.86mi |
| 24500 Wildwood Park Rd Richmond, TX | 1.0–2.0 | 1.0–2.0 | 999 | $2,068 | $2.07 | 1d | 19 | 0.92mi |
| 207 Golfview Dr Richmond, TX | 1.0 | 1.0 | 771 | $1,216 | $1.58 | 43d | 1 | 0.93mi |
| 4932 Vancouver Blvd Richmond, TX | 3.0 | 2.0 | 1321 | $3,500 | $2.65 | 12d | 1 | 1.01mi |
| 7410 Town Center Blvd Rosenberg, TX | 2.0 | 2.0 | 1147 | $1,628 | $1.42 | 43d | 1 | 1.49mi |
| 7210 Town Center Blvd Rosenberg, TX | 1.0 | 1.0 | 725 | $1,340 | $1.85 | 43d | 1 | 1.49mi |
Listing history 7 events
-
2026-06-04days on market $139,900 Active 58 DOM
-
2026-06-03days on market $139,900 Active 57 DOM
-
2026-06-02days on market $139,900 Active 56 DOM
-
2026-06-01days on market $139,900 Active 55 DOM
-
2026-05-31days on market $139,900 Active 54 DOM
-
2026-04-07$139,900 Active 80-char remark
Show marketing remark (80 chars)
BUYER TO VERIFY ROOM MEASUREMENTS AND SCHOOL DISTRICT. FIXER UPPER SELLING AS-IS
-
2026-03-19soldstatus
ⓘ Source: listings_history table (triggers on properties + properties_extension) + one-shot
backfill from property_details.listing_events for pre-trigger history.
Tax reassessment forecast TX · Resets to sale price
- Current annual tax
- $2,732 · $228/mo
- Projected year-2 tax
- $2,732 · $228/mo
- Expected delta
- $0/yr ($0/mo · 0.0%)
ⓘ Screening estimate from a state-policy table — verify with the county assessor before closing.
Climate risk First Street
- Flood 1/10 Low FEMA zone X (unshaded) · 0% chance over 30 yrs
- Wildfire 1/10 Low
- Heat 9/10 Extreme 7 d/yr ≥110°F today · 21 d/yr by 30 yrs out
- Wind 9/10 Extreme 99% chance of damaging wind over 30 yrs
- Air quality 2/10 Low 1 unhealthy d/yr today · 1 by 30 yrs out
Nearby sold comps map
Loading sold comps map…
Walkable amenities ~0.75 mi
Loading nearby amenities…
Taxation est. · year 1
- Rental income
- $16,764
- − Mortgage interest
- −$7,837
- − Property taxes
- −$2,732
- − Insurance
- −$700
- − Repairs & maintenance
- −$1,341
- − Management
- −$1,341
- − Depreciation
- −$4,070
- Taxable loss
- −$1,256
- Est. tax savings @ 24.0%
- +$301
- After-tax cash flow
- $1,310/yr
For passive investors: Depreciation is non-cash, so a rental often shows a tax loss while cash-flowing — sheltering income. Rental losses are passive: they offset passive income freely, and up to $25,000/yr can offset ordinary (W-2) income if you actively participate and your MAGI is under $100k (phasing out to $0 by $150k); unused losses carry forward. On sale, claimed depreciation is recaptured at up to 25%, and gains may owe capital-gains tax (a 1031 exchange can defer both). Figures are a year-1 estimate at your 24.0% rate — not tax advice; consult a CPA.
Schools (NCES district)
- District
- Lamar CISD
- NCES district ID
- 4826580
- Math proficiency
- 50% ▼ -12.00%
- Reading proficiency
- 53% ▼ -4.00%
- Median HH income
- $75,213
- Composite
- 46.43/100
- National rank
- #2452
- State rank
- #116 of 826 in TX
Livability — Richmond
- Score
- 70/100
- State rank
- #363
- US rank
- #7780
Category grades
Schools grade is shown separately in the Schools card above.
Census & demographics
- Census place
- Richmond, TX
- County
- Fort Bend County · 836,777 people
- City population
- 158,237
- Metro
- Houston-The Woodlands-Sugar Land, TX
- Population (ZIP)
- 69,826
- Household income
- $102,125
- Rent vs Own
- Severe rent burden
- 1292.0
Population outlook (Fort Bend County) Hauer SSP2
- Today (2025)
- 1,004,526 people
- By 2030
- 1,153,104 · +14.8%
- By 2040
- 1,453,718 · +44.7%
- By 2050
- 1,753,781 · +74.6%
- By 2075
- 2,455,772 · +144.5%
- By 2100
- 2,930,528 · +191.7%
Race, ethnicity, and origin ACS 2023
- Neighborhood character
- Highly diverse neighborhood (Simpson 0.76)
- Race & ethnicity
- Hispanic / Latino 29% White 27% Black 25% Two or more races 15% Asian 15%
- Hispanic origin (detail)
- Mexican 21%
- Common ancestry
- Romanian 1% Lithuanian 1%
- Foreign-born
- 24% · Canada, Vietnam, China
- Languages at home
- 65% English-only · Spanish 17% Other Indo-European 7% Other Asian/Pacific 2%
Political lean MEDSL · Fort Bend
- 2024 margin
- Toss-up / Even · D 49.5% · R 47.9% · Other 2.6%
- 2008→2024 swing
- +4.0pp toward D · 2008: -2.4pp · 2024: 1.6pp
- All cycles
- 2024: D+1.6 2020: D+10.6 2016: D+6.6 2012: R+6.8 2008: R+2.4
Not yet ingested
- Civics
- —
Market trends
- HPI YoY
- ▼ -78.66%
- Current HPI
- 234.9892
- Rent YoY
- ▼ -1.81%
- Metro
- Houston-The Woodlands-Sugar Land, TX
- State GDP YoY
- ▲ 3.95%
- F500 in state
- 110
Industry mix (Fortune 500 HQ in TX)
| Industry | F500 HQs | Revenue |
|---|---|---|
| Energy | 16 | $1,198B |
|
||
| Technology | 5 | $198B |
|
||
| Engineering / Construction | 4 | $72B |
|
||
| Energy Services | 3 | $60B |
|
||
| Utilities | 3 | $41B |
|
||
| Healthcare | 2 | $330B |
|
||
Price history
2 events — show timeline
- 2026-04-07 Listed $139,900 HARMLS
- 2026-03-19 Sold (Public Records) — Public Records
Property tax history
+3.1%/yrLatest (2025): $2,732 · -23.3% YoY. Source: county tax records.
Cash-flow waterfall
monthlySold comps — $/sqft
last 12 mo · ≤1 miLoading sold comps…