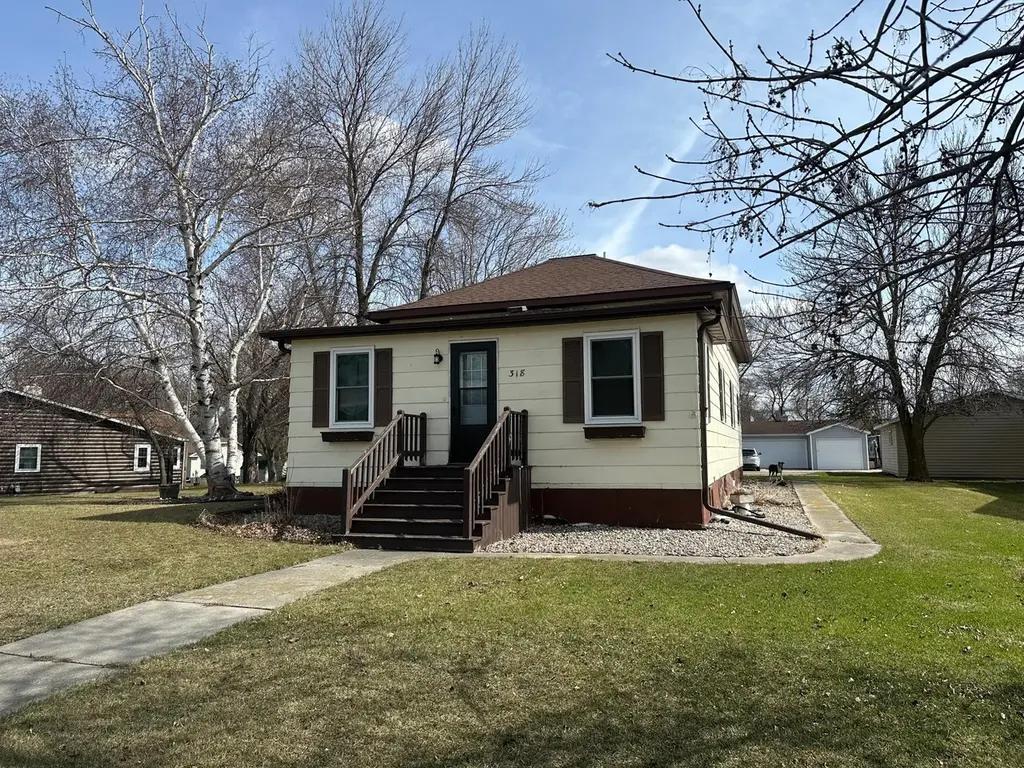
318 2nd St SE · Hallock, MN
Flood risk 3/10 · Minor
- FEMA flood zone
- X (unshaded)
- Chance of flooding over 30 yrs
- 0.2%
- Est. flood insurance / yr
- $507 – $1,088
Fire risk 5/10 · Moderate
- Est. fire insurance / yr
- $888 – $1,650
Heat risk 2/10 · Minimal
- Hot days now (above 95°F)
- 7 days/yr
- Hot days in 30 yrs
- 13 days/yr
Wind risk 1/10 · Minimal
- Chance of severe wind over 30 yrs
- —
Air-quality risk 4/10 · Minor
- Unhealthy air days now
- 5 days/yr
- Unhealthy air days in 30 yrs
- 5 days/yr
Risk factors via First Street. Map © Google.
Why this score? — see what drove the C grade
The composite is a weighted blend of 9 inputs, each scored 0–100. Each bar is that input's sub-score; the figure is the points it added to the 100-point composite (weight × sub-score).
- Cash flow +17.1/30.0
- Appreciation +7.6/10.0
- ARV discount +7.5/15.0
- Schools +5.9/10.0
- DSCR +5.3/10.0
- Livability +3.9/5.0
- 1% rule +3.7/10.0
- Rent growth +2.5/5.0
- Condition / age +2.5/5.0
$110,000
🖨 Deal sheet (PDF) 📄 Offer letter ✓ Due diligence
Listing remarks
Welcome to small-town living at its finest! This charming 3 bedroom, 2 bath home offers comfort, value, and peace of mind, all at an affordable price. Nestled in a quiet community, this property is perfect for those looking to enjoy a slower pace without sacrificing space. Inside, you’ll find a well-maintained interior with plenty of room to spread out, whether you’re relaxing with family or entertaining guests. Recent updates include new natural gas boiler, new gutters, and newer windows adding both efficiency and curb appeal. The home has been thoughtfully cared for and is in solid condition, making it a great opportunity for first-time buyers, investors, or anyone looking for
Key facts
- 0.31 acre lot
- 2 garage spots
- Built 1889
Property features AI
Finance
- Other: Lot about 0.31 acres (approx. 98 x 139); Above-grade finished area listed as 1,304; Below-grade area listed as 960; Total building area listed as 2,264; Foundation area listed as 1,304; Property is not fractional ownership
Exterior
- Parking: 2-car garage (approximately 26 x 22)
- Utilities: City water connected; City sewer connected; Natural gas
- Home design: Residential property; One level
- Construction: Asphalt roof; Block foundation
- Exterior features: Wood exterior
Interior
- Kitchen: Range, Refrigerator, Dishwasher not listed
- Bedrooms: 3 bedrooms
- Bathrooms: 1 full bath, 1 half bath
- Heating & cooling: Boiler heating; No central air
- Interior features: Dryer, Range, Refrigerator, Washer
- Laundry & utility: Washer and Dryer
Neighborhood map
What this means for you Summary
Snapshot
- This is a 3-bed/2.0-bath single-family listed at $110k.
Deal economics
- At list price, monthly cash flow is $77 ($929/yr) — positive.
- The deal already cash-flows at list — no discount required.
- To meet the 1% rule (rent ≥ 1% of price), the offer needs to be $96k (13.1% below list).
- Recommended offer: $96k (13.1% below list) — sets the bar for 1% rule.
Location & tenants
- Location reads 78/100 on livability (#104 in MN, #2,386 nationally) — a middle-class / working-renter tenant base. Strengths: crime A+, cost of living A+, housing A+; Watch: amenities F, commute F.
- Kittson Central School District (rural): math 65% / reading 70% proficiency, ranked #60 of 467 in MN (top 13%) — acceptable for families but not a draw, mixed tenant base, ~2y average lease; only 17% free/reduced lunch — higher-income household profile.
- Zoned schools: Kittson Central Elementary (math 52% / reading 62%, grade C+, #265 of 857 statewide, top 35%, 133 students, 29% FRL); Kittson Central Secondary (math 44% / reading 54%, grade D, #143 of 471 statewide, top 33%, 109 students, 39% FRL) — zoned schools average 34% FRL vs 17% district-wide (17 pts higher); higher-poverty schools than district average — tighter screening recommended.
- Zoned-school proficiency averages 53% at this address vs 68% district-wide (-14 pts) — the specific schools serving this property underperform the Kittson Central School District average; the district grade overstates school quality for this exact location.
- Market conditions: 7 active listings in the ZIP; 4 units permitted in Kittson County in 2024 (0 in 5+ unit buildings).
Forward outlook
- In year one you build about $6k of equity ($761 loan paydown + $6k appreciation (5.2% local appreciation)).
- Kittson County population projected to shrink 8% by 2050 — rents likely to lag national; underwrite the cash flow, not the appreciation.
- At projected returns (5.2% appreciation + 3.0% rent growth), your $31k cash investment doubles in ~4 years — after that, you're playing with house money.
- By year 6, paydown + projected appreciation supports a ~$35k cash-out refi (75% LTV) — recoverable capital for the next deal without selling this one.
Negotiation context
- It's been on market 55 days — a 3% lower offer ($107k) is reasonable based on typical stale-listing flexibility.
- Current owner paid $49k; list at $110k implies a 124% gain — meaningful room to come down on a strong offer.
Risks & watch-outs
- Watch-outs: built in 1889 — expect roof / HVAC / electrical / plumbing capex.
- Climate carrying-cost: moderate wildfire risk — expect insurance premiums to compound above CPI over the hold.
Questions for the listing agent
- It's been on market 55 days. Have you received any prior offers? Is the seller open to a 13% concession, seller financing, or rate buy-down credit?
- Built in 1889 — when were the roof, HVAC, electrical panel, plumbing, and water heater last replaced?
- Is there a deadline driving the sale (1031 exchange, divorce, estate, relocation)? That informs how much negotiation room exists.
- Schools are A-rated — typically a magnet for longer-tenancy family renters. What's the average tenant stay here, and is there a school-zone premium baked into asking?
- What's the average days-on-market for RENTAL listings here right now (not sales)? A rising rental-DOM trend means longer vacancies and softer asking-rent achievability than the comps imply.
- What's the recent tenant-quality profile in this submarket — average credit score on applications, eviction rate, late-payment / NSF rate, and stable-employment percentage? A property-management company in the area should have these aggregated.
- How much new for-sale + rental construction is in the pipeline within 1–3 miles? Heavy new supply typically softens prices + rents 12–24 months out; constrained supply supports both.
Investment metrics
- 1% rule
- 0.87% ✗
- Cap rate
- 7.14%
- Cash-on-cash
- 3.01%
- DSCR
- 1.13
- GRM
- 9.6
CMA / ARV
- ARV (median comp)
- $252,230
- List price
- $110,000
- Delta
- -56.39%
- Verdict
- UNDERPRICED
- Comps
- 2 within 1.0 mi
Projected returns pro-forma
5.22% appreciation · 3.0% rent growth · sell at horizon
- IRR
- 16.0%
- Equity multiple
- 2.03×
- Total profit
- $31,613
- Equity at exit
- $63,790
- IRR
- 16.3%
- Equity multiple
- 3.94×
- Total profit
- $90,634
- Equity at exit
- $111,315
Cash invested: $30,800 (down + closing). Projections, not guarantees.
Landlord ↔ Tenant lean methodology
- Overall (STATE)
- 46 Balanced
- State Minnesota
- 46 Balanced · D+2
- County
- — inherits STATE
- City
- — inherits STATE
ZIP-level market 56728
- Home prices YoY
- 4.2%
- Active inventory
- 7
- Price-to-rent
- 9.6×
Monthly cashflow live
- Estimated rent
- $956 medium interval (Pro) →
- Mortgage (P&I)
- −$577
- Tax from tax record
- −$55 /mo · $664/yr
- Insurance
- −$46
- HOA
- −$0
- Lot rent
- −$0
- Vacancy / Maint / Mgmt
- −$201
- Net cashflow
- $77
Break-even live
Sensitivity live
| Price | -10% $140 | -5% $109 | +0% $77 | +5% $46 | +10% $15 |
|---|---|---|---|---|---|
| Rent | -10% $2 | -5% $40 | +0% $77 | +5% $115 | +10% $153 |
| Rate | -1.0pp $133 | -0.5pp $105 | base $77 | +0.5pp $49 | +1.0pp $20 |
UW: 25.0% down · 7.5% · 30yr · 1.5% tax · 5.0% vac · 8.0% maint · 8.0% mgmt
Financing live
Cash to close
- Down payment
- $27,500
- Closing costs
- $3,300
- Reserves months
- —
- Total cash needed
- —
Loan-product check · same deal, 3 products live
Conventional
25% down · 7.5% · 30yr
- Down + closing
- —
- Monthly P&I
- —
- Monthly cashflow
- —
- DSCR
- —
- Eligible?
- —
Personal DTI + credit; lowest rate.
DSCR
20% down · 8.5% · 30yr
- Down + closing
- —
- Monthly P&I
- —
- Monthly cashflow
- —
- DSCR
- —
- Eligible?
- —
No personal income docs; deal must DSCR.
Hard money
10% down · 12.0% · 12mo
- Down + closing
- —
- Monthly P&I
- —
- Monthly cashflow
- —
- DSCR
- —
- Eligible?
- —
Short-term bridge; refi at stabilization.
Listing history 20 events
-
2026-06-22days on market $110,000 Active 55 DOM
-
2026-06-21days on market $110,000 Active 54 DOM
-
2026-06-21days on market $110,000 Active 53 DOM
-
2026-06-18days on market $110,000 Active 51 DOM
-
2026-06-17days on market $110,000 Active 50 DOM
-
2026-06-16days on market $110,000 Active 49 DOM
-
2026-06-15days on market $110,000 Active 48 DOM
-
2026-06-13days on market $110,000 Active 46 DOM
-
2026-06-12days on market $110,000 Active 45 DOM
-
2026-06-09days on market $110,000 Active 42 DOM
-
2026-06-08days on market $110,000 Active 41 DOM
-
2026-06-07days on market $110,000 Active 40 DOM
-
2026-06-07days on market $110,000 Active 39 DOM
-
2026-06-04days on market $110,000 Active 36 DOM
-
2026-06-02days on market $110,000 Active 35 DOM
-
2026-06-01days on market $110,000 Active 34 DOM
-
2026-05-31days on market $110,000 Active 33 DOM
-
2026-05-31days on market $110,000 Active 32 DOM
-
2026-04-27$110,000 Active 861-char remark
-
2019-02-27soldstatus $49,000
ⓘ Source: listings_history table (triggers on properties + properties_extension) + one-shot
backfill from property_details.listing_events for pre-trigger history.
Tax reassessment forecast MN · Partial reset (capped growth)
- Current annual tax
- $664 · $55/mo
- Projected year-2 tax
- $948 · $79/mo
- Expected delta
- +$284/yr (+$24/mo · 42.8%)
ⓘ Screening estimate from a state-policy table — verify with the county assessor before closing.
Climate risk First Street
- Flood 3/10 Moderate FEMA zone X (unshaded) · 20% chance over 30 yrs
- Wildfire 5/10 Major
- Heat 2/10 Low 7 d/yr ≥95°F today · 13 d/yr by 30 yrs out
- Wind 1/10 Low
- Air quality 4/10 Moderate 5 unhealthy d/yr today · 5 by 30 yrs out
Nearby sold comps map
Loading sold comps map…
Walkable amenities ~0.75 mi
Loading nearby amenities…
Taxation est. · year 1
- Rental income
- $11,474
- − Mortgage interest
- −$6,162
- − Property taxes
- −$664
- − Insurance
- −$550
- − Repairs & maintenance
- −$918
- − Management
- −$918
- − Depreciation
- −$3,200
- Taxable loss
- −$937
- Est. tax savings @ 24.0%
- +$225
- After-tax cash flow
- $1,153/yr
For passive investors: Depreciation is non-cash, so a rental often shows a tax loss while cash-flowing — sheltering income. Rental losses are passive: they offset passive income freely, and up to $25,000/yr can offset ordinary (W-2) income if you actively participate and your MAGI is under $100k (phasing out to $0 by $150k); unused losses carry forward. On sale, claimed depreciation is recaptured at up to 25%, and gains may owe capital-gains tax (a 1031 exchange can defer both). Figures are a year-1 estimate at your 24.0% rate — not tax advice; consult a CPA.
Schools (NCES district)
- District
- Kittson Central School District
- NCES district ID
- 2791447
- Math proficiency
- 65% ▼ -5.00%
- Reading proficiency
- 70% ▬ 0.00%
- Median HH income
- $56,425
- Composite
- 59.2/100
- National rank
- #1936
- State rank
- #60 of 467 in MN
Livability — Hallock
- Score
- 78/100
- State rank
- #104
- US rank
- #2386
Category grades
Schools grade is shown separately in the Schools card above.
Census & demographics
- Census place
- Hallock, MN
- Population (ZIP)
- 1,149
Population outlook (Kittson County) Hauer SSP2
- Today (2025)
- 4,195 people
- By 2030
- 4,100 · -2.3%
- By 2040
- 3,952 · -5.8%
- By 2050
- 3,869 · -7.8%
- By 2075
- 3,832 · -8.7%
- By 2100
- 3,529 · -15.9%
Race, ethnicity, and origin ACS 2023
- Neighborhood character
- Predominantly White (92%)
- Race & ethnicity
- White 92% Two or more races 5% Hispanic / Latino 2%
- Common ancestry
- Portuguese 21% Romanian 9% Scottish 5%
- Foreign-born
- 5% · Canada
- Languages at home
- 92% English-only · Spanish 4% German/W. Germanic 2% Russian/Polish/Slavic 1%
Political lean MEDSL · Kittson
- 2024 margin
- Strong R (+25.0) · D 36.5% · R 61.5% · Other 2.0%
- 2008→2024 swing
- -43.5pp toward R · 2008: 18.5pp · 2024: -25.0pp
- All cycles
- 2024: R+25.0 2020: R+20.5 2016: R+22.3 2012: D+6.1 2008: D+18.5
Not yet ingested
- Civics
- —
Market trends
- HPI YoY
- ▲ 5.22%
- Current HPI
- 128.2236
- Rent YoY
- —
- Metro
- —
- State GDP YoY
- ▲ 2.41%
- F500 in state
- 34
Industry mix (Fortune 500 HQ in MN)
| Industry | F500 HQs | Revenue |
|---|---|---|
| Healthcare | 2 | $407B |
|
||
| Retail | 2 | $150B |
|
||
| Consumer Goods | 2 | $32B |
|
||
| Industrial Machinery | 2 | $6B |
|
||
| Agriculture | 1 | $40B |
|
||
| Healthcare / Medical Devices | 1 | $32B |
|
||
Price history
+124.5% since first listed2 events — show timeline
- 2026-04-27 Listed $110,000 NORTHSTARMLS as Distributed by MLS Grid
- 2019-02-27 Sold (Public Records) $49,000 Public Records
Property tax history
+1.6%/yrLatest (2025): $664 · -4.6% YoY. Source: county tax records.
Cash-flow waterfall
monthlySold comps — $/sqft
last 12 mo · ≤1 miLoading sold comps…