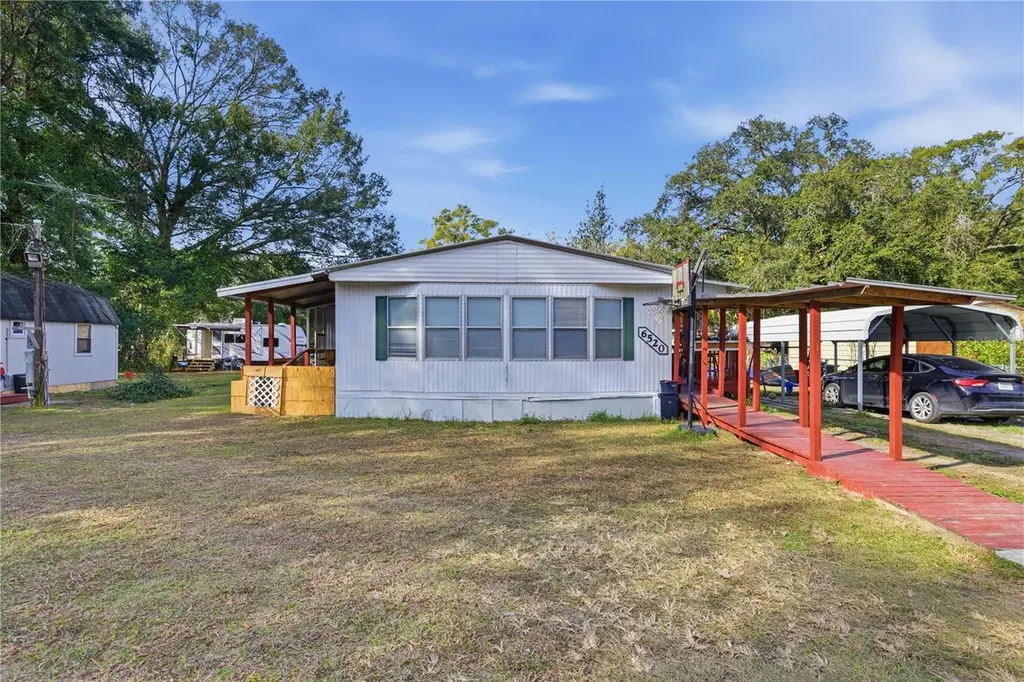
6520 NE 23rd Ave · Silver Springs, FL
Flood risk 5/10 · Moderate
- FEMA flood zone
- X (unshaded)
- Chance of flooding over 30 yrs
- 0.5%
- Est. flood insurance / yr
- $507 – $1,088
Fire risk 6/10 · Moderate
- Est. fire insurance / yr
- $947 – $1,759
Heat risk 8/10 · Major
- Hot days now (above 108°F)
- 6 days/yr
- Hot days in 30 yrs
- 18 days/yr
Wind risk 9/10 · Severe
- Chance of severe wind over 30 yrs
- 99.0%
Air-quality risk 4/10 · Minor
- Unhealthy air days now
- 4 days/yr
- Unhealthy air days in 30 yrs
- 4 days/yr
Risk factors via First Street. Map © Google.
Why this score? — see what drove the C- grade
The composite is a weighted blend of 9 inputs, each scored 0–100. Each bar is that input's sub-score; the figure is the points it added to the 100-point composite (weight × sub-score).
- Cash flow +21.7/30.0
- ARV discount +7.5/15.0
- DSCR +6.9/10.0
- 1% rule +5.5/10.0
- Schools +3.6/10.0
- Rent growth +2.5/5.0
- Livability +2.5/5.0
- Condition / age +2.5/5.0
- Appreciation +0.0/10.0
$127,500
🖨 Deal sheet (PDF) 📄 Offer letter ✓ Due diligence
Listing remarks MLS
Welcome to this well-maintained mobile home in Ocala, offering 2 bedrooms and 2 bathrooms, situated on a quiet street in a peaceful setting. The home sits on approximately 0.33 acres and features a fully fenced yard with two sheds, providing excellent storage and flexibility. One of the sheds has electricity and offers the potential to be converted into a studio or guest space. Inside, the kitchen, dining, and living areas are generously sized, creating an open and comfortable layout ideal for everyday living or entertaining. Enjoy Florida afternoons on the rear deck, and take advantage of the carport, providing covered parking for a vehicle or boat.
Key facts
- Covered parking
- Rear deck
- Fully fenced yard
Tags
Neighborhood map
What this means for you Summary
Snapshot
- This is a 2-bed/2.0-bath manufactured listed at $128k.
Deal economics
- At list price, monthly cash flow is $197 ($2k/yr) — positive.
- The deal already cash-flows at list — no discount required.
- Meets the 1% rule at list price ($1k rent vs $128k).
- Recommended offer: $112k (12.0% below list) — sets the bar for market timing.
- Cap rate 8.1% vs local median 4.2% in Silver Springs — top-decile yield for the area; either an underpriced asset or a hidden risk that comps aren't pricing in. Stress-test before assuming the spread holds.
Location & tenants
- Location reads: area grade C — affects rentability + tenant quality, not the cash-flow math above.
- Marion (rural): math 42% / reading 43% proficiency, ranked #61 of 73 in FL (top 84%) — families likely to look elsewhere, expect single-tenant / working-renter base with shorter leases; 61% free/reduced lunch — lower-income household profile, screen leases tightly.
- Zoned schools: Ocala Springs Elementary School (math 56% / reading 45%, grade D+, #1,055 of 2,144 statewide, top 50%, 690 students, 67% FRL); Fort King Middle School (math 37% / reading 35%, grade F, #410 of 571 statewide, top 72%, 1,092 students, 71% FRL); Vanguard High School (math 22% / reading 48%, grade F, #379 of 667 statewide, top 58%, 1,661 students, 59% FRL) — zoned schools at 66% FRL track the district average.
- Market conditions: 173 active listings in the ZIP; 9 comparable units currently listed for rent nearby; rentals at typical pace (median 15d on market — plan ~3-4 weeks tenant-placement turnaround); 7,071 units permitted in Marion County in 2024 (534 in 5+ unit buildings).
Forward outlook
- Local home prices are declining (-3.0%/yr); year-one equity from $882 of loan paydown is wiped out by about $4k of value loss. Plan a longer hold.
- Marion County population projected at +13% by 2050 — modest demand growth; plan on rents tracking national, not racing it.
Negotiation context
- It's been on market 153 days — a 12% lower offer ($112k) is reasonable based on typical stale-listing flexibility.
- 5 sale attempts since 3y ago; this cycle's ask has dropped $17k (12%) from the opening price — seller is motivated, your offer sets the floor, not the list.
- Current owner paid $100k; 28% above their basis — modest negotiation headroom, anchor on the comps not their cost.
Risks & watch-outs
- Climate carrying-cost: moderate flood risk; severe wind risk, 99% chance of damaging wind over 30y; major wildfire risk; extreme-heat days projected 6→18/yr by 2055 (HVAC capex compounding) — expect insurance premiums to compound above CPI over the hold.
Questions for the listing agent
- It's been on market 153 days. Have you received any prior offers? Is the seller open to a 12% concession, seller financing, or rate buy-down credit?
- Why hasn't it sold? Are there any deal-killer items the seller is aware of (foundation, flood, title, zoning, code violations)?
- Is there a deadline driving the sale (1031 exchange, divorce, estate, relocation)? That informs how much negotiation room exists.
- What's the average days-on-market for RENTAL listings here right now (not sales)? A rising rental-DOM trend means longer vacancies and softer asking-rent achievability than the comps imply.
- What's the recent tenant-quality profile in this submarket — average credit score on applications, eviction rate, late-payment / NSF rate, and stable-employment percentage? A property-management company in the area should have these aggregated.
- How much new for-sale + rental construction is in the pipeline within 1–3 miles? Heavy new supply typically softens prices + rents 12–24 months out; constrained supply supports both.
Investment metrics
- 1% rule
- 1.05% ✓
- Cap rate
- 8.14%
- Cash-on-cash
- 6.61%
- DSCR
- 1.29
- GRM
- 8.0
CMA / ARV
No comps found within radius.
Projected returns pro-forma
-3.0% appreciation · 3.0% rent growth · sell at horizon
- IRR
- -6.1%
- Equity multiple
- 0.77×
- Total profit
- $-8,128
- Equity at exit
- $19,011
- IRR
- 3.5%
- Equity multiple
- 1.25×
- Total profit
- $9,074
- Equity at exit
- $11,024
Cash invested: $35,700 (down + closing). Projections, not guarantees.
Landlord ↔ Tenant lean methodology
- Overall (STATE)
- 87 Strongly Landlord-Friendly
- State Florida
- 87 Strongly Landlord-Friendly · R+3
- County
- — inherits STATE
- City
- — inherits STATE
ZIP-level market 34479
- Home prices YoY
- -31.0%
- Active inventory
- 173
- Price-to-rent
- 8.0×
Monthly cashflow live
- Estimated rent
- $1,333 high interval (Pro) →
- Mortgage (P&I)
- −$669
- Tax from tax record
- −$135 /mo · $1,615/yr
- Insurance
- −$53
- HOA
- −$0
- Vacancy / Maint / Mgmt
- −$280
- Net cashflow
- $197
Break-even live
Sensitivity live
| Price | -10% $269 | -5% $233 | +0% $197 | +5% $161 | +10% $125 |
|---|---|---|---|---|---|
| Rent | -10% $91 | -5% $144 | +0% $197 | +5% $249 | +10% $302 |
| Rate | -1.0pp $261 | -0.5pp $229 | base $197 | +0.5pp $164 | +1.0pp $130 |
UW: 25.0% down · 7.5% · 30yr · 1.5% tax · 5.0% vac · 8.0% maint · 8.0% mgmt
Financing live
Cash to close
- Down payment
- $31,875
- Closing costs
- $3,825
- Reserves months
- —
- Total cash needed
- —
Loan-product check · same deal, 3 products live
Conventional
25% down · 7.5% · 30yr
- Down + closing
- —
- Monthly P&I
- —
- Monthly cashflow
- —
- DSCR
- —
- Eligible?
- —
Personal DTI + credit; lowest rate.
DSCR
20% down · 8.5% · 30yr
- Down + closing
- —
- Monthly P&I
- —
- Monthly cashflow
- —
- DSCR
- —
- Eligible?
- —
No personal income docs; deal must DSCR.
Hard money
10% down · 12.0% · 12mo
- Down + closing
- —
- Monthly P&I
- —
- Monthly cashflow
- —
- DSCR
- —
- Eligible?
- —
Short-term bridge; refi at stabilization.
Rent comps 9 comps
| Address | Beds | Baths | Sqft | Rent | $/sqft | DOM | Units | Dist |
|---|---|---|---|---|---|---|---|---|
| 1631 NE 71st St Ocala, FL | 2.0 | 1.0 | 1028 | $1,199 | $1.17 | 22d | 1 | 0.68mi |
| 7818 NE 21st Ave Ocala, FL | 2.0 | 2.0 | 1120 | $1,400 | $1.25 | 15d | 1 | 0.91mi |
| 2269 NE 78th Ln Ocala, FL | 2.0 | 2.0 | 985 | $1,189 | $1.21 | 15d | 1 | 0.95mi |
| 2169 NE 78th Ln Ocala, FL | 2.0 | 2.0 | 984 | $1,175 | $1.19 | 15d | 1 | 0.95mi |
| 2103 NE 78th Ln Ocala, FL | 2.0 | 2.0 | 984 | $1,199 | $1.22 | 22d | 1 | 0.96mi |
| 2077 NE 78th Ln Ocala, FL | 2.0 | 2.0 | 984 | $1,250 | $1.27 | 15d | 1 | 0.97mi |
| 1405 NE 55th St Ocala, FL | 2.0 | 1.0 | 1032 | $1,400 | $1.36 | 22d | 1 | 1.12mi |
| 1315 NE 53rd St Ocala, FL | 2.0 | 1.0 | 852 | $1,400 | $1.64 | 22d | 1 | 1.28mi |
| 1001 NE 77th St Unit 25 Ocala, FL | 2.0 | 2.0 | 952 | $1,300 | $1.37 | 15d | 1 | 1.43mi |
Listing history 26 events
-
2026-06-22days on market $127,500 Active 153 DOM
-
2026-06-18days on market $127,500 Active 150 DOM
-
2026-06-17days on market $127,500 Active 149 DOM
-
2026-06-16pricedays on market $127,500 Active 148 DOM
-
2026-06-07days on market $139,900 Active 147 DOM
-
2026-06-03days on market $139,900 Active 143 DOM
-
2026-06-02days on market $139,900 Active 142 DOM
-
2026-05-31days on market $139,900 Active 140 DOM
-
2026-05-30days on market $139,900 Active 139 DOM
-
2026-03-19price $139,900 658-char remark
Show marketing remark (658 chars)
Welcome to this well-maintained mobile home in Ocala, offering 2 bedrooms and 2 bathrooms, situated on a quiet street in a peaceful setting. The home sits on approximately 0.33 acres and features a fully fenced yard with two sheds, providing excellent storage and flexibility. One of the sheds has electricity and offers the potential to be converted into a studio or guest space. Inside, the kitchen, dining, and living areas are generously sized, creating an open and comfortable layout ideal for everyday living or entertaining. Enjoy Florida afternoons on the rear deck, and take advantage of the carport, providing covered parking for a vehicle or boat.
-
2026-01-11$144,900 Active 658-char remark
Show marketing remark (658 chars)
Welcome to this well-maintained mobile home in Ocala, offering 2 bedrooms and 2 bathrooms, situated on a quiet street in a peaceful setting. The home sits on approximately 0.33 acres and features a fully fenced yard with two sheds, providing excellent storage and flexibility. One of the sheds has electricity and offers the potential to be converted into a studio or guest space. Inside, the kitchen, dining, and living areas are generously sized, creating an open and comfortable layout ideal for everyday living or entertaining. Enjoy Florida afternoons on the rear deck, and take advantage of the carport, providing covered parking for a vehicle or boat.
-
2024-12-16soldstatus $100,000
-
2024-11-17historical
-
2024-10-18status Active
-
2024-10-15status Pending
-
2024-09-27price $119,900
-
2024-09-13price $124,900
-
2024-09-04price $134,900
-
2024-08-26price $144,900
-
2024-08-05$150,000 Active
-
2023-07-13soldstatus $105,000 Closed
-
2023-07-02status Pending
-
2023-06-30status Active
-
2023-06-22status Pending
-
2023-06-14$110,000 Active
-
1983-03-01soldstatus $8,500
ⓘ Source: listings_history table (triggers on properties + properties_extension) + one-shot
backfill from property_details.listing_events for pre-trigger history.
Tax reassessment forecast FL · Resets to sale price
- Current annual tax
- $1,615 · $135/mo
- Projected year-2 tax
- $1,615 · $135/mo
- Expected delta
- $0/yr ($0/mo · 0.0%)
ⓘ Screening estimate from a state-policy table — verify with the county assessor before closing.
Climate risk First Street
- Flood 5/10 Major FEMA zone X (unshaded) · 50% chance over 30 yrs
- Wildfire 6/10 Major
- Heat 8/10 Severe 6 d/yr ≥108°F today · 18 d/yr by 30 yrs out
- Wind 9/10 Extreme 99% chance of damaging wind over 30 yrs
- Air quality 4/10 Moderate 4 unhealthy d/yr today · 4 by 30 yrs out
Nearby sold comps map
Loading sold comps map…
Walkable amenities ~0.75 mi
Loading nearby amenities…
Taxation est. · year 1
- Rental income
- $15,996
- − Mortgage interest
- −$7,142
- − Property taxes
- −$1,615
- − Insurance
- −$638
- − Repairs & maintenance
- −$1,280
- − Management
- −$1,280
- − Depreciation
- −$3,709
- Taxable income
- $333
- Est. tax owed @ 24.0%
- −$80
- After-tax cash flow
- $2,281/yr
For passive investors: Depreciation is non-cash, so a rental often shows a tax loss while cash-flowing — sheltering income. Rental losses are passive: they offset passive income freely, and up to $25,000/yr can offset ordinary (W-2) income if you actively participate and your MAGI is under $100k (phasing out to $0 by $150k); unused losses carry forward. On sale, claimed depreciation is recaptured at up to 25%, and gains may owe capital-gains tax (a 1031 exchange can defer both). Figures are a year-1 estimate at your 24.0% rate — not tax advice; consult a CPA.
Schools (NCES district)
- District
- Marion
- NCES district ID
- 1201260
- Math proficiency
- 42% ▼ -7.00%
- Reading proficiency
- 43% ▼ -4.00%
- Median HH income
- $40,015
- Composite
- 35.61/100
- National rank
- #4890
- State rank
- #61 of 73 in FL
Livability — Silver Springs
No livability data for this city. (Only ~50 U.S. cities are tracked.)
Census & demographics
- County
- Marion County · 315,796 people
- Metro
- Ocala, FL
- Population (ZIP)
- 13,264
- Household income
- $54,283
- Rent vs Own
- Severe rent burden
- 664.0
Population outlook (Marion County) Hauer SSP2
- Today (2025)
- 365,905 people
- By 2030
- 376,768 · +3.0%
- By 2040
- 396,555 · +8.4%
- By 2050
- 412,723 · +12.8%
- By 2075
- 446,090 · +21.9%
- By 2100
- 436,193 · +19.2%
Race, ethnicity, and origin ACS 2023
- Neighborhood character
- Predominantly White (66%)
- Race & ethnicity
- White 66% Hispanic / Latino 15% Black 14% Two or more races 9%
- Hispanic origin (detail)
- Mexican 5% Puerto Rican 6% Cuban 2%
- Common ancestry
- Lithuanian 2% Italian 2% Estonian 1%
- Foreign-born
- 5% · Canada, Jamaica
- Languages at home
- 87% English-only · Spanish 11% Other Indo-European 1%
Political lean MEDSL · Marion
- 2024 margin
- Solid R (+31.6) · D 33.8% · R 65.5%
- 2008→2024 swing
- -20.0pp toward R · 2008: -11.6pp · 2024: -31.6pp
- All cycles
- 2024: R+31.6 2020: R+25.9 2016: R+26.2 2012: R+16.2 2008: R+11.6
Not yet ingested
- Civics
- —
Market trends
- HPI YoY
- ▼ -111.70%
- Current HPI
- 248.7063
- Rent YoY
- —
- Metro
- Ocala, FL
- State GDP YoY
- ▲ 3.28%
- F500 in state
- 36
Industry mix (Fortune 500 HQ in FL)
| Industry | F500 HQs | Revenue |
|---|---|---|
| Industrial Technology | 2 | $29B |
|
||
| Insurance | 2 | $17B |
|
||
| Retail | 1 | $60B |
|
||
| Technology Distribution | 1 | $58B |
|
||
| Homebuilding | 1 | $35B |
|
||
| Technology Manufacturing | 1 | $35B |
|
||
Price history
+1545.9% since first listed17 events — show timeline
- 2026-03-19 Price Changed $139,900 Stellar MLS as Distributed by MLS Grid
- 2026-01-11 Listed $144,900 Stellar MLS as Distributed by MLS Grid
- 2024-12-16 Sold (Public Records) $100,000 Public Records
- 2024-11-17 Listing Removed — Stellar MLS as Distributed by MLS Grid
- 2024-10-18 Relisted — Stellar MLS as Distributed by MLS Grid
- 2024-10-15 Pending — Stellar MLS as Distributed by MLS Grid
- 2024-09-27 Price Changed $119,900 Stellar MLS as Distributed by MLS Grid
- 2024-09-13 Price Changed $124,900 Stellar MLS as Distributed by MLS Grid
- 2024-09-04 Price Changed $134,900 Stellar MLS as Distributed by MLS Grid
- 2024-08-26 Price Changed $144,900 Stellar MLS as Distributed by MLS Grid
- 2024-08-05 Listed $150,000 Stellar MLS as Distributed by MLS Grid
- 2023-07-13 Sold (MLS) $105,000 Stellar MLS as Distributed by MLS Grid
- 2023-07-02 Pending — Stellar MLS as Distributed by MLS Grid
- 2023-06-30 Relisted — Stellar MLS as Distributed by MLS Grid
- 2023-06-22 Pending — Stellar MLS as Distributed by MLS Grid
- 2023-06-14 Listed $110,000 Stellar MLS as Distributed by MLS Grid
- 1983-03-01 Sold (Public Records) $8,500 Public Records
Property tax history
+17.8%/yrLatest (2025): $1,615 · +19.6% YoY. Source: county tax records.
Cash-flow waterfall
monthlySold comps — $/sqft
last 12 mo · ≤1 miLoading sold comps…