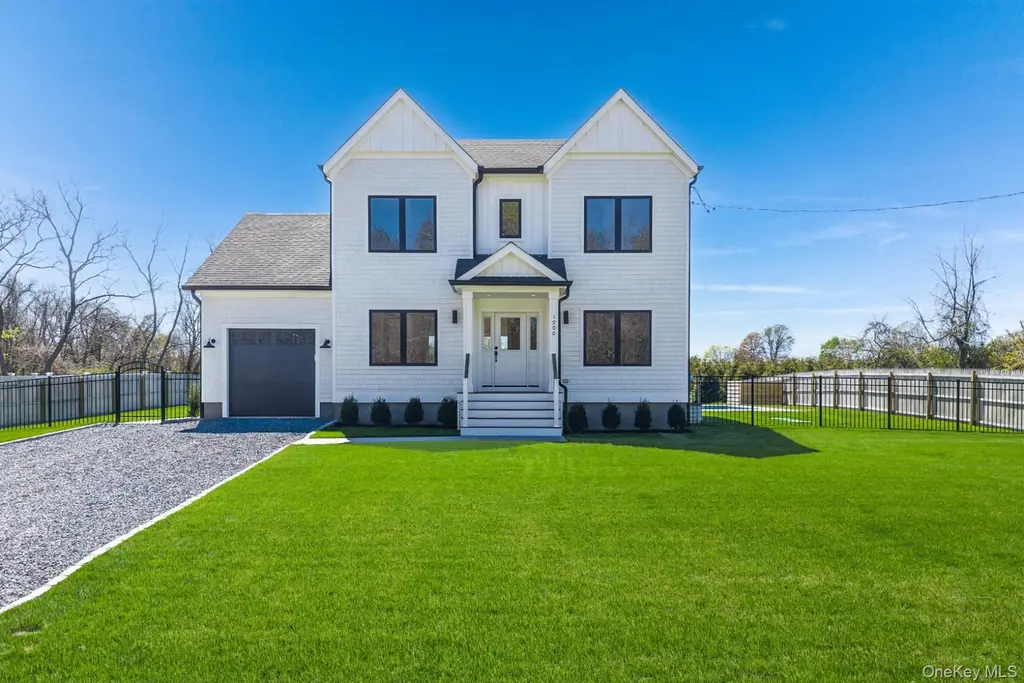
1900 Gillette Dr · East Marion, NY
Flood risk No data
- FEMA flood zone
- —
- Chance of flooding over 30 yrs
- —
- Est. flood insurance / yr
- —
Fire risk No data
- Est. fire insurance / yr
- —
Heat risk No data
- Hot days now (above threshold)
- —
- Hot days in 30 yrs
- —
Wind risk No data
- Chance of severe wind over 30 yrs
- —
Air-quality risk No data
- Unhealthy air days now
- —
- Unhealthy air days in 30 yrs
- —
Risk factors via First Street. Map © Google.
Why this score? — see what drove the C- grade
The composite is a weighted blend of 9 inputs, each scored 0–100. Each bar is that input's sub-score; the figure is the points it added to the 100-point composite (weight × sub-score).
- Cash flow +18.1/30.0
- ARV discount +7.3/15.0
- Appreciation +6.7/10.0
- DSCR +5.7/10.0
- 1% rule +4.9/10.0
- Schools +4.3/10.0
- Livability +2.9/5.0
- Rent growth +2.5/5.0
- Condition / age +2.5/5.0
$1,795,000
🖨 Deal sheet (PDF) 📄 Offer letter ✓ Due diligence
Listing remarks MLS
Modern Design Meets Coastal Living Welcome to your brand-new custom build in East Marion-crafted with an eye for detail and built for everyday luxury. This 4-bedroom, 3.5-bath home, complete with a spacious primary en-suite, balances timeless design with modern conveniences in a coveted beach community. Step inside to soaring ceilings, red oak select flooring, and Allwood custom cabinetry anchored by sleek quartz countertops. The kitchen is a chef's dream, featuring a Galiano Moena 36" gas range, double electric wall ovens, and a 24" wine cooler-because hey, why not! Light-filled spaces flow seamlessly to the outdoors, where a custom 18x36 Gunite saltwater pool (heated, of course) promises endless summers. Porcelain stone pavers and a generous patio set the stage for entertaining or unwinding after a swim. Additional highlights include cedar shake siding with a metal and asphalt roof, and a fully finished basement offering flexible space for media, fitness, or guests. It's not just a house-it's a backdrop for life at the beach. The right blend of craftsmanship, convenience, and coastal attitude. Could be you!
Key facts
- Quartz countertops
- Custom build
- 0.24 acre lot
Tags
Neighborhood map
What this means for you Summary
Snapshot
- This is a 4-bed/3.5-bath land listed at $1.79M.
Deal economics
- At list price, monthly cash flow is $2k ($19k/yr) — positive.
- The deal already cash-flows at list — no discount required.
- To meet the 1% rule (rent ≥ 1% of price), the offer needs to be $1.77M (1.4% below list).
- Recommended offer: $1.58M (12.0% below list) — sets the bar for market timing.
Location & tenants
- Location reads 58/100 on livability (#1,051 in NY) — a working-class tenant base; expect higher turnover. Strengths: crime A+, employment A+, health & safety A; Watch: housing C-, amenities F, commute F.
- Oysterponds Union Free School District (rural): math 30% / reading 60% proficiency, ranked #506 of 755 in NY (top 67%) — families likely to look elsewhere, expect single-tenant / working-renter base with shorter leases; only 4% free/reduced lunch — higher-income household profile.
- Zoned schools: Oysterponds Elementary School (math 54% / reading 64%, grade B-, #745 of 2,108 statewide, top 39%, 80 students, 0% FRL) — zoned schools at 0% FRL track the district average.
- Zoned-school proficiency averages 60% at this address vs 45% district-wide (+14 pts) — the actual schools serving this property are materially stronger than the Oysterponds Union Free School District average implies; a family-tenant draw the district grade alone would hide.
- Market conditions: 19 active listings in the ZIP; 9 comparable units currently listed for rent nearby; rentals lingering (median 45d on market — plan ~5-8 weeks vacancy on turnover, expect pricing pressure); 89% of comp listings sitting > 30 days — soft ceiling on asking rent; 1,366 units permitted in Suffolk County in 2024 (216 in 5+ unit buildings).
Forward outlook
- In year one you build about $75k of equity ($12k loan paydown + $62k appreciation (3.5% local appreciation)).
- Suffolk County population projected to shrink 5% by 2050 — rents likely to lag national; underwrite the cash flow, not the appreciation.
- At projected returns (3.5% appreciation + 3.0% rent growth), your $503k cash investment doubles in ~5 years — after that, you're playing with house money.
- By year 2, paydown + projected appreciation supports a ~$121k cash-out refi (75% LTV) — recoverable capital for the next deal without selling this one.
Negotiation context
- It's been on market 289 days — a 12% lower offer ($1.58M) is reasonable based on typical stale-listing flexibility.
- 3 sale attempts since 2y ago; this cycle's ask has dropped $100k (5%) from the opening price — seller is motivated, your offer sets the floor, not the list.
- Current owner paid $350k; list at $1.79M implies a 413% gain — meaningful room to come down on a strong offer.
Questions for the listing agent
- It's been on market 289 days. Have you received any prior offers? Is the seller open to a 12% concession, seller financing, or rate buy-down credit?
- Why hasn't it sold? Are there any deal-killer items the seller is aware of (foundation, flood, title, zoning, code violations)?
- Is there a deadline driving the sale (1031 exchange, divorce, estate, relocation)? That informs how much negotiation room exists.
- Schools are D-rated, which usually means shorter tenancies and higher turnover. Who's the typical renter profile here, and what's been the actual vacancy rate?
- What's the average days-on-market for RENTAL listings here right now (not sales)? A rising rental-DOM trend means longer vacancies and softer asking-rent achievability than the comps imply.
- What's the recent tenant-quality profile in this submarket — average credit score on applications, eviction rate, late-payment / NSF rate, and stable-employment percentage? A property-management company in the area should have these aggregated.
- How much new for-sale + rental construction is in the pipeline within 1–3 miles? Heavy new supply typically softens prices + rents 12–24 months out; constrained supply supports both.
Investment metrics
- 1% rule
- 0.99% ✗
- Cap rate
- 7.35%
- Cash-on-cash
- 3.77%
- DSCR
- 1.17
- GRM
- 8.5
CMA / ARV
- ARV (median comp)
- $1,788,663
- List price
- $1,795,000
- Delta
- 0.35%
- Verdict
- FAIR
- Comps
- 19 within 1.0 mi
Projected returns pro-forma
3.47% appreciation · 3.0% rent growth · sell at horizon
- IRR
- 12.3%
- Equity multiple
- 1.72×
- Total profit
- $362,125
- Equity at exit
- $855,022
- IRR
- 14.0%
- Equity multiple
- 3.18×
- Total profit
- $1,094,103
- Equity at exit
- $1,356,218
Cash invested: $502,600 (down + closing). Projections, not guarantees.
Landlord ↔ Tenant lean methodology
- Overall (STATE)
- 15 Strongly Tenant-Friendly
- State New York
- 15 Strongly Tenant-Friendly · D+10
- County
- — inherits STATE
- City
- — inherits STATE
ZIP-level market 11939
- Home prices YoY
- 1.2%
- Active inventory
- 19
- Price-to-rent
- 8.5×
Monthly cashflow live
- Estimated rent
- $17,701 high interval (Pro) →
- Mortgage (P&I)
- −$9,413
- Tax est. 1.5%
- −$2,244 /mo · $26,925/yr
- Insurance
- −$748
- HOA
- −$0
- Vacancy / Maint / Mgmt
- −$3,717
- Net cashflow
- $1,579
Break-even live
Sensitivity live
| Price | -10% $2,820 | -5% $2,200 | +0% $1,579 | +5% $959 | +10% $339 |
|---|---|---|---|---|---|
| Rent | -10% $181 | -5% $880 | +0% $1,579 | +5% $2,279 | +10% $2,978 |
| Rate | -1.0pp $2,483 | -0.5pp $2,036 | base $1,579 | +0.5pp $1,114 | +1.0pp $641 |
UW: 25.0% down · 7.5% · 30yr · 1.5% tax · 5.0% vac · 8.0% maint · 8.0% mgmt
Financing live
Cash to close
- Down payment
- $448,750
- Closing costs
- $53,850
- Reserves months
- —
- Total cash needed
- —
Loan-product check · same deal, 3 products live
Conventional
25% down · 7.5% · 30yr
- Down + closing
- —
- Monthly P&I
- —
- Monthly cashflow
- —
- DSCR
- —
- Eligible?
- —
Personal DTI + credit; lowest rate.
DSCR
20% down · 8.5% · 30yr
- Down + closing
- —
- Monthly P&I
- —
- Monthly cashflow
- —
- DSCR
- —
- Eligible?
- —
No personal income docs; deal must DSCR.
Hard money
10% down · 12.0% · 12mo
- Down + closing
- —
- Monthly P&I
- —
- Monthly cashflow
- —
- DSCR
- —
- Eligible?
- —
Short-term bridge; refi at stabilization.
Rent comps 9 comps
| Address | Beds | Baths | Sqft | Rent | $/sqft | DOM | Units | Dist |
|---|---|---|---|---|---|---|---|---|
| 165 Marine Pl Greenport, NY | 4.0 | 4.5 | 3800 | $20,000 | $5.26 | 45d | 1 | 0.42mi |
| 580 South Ln East Marion, NY | 3.0 | 2.5 | 2000 | $20,000 | $10.00 | 20d | 1 | 0.42mi |
| 525 Rocky Point Rd East Marion, NY | 3.0 | 3.0 | 3964 | $6,000 | $1.51 | 45d | 1 | 0.61mi |
| 580 Stars Rd East Marion, NY | 4.0 | 3.5 | 2700 | $35,000 | $12.96 | 45d | 1 | 0.85mi |
| 11003 Main Rd East Marion, NY | 3.0 | 2.0 | 3000 | $15,000 | $5.00 | 45d | 1 | 0.96mi |
| 11930 Main Rd East Marion, NY | 4.0 | 2.0 | 2200 | $3,500 | $1.59 | 45d | 1 | 0.98mi |
| 3045 Rocky Point Rd East Marion, NY | 3.0 | 2.0 | 2025 | $12,000 | $5.93 | 45d | 1 | 1.04mi |
| 1745 Stars Rd East Marion, NY | 4.0 | 3.5 | 4000 | $10,000 | $2.50 | 45d | 1 | 1.04mi |
| 3600 Rocky Point Rd East Marion, NY | 3.0 | 2.5 | 3000 | $16,000 | $5.33 | 45d | 1 | 1.16mi |
Listing history 24 events
-
2026-06-21days on market $1,795,000 Active 289 DOM
-
2026-06-21days on market $1,795,000 Active 288 DOM
-
2026-06-18days on market $1,795,000 Active 286 DOM
-
2026-06-17days on market $1,795,000 Active 285 DOM
-
2026-06-16days on market $1,795,000 Active 284 DOM
-
2026-06-15days on market $1,795,000 Active 283 DOM
-
2026-06-13days on market $1,795,000 Active 281 DOM
-
2026-06-12days on market $1,795,000 Active 280 DOM
-
2026-06-09days on market $1,795,000 Active 277 DOM
-
2026-06-08days on market $1,795,000 Active 276 DOM
-
2026-06-07days on market $1,795,000 Active 275 DOM
-
2026-06-07days on market $1,795,000 Active 274 DOM
-
2026-06-04days on market $1,795,000 Active 271 DOM
-
2026-06-02days on market $1,795,000 Active 270 DOM
-
2026-06-01days on market $1,795,000 Active 269 DOM
-
2026-05-31days on market $1,795,000 Active 268 DOM
-
2026-05-08price $1,795,000 1136-char remark
Show marketing remark (1136 chars)
Modern Design Meets Coastal Living Welcome to your brand-new custom build in East Marion-crafted with an eye for detail and built for everyday luxury. This 4-bedroom, 3.5-bath home, complete with a spacious primary en-suite, balances timeless design with modern conveniences in a coveted beach community. Step inside to soaring ceilings, red oak select flooring, and Allwood custom cabinetry anchored by sleek quartz countertops. The kitchen is a chef's dream, featuring a Galiano Moena 36" gas range, double electric wall ovens, and a 24" wine cooler-because hey, why not! Light-filled spaces flow seamlessly to the outdoors, where a custom 18x36 Gunite saltwater pool (heated, of course) promises endless summers. Porcelain stone pavers and a generous patio set the stage for entertaining or unwinding after a swim. Additional highlights include cedar shake siding with a metal and asphalt roof, and a fully finished basement offering flexible space for media, fitness, or guests. It's not just a house-it's a backdrop for life at the beach. The right blend of craftsmanship, convenience, and coastal attitude. Could be you!
-
2025-09-05$1,895,000 Active 1136-char remark
Show marketing remark (1136 chars)
Modern Design Meets Coastal Living Welcome to your brand-new custom build in East Marion-crafted with an eye for detail and built for everyday luxury. This 4-bedroom, 3.5-bath home, complete with a spacious primary en-suite, balances timeless design with modern conveniences in a coveted beach community. Step inside to soaring ceilings, red oak select flooring, and Allwood custom cabinetry anchored by sleek quartz countertops. The kitchen is a chef's dream, featuring a Galiano Moena 36" gas range, double electric wall ovens, and a 24" wine cooler-because hey, why not! Light-filled spaces flow seamlessly to the outdoors, where a custom 18x36 Gunite saltwater pool (heated, of course) promises endless summers. Porcelain stone pavers and a generous patio set the stage for entertaining or unwinding after a swim. Additional highlights include cedar shake siding with a metal and asphalt roof, and a fully finished basement offering flexible space for media, fitness, or guests. It's not just a house-it's a backdrop for life at the beach. The right blend of craftsmanship, convenience, and coastal attitude. Could be you!
-
2024-08-13soldstatus $350,000
-
2024-07-01soldstatus $350,000 Closed 233-char remark
Show marketing remark (233 chars)
Vacant Land on a Residential Block of Marion Manor Community. Nestled between the vineyards and the beachfront of Northfork. .24 Acre Lot of Land. Being Sold As Is. Preserved land behind. Low Taxes! Great Investment Opportunity!
-
2024-04-18status Pending 233-char remark
Show marketing remark (233 chars)
Vacant Land on a Residential Block of Marion Manor Community. Nestled between the vineyards and the beachfront of Northfork. .24 Acre Lot of Land. Being Sold As Is. Preserved land behind. Low Taxes! Great Investment Opportunity!
-
2024-04-13$299,999 Active 233-char remark
Show marketing remark (233 chars)
Vacant Land on a Residential Block of Marion Manor Community. Nestled between the vineyards and the beachfront of Northfork. .24 Acre Lot of Land. Being Sold As Is. Preserved land behind. Low Taxes! Great Investment Opportunity!
-
2024-04-03$299,999 Active
-
2000-12-07soldstatus $42,500
ⓘ Source: listings_history table (triggers on properties + properties_extension) + one-shot
backfill from property_details.listing_events for pre-trigger history.
Nearby sold comps map
Loading sold comps map…
Walkable amenities ~0.75 mi
Loading nearby amenities…
Taxation est. · year 1
- Rental income
- $212,417
- − Mortgage interest
- −$100,548
- − Property taxes
- −$26,925
- − Insurance
- −$8,975
- − Repairs & maintenance
- −$16,993
- − Management
- −$16,993
- − Depreciation
- −$52,218
- Taxable loss
- −$10,236
- Est. tax savings @ 24.0%
- +$2,457
- After-tax cash flow
- $21,408/yr
For passive investors: Depreciation is non-cash, so a rental often shows a tax loss while cash-flowing — sheltering income. Rental losses are passive: they offset passive income freely, and up to $25,000/yr can offset ordinary (W-2) income if you actively participate and your MAGI is under $100k (phasing out to $0 by $150k); unused losses carry forward. On sale, claimed depreciation is recaptured at up to 25%, and gains may owe capital-gains tax (a 1031 exchange can defer both). Figures are a year-1 estimate at your 24.0% rate — not tax advice; consult a CPA.
Schools (NCES district)
- District
- Oysterponds Union Free School District
- NCES district ID
- 3621930
- Math proficiency
- 30% ▼ -10.00%
- Reading proficiency
- 60% ▲ 20.00%
- Median HH income
- $71,948
- Composite
- 42.9/100
- National rank
- #6712
- State rank
- #506 of 755 in NY
Livability — East Marion
- Score
- 58/100
- State rank
- #1051
- US rank
- #20822
Category grades
Schools grade is shown separately in the Schools card above.
Census & demographics
- Census place
- East Marion, NY
- Population (ZIP)
- 1,741
Population outlook (Suffolk County) Hauer SSP2
- Today (2025)
- 1,505,262 people
- By 2030
- 1,498,318 · -0.5%
- By 2040
- 1,471,101 · -2.3%
- By 2050
- 1,424,848 · -5.3%
- By 2075
- 1,337,157 · -11.2%
- By 2100
- 1,217,720 · -19.1%
Race, ethnicity, and origin ACS 2023
- Neighborhood character
- Predominantly White (93%)
- Race & ethnicity
- White 93% Hispanic / Latino 4% Two or more races 2%
- Common ancestry
- Romanian 4% Scottish 1% Scotch-Irish 1%
- Foreign-born
- 9% · China
- Languages at home
- 89% English-only · Other Indo-European 7% Other Asian/Pacific 3% German/W. Germanic 1%
Political lean MEDSL · Suffolk
- 2024 margin
- Lean R (+10.0) · D 45.0% · R 55.0%
- 2008→2024 swing
- -16.0pp toward R · 2008: 6.0pp · 2024: -10.0pp
- All cycles
- 2024: R+10.0 2020: R+0.0 2016: R+8.2 2012: D+2.9 2008: D+6.0
Not yet ingested
- Civics
- —
Market trends
- HPI YoY
- ▲ 3.47%
- Current HPI
- 281.05
- Rent YoY
- —
- Metro
- —
- State GDP YoY
- ▲ 2.60%
- F500 in state
- 92
Industry mix (Fortune 500 HQ in NY)
| Industry | F500 HQs | Revenue |
|---|---|---|
| Financial Services | 10 | $950B |
|
||
| Consumer Goods | 9 | $162B |
|
||
| Insurance | 4 | $225B |
|
||
| Telecommunications | 2 | $144B |
|
||
| Pharmaceuticals | 2 | $112B |
|
||
| Media / Entertainment | 2 | $69B |
|
||
Price history
+4123.5% since first listed8 events — show timeline
- 2026-05-08 Price Changed $1,795,000 OneKey® MLS as Distributed by MLS Grid
- 2025-09-05 Listed $1,895,000 OneKey® MLS as Distributed by MLS Grid
- 2024-08-13 Sold (Public Records) $350,000 Public Records
- 2024-07-01 Sold (MLS) $350,000 OneKey® MLS as Distributed by MLS Grid
- 2024-04-18 Pending — OneKey® MLS as Distributed by MLS Grid
- 2024-04-13 Listed $299,999 OneKey® MLS as Distributed by MLS Grid
- 2024-04-03 Listed $299,999 OneKey® MLS as Distributed by MLS Grid
- 2000-12-07 Sold (Public Records) $42,500 Public Records
Property tax history
+0.9%/yrLatest (2025): $549 · +0.0% YoY. Source: county tax records.
Cash-flow waterfall
monthlySold comps — $/sqft
last 12 mo · ≤1 miLoading sold comps…