 Duplex
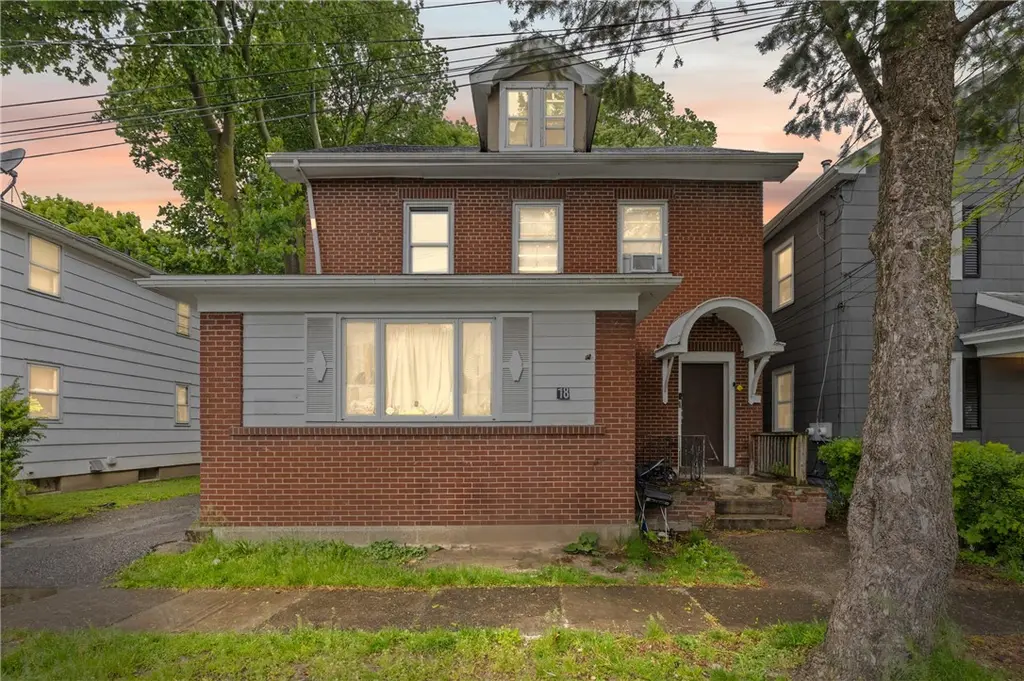
18 Bauer St · Rochester, NY
Flood risk 1/10 · Minimal
- FEMA flood zone
- X (unshaded)
- Chance of flooding over 30 yrs
- 0.0%
- Est. flood insurance / yr
- $473 – $860
Fire risk 1/10 · Minimal
- Est. fire insurance / yr
- $691 – $1,283
Heat risk 2/10 · Minimal
- Hot days now (above 95°F)
- 7 days/yr
- Hot days in 30 yrs
- 15 days/yr
Wind risk 1/10 · Minimal
- Chance of severe wind over 30 yrs
- —
Air-quality risk 2/10 · Minimal
- Unhealthy air days now
- 1 days/yr
- Unhealthy air days in 30 yrs
- 2 days/yr
Risk factors via First Street. Map © Google.
Why this score? — see what drove the C+ grade
The composite is a weighted blend of 9 inputs, each scored 0–100. Each bar is that input's sub-score; the figure is the points it added to the 100-point composite (weight × sub-score).
- Cash flow +30.0/30.0
- 1% rule +10.0/10.0
- DSCR +10.0/10.0
- Rent growth +4.1/5.0
- Livability +3.8/5.0
- Condition / age +2.5/5.0
- Schools +1.9/10.0
- ARV discount +0.0/15.0
- Appreciation +0.0/10.0
$189,900
🖨 Deal sheet (PDF) 📄 Offer letter ✓ Due diligence
Multi-family units
County records classify this as Multi-Family (2-4 Unit). Listing-text estimate: 2 units. confirmed
Listing remarks MLS
Opportunity knocks with this great investment opportunity!! This multi-family home features a 2 story 3 bedroom 1 bath unit as well as a 1 bedroom 1 bath unit bringing in $1325/mo gross rents with separate utilities! There is a workshop in the back that can be rehabbed for additional rental income as well.
Key facts
- Two family home
- Thermopane windows
- Natural wood trim
Tags
Property features AI
Finance
- Financial info: Operating expenses include insurance, maintenance, and trash
Exterior
- Parking: Paved parking with two or more spaces; 2-car garage
- Utilities: Cable available; High-speed internet available; Public water connected; Sewer connected
- Home design: 2-story building; Resale property; Brick and stucco construction; Asphalt roof
- Construction: Brick and stucco construction; Asphalt roof; Existing building
- Exterior features: Near public transit; Rectangular residential lot; City street frontage
Interior
- Kitchen: Gas water heater
- Bedrooms: Property contains 2 units (multi-family)
- Flooring: Carpet; Hardwood; Luxury vinyl; Varies
- Bathrooms: 3 full bathrooms (total)
- Heating & cooling: Gas heating; Baseboard heating; Forced air
- Interior features: Full basement
- Laundry & utility: Tenants pay all utilities
Neighborhood map
What this means for you Summary
Snapshot
- This is a 1×4bd/1.5ba + 1×3bd/1.5ba units multifamily listed at $190k.
Deal economics
- At list price, monthly cash flow is $1k ($15k/yr) — positive. Per door: $635/mo.
- The deal already cash-flows at list — no discount required.
- Meets the 1% rule at list price ($3k rent vs $190k).
- Cap rate 14.3% vs local median 9.3% in Rochester — top-decile yield for the area; either an underpriced asset or a hidden risk that comps aren't pricing in. Stress-test before assuming the spread holds.
Location & tenants
- Location reads 76/100 on livability (#222 in NY, #3,482 nationally) — a middle-class / working-renter tenant base. Strengths: commute A+, cost of living A+, housing A+; Watch: crime F, employment F.
- Rochester City School District (urban): math 21% / reading 26% proficiency, ranked #589 of 590 in NY (top 100%) — low school quality limits family demand, transient renter base, plan for 1-2y turnover; 82% free/reduced lunch — lower-income household profile, screen leases tightly.
- Zoned schools: Joseph C Wilson Foundation Academy (math 8% / reading 17%, grade F, #2,049 of 2,108 statewide, top 98%, 404 students, 91% FRL); East Lower School (math 2% / reading 22%, grade F, #715 of 729 statewide, top 98%, 304 students, 86% FRL); Edison Career And Technology High School (math 44% / reading 50%, grade D-, #1,007 of 1,100 statewide, top 93%, 1,233 students, 91% FRL).
- Market conditions: Rents rising fast (+6.3%/yr); 125 active listings in the ZIP; 5 comparable units currently listed for rent nearby; rentals leasing fast (median 13d on market — plan ~1-2 weeks tenant-placement turnaround); 40% of comp listings sitting > 30 days — soft ceiling on asking rent; 1,169 units permitted in Monroe County in 2024 (591 in 5+ unit buildings).
- At $3,081/mo this rent would consume 66% of the median local household income ($56k/yr) (locally 986% of renters already pay >50% of income on rent) — very limited rent-growth headroom before tenants either downsize or default.
Forward outlook
- Local home prices are declining (-3.0%/yr); year-one equity from $1k of loan paydown is wiped out by about $6k of value loss. Plan a longer hold.
- Monroe County population projected to shrink 6% by 2050 — rents likely to lag national; underwrite the cash flow, not the appreciation.
- At projected returns (-3.0% appreciation + 6.3% rent growth), your $53k cash investment doubles in ~4 years — after that, you're playing with house money.
Negotiation context
- Only 9 days on market — expect competitive offers; lowballing is unlikely to land.
- 6 sale attempts since 12y ago with the ask held roughly flat each time — persistent listings suggest the price (not the market) is what's stuck; bring a comps-based counter.
- Current owner paid $115k; list at $190k implies a 65% gain — meaningful room to come down on a strong offer.
Risks & watch-outs
- Watch-outs: built in 1929 — expect roof / HVAC / electrical / plumbing capex.
Questions for the listing agent
- Can we see the unit-by-unit rent roll, current vacancy, and any below-market leases? What's the average tenancy length?
- What capital expenditures (roof, boiler, parking lot, exteriors) have been made in the last 5 years, and what's planned in the next 2?
- Built in 1929 — when were the roof, HVAC, electrical panel, plumbing, and water heater last replaced?
- Is there a deadline driving the sale (1031 exchange, divorce, estate, relocation)? That informs how much negotiation room exists.
- Schools are D-rated, which usually means shorter tenancies and higher turnover. Who's the typical renter profile here, and what's been the actual vacancy rate?
- Crime grade is F in this area — have there been break-ins, vandalism, or insurance claims at this property in the last 3 years? What carrier currently insures it and at what premium?
- What's the average days-on-market for RENTAL listings here right now (not sales)? A rising rental-DOM trend means longer vacancies and softer asking-rent achievability than the comps imply.
- What's the recent tenant-quality profile in this submarket — average credit score on applications, eviction rate, late-payment / NSF rate, and stable-employment percentage? A property-management company in the area should have these aggregated.
- How much new apartment / multifamily construction is in the pipeline within 1–3 miles? Heavy new supply (>2% of stock underway) typically softens rents 12–24 months out; light construction supports rent growth.
Investment metrics
- 1% rule
- 1.62% ✓
- Cap rate
- 14.32%
- Cash-on-cash
- 28.66%
- DSCR
- 2.28
- GRM
- 5.1
CMA / ARV
- ARV (on-the-fly)
- $140,000
- Comps found
- 8
Show comp detail 8 sales within ~0.75 mi
| Address | Dist | Beds/Ba | Sqft | Sold | Price | $/sf | Match |
|---|---|---|---|---|---|---|---|
| 524-526 Dewey Ave | 0.19mi | 5/2.0 (+1) | 2,750 (-2%) | 8mo | $62,000 | $23 | 74 |
| 122 Ambrose St | 0.67mi | 5/3.0 (+1) | 2,720 (-3%) | 2mo | $180,000 | $66 | 56 |
| 127 Emerson St | 0.40mi | 5/2.0 (+1) | 2,577 (-8%) | 21mo | $102,000 | $40 | 44 |
| 413 Lexington Ave | 0.51mi | 5/4.0 (+1) | 2,588 (-8%) | 14mo | $130,000 | $50 | 41 |
| 452 Glenwood Ave | 0.39mi | 5/2.0 (+1) | 2,466 (-12%) | 20mo | $137,000 | $56 | 39 |
| 463-463.5 Lyell Ave | 0.50mi | 5/4.0 (+1) | 3,126 (+12%) | 17mo | $100,000 | $32 | 32 |
| 140 Masseth St | 0.69mi | 5/3.0 (+1) | 3,084 (+10%) | 17mo | $155,000 | $50 | 30 |
| 541-543 Ames St #543 | 0.75mi | 4/2.0 | 2,426 (-13%) | 16mo | $50,000 | $21 | 27 |
Match score weights: distance 35% · size 25% · config 20% · recency 20%. Top-matched comps best support the ARV.
Projected returns pro-forma
-3.0% appreciation · 6.28% rent growth · sell at horizon
- IRR
- 26.4%
- Equity multiple
- 2.14×
- Total profit
- $60,566
- Equity at exit
- $28,315
- IRR
- 35.9%
- Equity multiple
- 4.81×
- Total profit
- $202,808
- Equity at exit
- $16,419
Cash invested: $53,172 (down + closing). Projections, not guarantees.
Landlord ↔ Tenant lean methodology
- Overall (STATE)
- 15 Strongly Tenant-Friendly
- State New York
- 15 Strongly Tenant-Friendly · D+10
- County
- — inherits STATE
- City
- — inherits STATE
ZIP-level market 14606
- Home prices YoY
- -17.9%
- Rents YoY
- 6.3%
- Active inventory
- 125
- Price-to-rent
- 9.8×
Monthly cashflow live
- Estimated rent
- $3,081 high interval (Pro) →
- Mortgage (P&I)
- −$996
- Tax from tax record
- −$89 /mo · $1,069/yr
- Insurance
- −$79
- HOA
- −$0
- Vacancy / Maint / Mgmt
- −$647
- Net cashflow
- $1,270
Break-even live
Sensitivity live
| Price | -10% $1,377 | -5% $1,324 | +0% $1,270 | +5% $1,216 | +10% $1,162 |
|---|---|---|---|---|---|
| Rent | -10% $1,027 | -5% $1,148 | +0% $1,270 | +5% $1,392 | +10% $1,513 |
| Rate | -1.0pp $1,366 | -0.5pp $1,318 | base $1,270 | +0.5pp $1,221 | +1.0pp $1,171 |
2-unit breakdown (identical units grouped — click to expand)
| Units | Beds | Baths | Est. rent |
|---|---|---|---|
| 1× unit | 4 | 1.5 | $1,620 |
| 1× unit | 3 | 1.5 | $1,461 |
| Total (2 units) | $3,081 | ||
UW: 25.0% down · 7.5% · 30yr · 1.5% tax · 5.0% vac · 8.0% maint · 8.0% mgmt
Financing live
Cash to close
- Down payment
- $47,475
- Closing costs
- $5,697
- Reserves months
- —
- Total cash needed
- —
Loan-product check · same deal, 3 products live
Conventional
25% down · 7.5% · 30yr
- Down + closing
- —
- Monthly P&I
- —
- Monthly cashflow
- —
- DSCR
- —
- Eligible?
- —
Personal DTI + credit; lowest rate.
DSCR
20% down · 8.5% · 30yr
- Down + closing
- —
- Monthly P&I
- —
- Monthly cashflow
- —
- DSCR
- —
- Eligible?
- —
No personal income docs; deal must DSCR.
Hard money
10% down · 12.0% · 12mo
- Down + closing
- —
- Monthly P&I
- —
- Monthly cashflow
- —
- DSCR
- —
- Eligible?
- —
Short-term bridge; refi at stabilization.
Rent comps 5 comps
| Address | Beds | Baths | Sqft | Rent | $/sqft | DOM | Units | Dist |
|---|---|---|---|---|---|---|---|---|
| 327 Glenwood Ave Rochester, NY | 3.0 | 1.0 | 2012 | $1,690 | $0.84 | 5d | 1 | 0.31mi |
| 98 Pierpont St Rochester, NY | 3.0 | 1.0 | 1973 | $1,295 | $0.66 | 45d | 1 | 0.66mi |
| 649 Jay St Rochester, NY | 5.0 | 2.0 | 2144 | $2,000 | $0.93 | 5d | 1 | 0.89mi |
| 235 Flower City Park Rochester, NY | 3.0 | 1.0 | 2000 | $1,360 | $0.68 | 45d | 1 | 1.48mi |
| 768 Flower City Park Rochester, NY | 3.0 | 1.0 | 1995 | $1,995 | $1.00 | 12d | 1 | 1.48mi |
Listing history 20 events
-
2026-06-05days on market $189,900 Active 9 DOM
-
2026-06-03days on market $189,900 Active 8 DOM
-
2026-06-03days on market $189,900 Active 7 DOM
-
2026-06-01days on market $189,900 Active 6 DOM
-
2026-05-31days on market $189,900 Active 5 DOM
-
2026-05-26$189,900 Active
-
2025-05-12soldstatus $115,000
-
2021-03-03soldstatus $48,000 Closed Sale or Rented 308-char remark
Show marketing remark (308 chars)
Opportunity knocks with this great investment opportunity!! This multi-family home features a 2 story 3 bedroom 1 bath unit as well as a 1 bedroom 1 bath unit bringing in $1325/mo gross rents with separate utilities! There is a workshop in the back that can be rehabbed for additional rental income as well.
-
2021-03-03soldstatus $48,000
Show marketing remark (308 chars)
Opportunity knocks with this great investment opportunity!! This multi-family home features a 2 story 3 bedroom 1 bath unit as well as a 1 bedroom 1 bath unit bringing in $1325/mo gross rents with separate utilities! There is a workshop in the back that can be rehabbed for additional rental income as well.
-
2021-01-04status Under Contract- Do Not Show 308-char remark
Show marketing remark (308 chars)
Opportunity knocks with this great investment opportunity!! This multi-family home features a 2 story 3 bedroom 1 bath unit as well as a 1 bedroom 1 bath unit bringing in $1325/mo gross rents with separate utilities! There is a workshop in the back that can be rehabbed for additional rental income as well.
-
2020-12-28$39,777 Active 308-char remark
Show marketing remark (308 chars)
Opportunity knocks with this great investment opportunity!! This multi-family home features a 2 story 3 bedroom 1 bath unit as well as a 1 bedroom 1 bath unit bringing in $1325/mo gross rents with separate utilities! There is a workshop in the back that can be rehabbed for additional rental income as well.
-
2016-01-02historical
-
2015-10-01$44,900 Active
-
2015-09-17historical
-
2015-06-16$49,900 Active
-
2015-02-02historical
-
2015-01-05$49,900
-
2015-01-05historical
-
2014-09-04$49,900
-
2006-11-16soldstatus $46,000
ⓘ Source: listings_history table (triggers on properties + properties_extension) + one-shot
backfill from property_details.listing_events for pre-trigger history.
Tax reassessment forecast NY · Partial reset (capped growth)
- Current annual tax
- $1,069 · $89/mo
- Projected year-2 tax
- $2,139 · $178/mo
- Expected delta
- +$1,070/yr (+$89/mo · 100.1%)
ⓘ Screening estimate from a state-policy table — verify with the county assessor before closing.
Climate risk First Street
- Flood 1/10 Low FEMA zone X (unshaded) · 0% chance over 30 yrs
- Wildfire 1/10 Low
- Heat 2/10 Low 7 d/yr ≥95°F today · 15 d/yr by 30 yrs out
- Wind 1/10 Low
- Air quality 2/10 Low 1 unhealthy d/yr today · 2 by 30 yrs out
Nearby sold comps map
Loading sold comps map…
Walkable amenities ~0.75 mi
Loading nearby amenities…
Taxation est. · year 1
- Rental income
- $36,972
- − Mortgage interest
- −$10,637
- − Property taxes
- −$1,069
- − Insurance
- −$950
- − Repairs & maintenance
- −$2,958
- − Management
- −$2,958
- − Depreciation
- −$5,524
- Taxable income
- $12,876
- Est. tax owed @ 24.0%
- −$3,090
- After-tax cash flow
- $12,149/yr
For passive investors: Depreciation is non-cash, so a rental often shows a tax loss while cash-flowing — sheltering income. Rental losses are passive: they offset passive income freely, and up to $25,000/yr can offset ordinary (W-2) income if you actively participate and your MAGI is under $100k (phasing out to $0 by $150k); unused losses carry forward. On sale, claimed depreciation is recaptured at up to 25%, and gains may owe capital-gains tax (a 1031 exchange can defer both). Figures are a year-1 estimate at your 24.0% rate — not tax advice; consult a CPA.
Schools (NCES district)
- District
- Rochester City School District
- NCES district ID
- 3624750
- Math proficiency
- 21% ▬ 0.00%
- Reading proficiency
- 26% ▲ 4.00%
- Median HH income
- $30,923
- Composite
- 18.98/100
- National rank
- #8850
- State rank
- #589 of 590 in NY
Livability — Rochester
- Score
- 76/100
- State rank
- #222
- US rank
- #3482
Category grades
Schools grade is shown separately in the Schools card above.
Census & demographics
- Census place
- Rochester, NY
- County
- Monroe County · 674,131 people
- City population
- 432,803
- Metro
- Rochester, NY
- Population (ZIP)
- 25,538
- Household income
- $55,807
- Rent vs Own
- Severe rent burden
- 986.0
Population outlook (Monroe County) Hauer SSP2
- Today (2025)
- 759,460 people
- By 2030
- 757,154 · -0.3%
- By 2040
- 740,644 · -2.5%
- By 2050
- 714,443 · -5.9%
- By 2075
- 645,883 · -15.0%
- By 2100
- 547,084 · -28.0%
Race, ethnicity, and origin ACS 2023
- Neighborhood character
- Diverse neighborhood (Simpson 0.64)
- Race & ethnicity
- White 51% Black 26% Hispanic / Latino 17% Two or more races 8% Asian 3%
- Hispanic origin (detail)
- Puerto Rican 12% Cuban 2%
- Common ancestry
- Romanian 3% Lithuanian 1% Iranian 1%
- Foreign-born
- 10% · Canada, Vietnam, Philippines
- Languages at home
- 79% English-only · Spanish 12% Other Indo-European 3% Other Asian/Pacific 2%
Political lean MEDSL · Monroe
- 2024 margin
- D (+19.1) · D 59.5% · R 40.5%
- 2008→2024 swing
- +1.4pp toward D · 2008: 17.7pp · 2024: 19.1pp
- All cycles
- 2024: D+19.1 2020: D+21.0 2016: D+14.1 2012: D+17.4 2008: D+17.7
Not yet ingested
- Civics
- —
Market trends
- HPI YoY
- ▼ -62.59%
- Current HPI
- 287.6868
- Rent YoY
- ▲ 6.28%
- Metro
- Rochester, NY
- State GDP YoY
- ▲ 2.60%
- F500 in state
- 92
Industry mix (Fortune 500 HQ in NY)
| Industry | F500 HQs | Revenue |
|---|---|---|
| Financial Services | 10 | $950B |
|
||
| Consumer Goods | 9 | $162B |
|
||
| Insurance | 4 | $225B |
|
||
| Telecommunications | 2 | $144B |
|
||
| Pharmaceuticals | 2 | $112B |
|
||
| Media / Entertainment | 2 | $69B |
|
||
Price history
+312.8% since first listed15 events — show timeline
- 2026-05-26 Listed $189,900 UNYREIS
- 2025-05-12 Sold (Public Records) $115,000 Public Records
- 2021-03-03 Sold (Public Records) $48,000 Public Records
- 2021-03-03 Sold (MLS) $48,000 UNYREIS
- 2021-01-04 Pending — UNYREIS
- 2020-12-28 Listed $39,777 UNYREIS
- 2016-01-02 Listing Removed — UNYREIS
- 2015-10-01 Listed $44,900 UNYREIS
- 2015-09-17 Listing Removed — UNYREIS
- 2015-06-16 Listed $49,900 UNYREIS
- 2015-02-02 Listing Removed — UNYREIS
- 2015-01-05 Listing Removed — UNYREIS
- 2015-01-05 Listed $49,900 UNYREIS
- 2014-09-04 Listed $49,900 UNYREIS
- 2006-11-16 Sold (Public Records) $46,000 Public Records
Property tax history
+2.0%/yrLatest (2025): $1,069 · +0.0% YoY. Source: county tax records.
Cash-flow waterfall
monthlySold comps — $/sqft
last 12 mo · ≤1 miLoading sold comps…