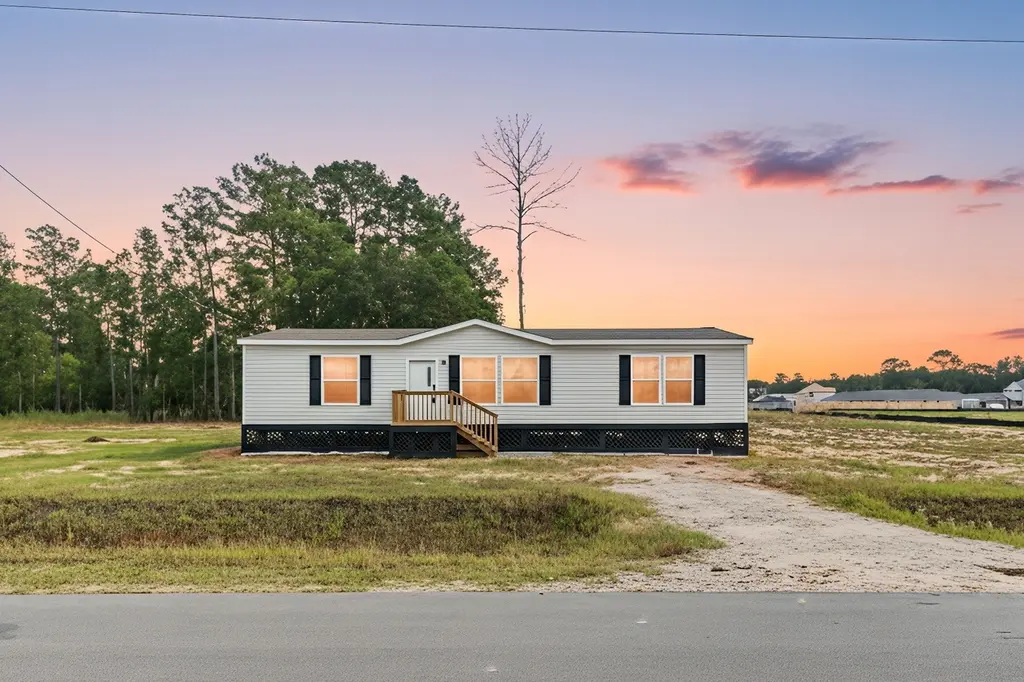
12251 Truchard Dr · Grangerland, TX
Flood risk No data
- FEMA flood zone
- —
- Chance of flooding over 30 yrs
- —
- Est. flood insurance / yr
- —
Fire risk No data
- Est. fire insurance / yr
- —
Heat risk No data
- Hot days now (above threshold)
- —
- Hot days in 30 yrs
- —
Wind risk No data
- Chance of severe wind over 30 yrs
- —
Air-quality risk No data
- Unhealthy air days now
- —
- Unhealthy air days in 30 yrs
- —
Risk factors via First Street. Map © Google.
Why this score? — see what drove the D grade
The composite is a weighted blend of 9 inputs, each scored 0–100. Each bar is that input's sub-score; the figure is the points it added to the 100-point composite (weight × sub-score).
- Cash flow +17.2/30.0
- DSCR +5.3/10.0
- Schools +5.1/10.0
- Condition / age +4.0/5.0
- 1% rule +3.6/10.0
- Rent growth +2.5/5.0
- Livability +2.5/5.0
- ARV discount +2.2/15.0
- Appreciation +0.0/10.0
$195,000
🖨 Deal sheet (PDF) 📄 Offer letter ✓ Due diligence
Listing remarks MLS
Step into charm and comfort with this beautifully updated home, thoughtfully designed for both style and functionality. A warm welcome begins at the newly added 6x6’ front porch and continues through the inviting 6x12’ back deck, perfect for entertaining or relaxing outdoors. Inside, you’ll find fresh paint throughout, a fully upgraded kitchen featuring newly repainted cabinets, modern cabinet hardware, and a butcher block island that adds both character and utility. The kitchen also boasts upgraded appliances, rebuilt pantry, and upgraded door hardware throughout the home. The living room showcases an elegant farmhouse beam, blending rustic charm with modern updates. Additional exterior upgrades include lattice skirting and a Blink camera doorbell for extra peace of mind. This home is truly move-in ready—offering the perfect balance of comfort, modern upgrades, and thoughtful details inside and out.
Key facts
- Inviting back deck
- Rebuilt pantry
- Butcher block island
Tags
Neighborhood map
What this means for you Summary
Snapshot
- This is a 3-bed/2.0-bath single-family listed at $195k. Condition is rated good.
Deal economics
- At list price, monthly cash flow is $138 ($2k/yr) — positive.
- The deal already cash-flows at list — no discount required.
- To meet the 1% rule (rent ≥ 1% of price), the offer needs to be $169k (13.6% below list).
- Recommended offer: $169k (13.6% below list) — sets the bar for 1% rule.
- Cap rate 7.1% vs local median 5.1% in Grangerland — top-decile yield for the area; either an underpriced asset or a hidden risk that comps aren't pricing in. Stress-test before assuming the spread holds.
Location & tenants
- Location reads: area grade D — affects rentability + tenant quality, not the cash-flow math above.
- Conroe ISD (other): math 57% / reading 57% proficiency, ranked #69 of 826 in TX (top 8%) — acceptable for families but not a draw, mixed tenant base, ~2y average lease.
- Zoned schools: Creighton El (math 31% / reading 27%, grade F, #2,668 of 4,322 statewide, top 63%, 940 students, 92% FRL); Moorhead J H (math 35% / reading 42%, grade F, #704 of 1,662 statewide, top 43%, 1,391 students, 82% FRL); Conroe H S (math 32% / reading 51%, grade F, #767 of 1,632 statewide, top 47%, 4,915 students, 61% FRL) — zoned schools average 78% FRL vs 34% district-wide (44 pts higher); higher-poverty schools than district average — tighter screening recommended.
- Zoned-school proficiency averages 36% at this address vs 57% district-wide (-21 pts) — the specific schools serving this property underperform the Conroe ISD average; the district grade overstates school quality for this exact location.
- Market conditions: 416 active listings in the ZIP; solid renter incomes; 13,259 units permitted in Montgomery County in 2024 (1,402 in 5+ unit buildings).
Forward outlook
- Local home prices are declining (-3.0%/yr); year-one equity from $1k of loan paydown is wiped out by about $6k of value loss. Plan a longer hold.
- Montgomery County population projected at +65% by 2050 — long-run rental-demand tailwind backs the buy-and-hold thesis.
Negotiation context
- It's been on market 234 days — a 12% lower offer ($172k) is reasonable based on typical stale-listing flexibility.
- Current owner paid $62k; list at $195k implies a 212% gain — meaningful room to come down on a strong offer.
Questions for the listing agent
- It's been on market 234 days. Have you received any prior offers? Is the seller open to a 14% concession, seller financing, or rate buy-down credit?
- Why hasn't it sold? Are there any deal-killer items the seller is aware of (foundation, flood, title, zoning, code violations)?
- Is there a deadline driving the sale (1031 exchange, divorce, estate, relocation)? That informs how much negotiation room exists.
- The area grade is low — what's the realistic commute time and amenity access for the typical tenant pool here? Any planned neighborhood developments (good or bad) we should know about?
- What's the average days-on-market for RENTAL listings here right now (not sales)? A rising rental-DOM trend means longer vacancies and softer asking-rent achievability than the comps imply.
- What's the recent tenant-quality profile in this submarket — average credit score on applications, eviction rate, late-payment / NSF rate, and stable-employment percentage? A property-management company in the area should have these aggregated.
- How much new for-sale + rental construction is in the pipeline within 1–3 miles? Heavy new supply typically softens prices + rents 12–24 months out; constrained supply supports both.
Investment metrics
- 1% rule
- 0.86% ✗
- Cap rate
- 7.14%
- Cash-on-cash
- 3.03%
- DSCR
- 1.13
- GRM
- 9.6
CMA / ARV
- ARV (median comp)
- $174,440
- List price
- $195,000
- Delta
- 11.79%
- Verdict
- OVERPRICED
- Comps
- 2 within 1.0 mi
Show comp detail 12 sales within ~0.75 mi
| Address | Dist | Beds/Ba | Sqft | Sold | Price | $/sf | Match |
|---|---|---|---|---|---|---|---|
| 11762 Brinkburn Ct | 0.52mi | 3/2.0 | 1,522 (-2%) | 3mo | $253,990 | $167 | 70 |
| 18796 Loom Dr | 0.51mi | 4/2.0 (+1) | 1,600 (+3%) | 1mo | $245,990 | $154 | 66 |
| 11775 Brinkburn Ct | 0.53mi | 3/2.0 | 1,474 (-6%) | 0mo | $203,090 | $138 | 66 |
| 18764 Loom Dr | 0.51mi | 4/2.0 (+1) | 1,600 (+3%) | 2mo | $245,990 | $154 | 65 |
| 18753 Loom Dr | 0.53mi | 4/2.0 (+1) | 1,600 (+3%) | 2mo | $241,990 | $151 | 64 |
| 12070 Woodbrook Dr | 0.50mi | 4/2.0 (+1) | 1,667 (+7%) | 1mo | $264,990 | $159 | 59 |
| 12809 Naval Dr | 0.51mi | 3/2.0 | 1,402 (-10%) | 1mo | $231,990 | $165 | 58 |
| 18789 Loom Dr | 0.51mi | 3/2.0 | 1,402 (-10%) | 2mo | $230,990 | $165 | 57 |
| 18792 Loom Dr | 0.55mi | 3/2.0 | 1,402 (-10%) | 1mo | $231,990 | $165 | 56 |
| 11881 Brunel Dr | 0.53mi | 4/2.0 (+1) | 1,667 (+7%) | 3mo | $266,990 | $160 | 56 |
| 11769 Brinkburn Ct | 0.51mi | 4/2.0 (+1) | 1,707 (+9%) | 2mo | $266,990 | $156 | 54 |
| 18902 Kingham Woods Ct | 0.51mi | 4/2.0 (+1) | 1,707 (+9%) | 2mo | $268,990 | $158 | 54 |
Match score weights: distance 35% · size 25% · config 20% · recency 20%. Top-matched comps best support the ARV.
Projected returns pro-forma
-3.0% appreciation · 3.0% rent growth · sell at horizon
- IRR
- -11.6%
- Equity multiple
- 0.58×
- Total profit
- $-22,878
- Equity at exit
- $29,075
- IRR
- -2.4%
- Equity multiple
- 0.84×
- Total profit
- $-8,885
- Equity at exit
- $16,860
Cash invested: $54,600 (down + closing). Projections, not guarantees.
Landlord ↔ Tenant lean methodology
- Overall (STATE)
- 87 Strongly Landlord-Friendly
- State Texas
- 87 Strongly Landlord-Friendly · R+5
- County
- — inherits STATE
- City
- — inherits STATE
ZIP-level market 77306
- Home prices YoY
- -4.1%
- Active inventory
- 416
- Price-to-rent
- 9.6×
Monthly cashflow live
- Estimated rent
- $1,685 medium interval (Pro) →
- Mortgage (P&I)
- −$1,023
- Tax from tax record
- −$90 /mo · $1,074/yr
- Insurance
- −$81
- HOA
- −$0
- Vacancy / Maint / Mgmt
- −$354
- Net cashflow
- $138
Break-even live
Sensitivity live
| Price | -10% $248 | -5% $193 | +0% $138 | +5% $83 | +10% $28 |
|---|---|---|---|---|---|
| Rent | -10% $5 | -5% $71 | +0% $138 | +5% $205 | +10% $271 |
| Rate | -1.0pp $236 | -0.5pp $188 | base $138 | +0.5pp $87 | +1.0pp $36 |
UW: 25.0% down · 7.5% · 30yr · 1.5% tax · 5.0% vac · 8.0% maint · 8.0% mgmt
Financing live
Cash to close
- Down payment
- $48,750
- Closing costs
- $5,850
- Reserves months
- —
- Total cash needed
- —
Loan-product check · same deal, 3 products live
Conventional
25% down · 7.5% · 30yr
- Down + closing
- —
- Monthly P&I
- —
- Monthly cashflow
- —
- DSCR
- —
- Eligible?
- —
Personal DTI + credit; lowest rate.
DSCR
20% down · 8.5% · 30yr
- Down + closing
- —
- Monthly P&I
- —
- Monthly cashflow
- —
- DSCR
- —
- Eligible?
- —
No personal income docs; deal must DSCR.
Hard money
10% down · 12.0% · 12mo
- Down + closing
- —
- Monthly P&I
- —
- Monthly cashflow
- —
- DSCR
- —
- Eligible?
- —
Short-term bridge; refi at stabilization.
Listing history 18 events
-
2026-06-21days on market $195,000 Active 234 DOM
-
2026-06-18days on market $195,000 Active 231 DOM
-
2026-06-17days on market $195,000 Active 230 DOM
-
2026-06-16days on market $195,000 Active 229 DOM
-
2026-06-15days on market $195,000 Active 228 DOM
-
2026-06-13days on market $195,000 Active 226 DOM
-
2026-06-09days on market $195,000 Active 222 DOM
-
2026-06-08days on market $195,000 Active 221 DOM
-
2026-06-07days on market $195,000 Active 220 DOM
-
2026-06-04days on market $195,000 Active 217 DOM
-
2026-06-03days on market $195,000 Active 216 DOM
-
2026-06-02days on market $195,000 Active 215 DOM
-
2026-06-01days on market $195,000 Active 214 DOM
-
2026-05-31days on market $195,000 Active 213 DOM
-
2026-02-19price $195,000 937-char remark
Show marketing remark (937 chars)
Step into charm and comfort with this beautifully updated home, thoughtfully designed for both style and functionality. A warm welcome begins at the newly added 6x6’ front porch and continues through the inviting 6x12’ back deck, perfect for entertaining or relaxing outdoors. Inside, you’ll find fresh paint throughout, a fully upgraded kitchen featuring newly repainted cabinets, modern cabinet hardware, and a butcher block island that adds both character and utility. The kitchen also boasts upgraded appliances, rebuilt pantry, and upgraded door hardware throughout the home. The living room showcases an elegant farmhouse beam, blending rustic charm with modern updates. Additional exterior upgrades include lattice skirting and a Blink camera doorbell for extra peace of mind. This home is truly move-in ready—offering the perfect balance of comfort, modern upgrades, and thoughtful details inside and out.
-
2025-10-30$200,000 Active 937-char remark
Show marketing remark (937 chars)
Step into charm and comfort with this beautifully updated home, thoughtfully designed for both style and functionality. A warm welcome begins at the newly added 6x6’ front porch and continues through the inviting 6x12’ back deck, perfect for entertaining or relaxing outdoors. Inside, you’ll find fresh paint throughout, a fully upgraded kitchen featuring newly repainted cabinets, modern cabinet hardware, and a butcher block island that adds both character and utility. The kitchen also boasts upgraded appliances, rebuilt pantry, and upgraded door hardware throughout the home. The living room showcases an elegant farmhouse beam, blending rustic charm with modern updates. Additional exterior upgrades include lattice skirting and a Blink camera doorbell for extra peace of mind. This home is truly move-in ready—offering the perfect balance of comfort, modern upgrades, and thoughtful details inside and out.
-
2025-05-06soldstatus $62,500
-
2025-01-29soldstatus
ⓘ Source: listings_history table (triggers on properties + properties_extension) + one-shot
backfill from property_details.listing_events for pre-trigger history.
Tax reassessment forecast TX · Resets to sale price
- Current annual tax
- $1,074 · $90/mo
- Projected year-2 tax
- $3,568 · $297/mo
- Expected delta
- +$2,494/yr (+$208/mo · 232.2%)
ⓘ Screening estimate from a state-policy table — verify with the county assessor before closing.
Nearby sold comps map
Loading sold comps map…
Walkable amenities ~0.75 mi
Loading nearby amenities…
Taxation est. · year 1
- Rental income
- $20,224
- − Mortgage interest
- −$10,923
- − Property taxes
- −$1,074
- − Insurance
- −$975
- − Repairs & maintenance
- −$1,618
- − Management
- −$1,618
- − Depreciation
- −$5,673
- Taxable loss
- −$1,657
- Est. tax savings @ 24.0%
- +$398
- After-tax cash flow
- $2,054/yr
For passive investors: Depreciation is non-cash, so a rental often shows a tax loss while cash-flowing — sheltering income. Rental losses are passive: they offset passive income freely, and up to $25,000/yr can offset ordinary (W-2) income if you actively participate and your MAGI is under $100k (phasing out to $0 by $150k); unused losses carry forward. On sale, claimed depreciation is recaptured at up to 25%, and gains may owe capital-gains tax (a 1031 exchange can defer both). Figures are a year-1 estimate at your 24.0% rate — not tax advice; consult a CPA.
Condition & rehab AI · 12 photos
This beautifully updated home offers a good condition with fresh paint and modern appliances, making it a great investment opportunity.
Value-add opportunities
- Both Paint exterior — Fresh paint can enhance curb appeal and value.
- Resale Replace countertops — Modern countertops can increase the home's appeal to potential buyers.
- Both Install smart home devices — Smart home devices can improve convenience and energy efficiency, attracting both buyers and renters.
Renovation cost estimate screening
Value-add ROI direction
- Both Paint exterior — Fresh paint can enhance curb appeal and value. ↑
- Resale Replace countertops — Modern countertops can increase the home's appeal to potential buyers. ↑
- Both Install smart home devices — Smart home devices can improve convenience and energy efficiency, attracting both buyers and renters. ↑
ⓘ Cost ranges are severity-bucket heuristics (US national rule-of-thumb). Get contractor quotes + a written scope before underwriting a rehab budget.
Schools (NCES district)
- District
- Conroe ISD
- NCES district ID
- 4815000
- Math proficiency
- 57% ▼ -6.00%
- Reading proficiency
- 57% ▼ -1.00%
- Median HH income
- $71,541
- Composite
- 50.65/100
- National rank
- #1833
- State rank
- #69 of 826 in TX
Livability — Grangerland
No livability data for this city. (Only ~50 U.S. cities are tracked.)
Census & demographics
- County
- Montgomery County · 663,713 people
- Metro
- Houston-The Woodlands-Sugar Land, TX
- Population (ZIP)
- 18,086
- Household income
- $76,257
- Rent vs Own
- Severe rent burden
- 231.0
Population outlook (Montgomery County) Hauer SSP2
- Today (2025)
- 713,896 people
- By 2030
- 805,263 · +12.8%
- By 2040
- 992,708 · +39.1%
- By 2050
- 1,179,590 · +65.2%
- By 2075
- 1,628,084 · +128.1%
- By 2100
- 1,937,880 · +171.5%
Race, ethnicity, and origin ACS 2023
- Neighborhood character
- Majority Hispanic (55%)
- Race & ethnicity
- Hispanic / Latino 55% White 41% Two or more races 11% Black 2%
- Hispanic origin (detail)
- Mexican 51%
- Common ancestry
- Iranian 1% Slovak 1% Lithuanian 1%
- Foreign-born
- 21% · Canada
- Languages at home
- 53% English-only · Spanish 45% German/W. Germanic 1%
Political lean MEDSL · Montgomery
- 2024 margin
- Solid R (+45.5) · D 26.8% · R 72.3%
- 2008→2024 swing
- +7.2pp toward D · 2008: -52.7pp · 2024: -45.5pp
- All cycles
- 2024: R+45.5 2020: R+43.8 2016: R+51.4 2012: R+60.7 2008: R+52.7
Not yet ingested
- Civics
- —
Market trends
- HPI YoY
- ▼ -13.02%
- Current HPI
- 306.3801
- Rent YoY
- —
- Metro
- Houston-The Woodlands-Sugar Land, TX
- State GDP YoY
- ▲ 3.95%
- F500 in state
- 110
Industry mix (Fortune 500 HQ in TX)
| Industry | F500 HQs | Revenue |
|---|---|---|
| Energy | 16 | $1,198B |
|
||
| Technology | 5 | $198B |
|
||
| Engineering / Construction | 4 | $72B |
|
||
| Energy Services | 3 | $60B |
|
||
| Utilities | 3 | $41B |
|
||
| Healthcare | 2 | $330B |
|
||
Price history
+212.0% since first listed4 events — show timeline
- 2026-02-19 Price Changed $195,000 HARMLS
- 2025-10-30 Listed $200,000 HARMLS
- 2025-05-06 Sold (Public Records) $62,500 Public Records
- 2025-01-29 Sold (Public Records) — Public Records
Cash-flow waterfall
monthlySold comps — $/sqft
last 12 mo · ≤1 miLoading sold comps…