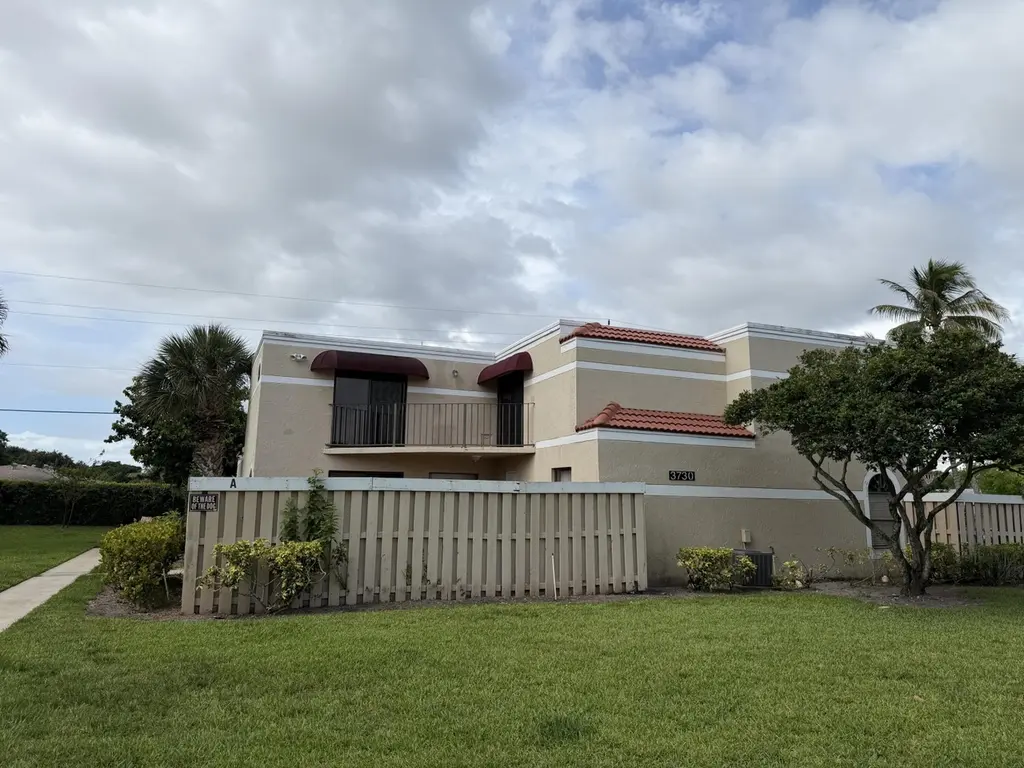
3730 Village Dr Unit A · Delray Beach, FL
Flood risk 1/10 · Minimal
- FEMA flood zone
- X (unshaded)
- Chance of flooding over 30 yrs
- 0.0%
- Est. flood insurance / yr
- $507 – $1,088
Fire risk 1/10 · Minimal
- Est. fire insurance / yr
- $947 – $1,759
Heat risk 10/10 · Severe
- Hot days now (above 106°F)
- 7 days/yr
- Hot days in 30 yrs
- 26 days/yr
Wind risk 10/10 · Severe
- Chance of severe wind over 30 yrs
- 99.0%
Air-quality risk 2/10 · Minimal
- Unhealthy air days now
- 1 days/yr
- Unhealthy air days in 30 yrs
- 2 days/yr
Risk factors via First Street. Map © Google.
Why this score? — see what drove the D grade
The composite is a weighted blend of 9 inputs, each scored 0–100. Each bar is that input's sub-score; the figure is the points it added to the 100-point composite (weight × sub-score).
- Cash flow +12.4/30.0
- ARV discount +7.5/15.0
- 1% rule +5.8/10.0
- Schools +4.3/10.0
- Livability +3.9/5.0
- DSCR +3.7/10.0
- Rent growth +3.0/5.0
- Condition / age +2.5/5.0
- Appreciation +0.0/10.0
$280,000
🖨 Deal sheet (PDF) 📄 Offer letter ✓ Due diligence
Listing remarks MLS
3/2 townhouse with a fenced, screened courtyard patio! Great value! Needs carpet replacement and painting as well as some updating.
Key facts
- $473 HOA
- 2 parking spots
- Community pool
Property features AI
Finance
- Other: Pets allowed with breed and number restrictions
- HOA & community: Part of Chateau Woods HOA; HOA includes pool and tennis courts; Monthly HOA fee of $473 covering insurance, grounds maintenance, and common areas
Exterior
- Parking: Assigned and guest parking; Two open parking spaces (total 2)
- Utilities: Public water; Public sewer; Three-phase electric; Sewer and water available
- Home design: Townhouse; Multi/split levels; Two-story building; Faces west
- Construction: CBS construction; Spanish tile roof; Slab foundation; Built as part of building identified as 3730
- Exterior features: Open patio; Patio; Fenced yard; No waterfront
Interior
- Kitchen: Dishwasher; Electric range; Microwave; Refrigerator
- Bedrooms: One bedroom on the main level
- Flooring: Ceramic tile
- Bathrooms: Three full bathrooms; One bathroom on the main level
- Heating & cooling: Central electric heating; Central air conditioning with ceiling fans
- Interior features: Split and stacked bedroom layouts; Blinds on windows; Unfurnished
- Laundry & utility: Laundry closet with washer and electric dryer hookups; Inside laundry located on upper level
Neighborhood map
What this means for you Summary
Snapshot
- This is a 3-bed/3.0-bath townhouse listed at $280k.
Deal economics
- At list price, monthly cash flow is $-48 ($-582/yr) — negative.
- To cash-flow at today's rent, offer at most $271k (3.1% below list).
- Meets the 1% rule at list price ($3k rent vs $280k).
- Recommended offer: $271k (3.1% below list) — sets the bar for cash-flow.
- Cap rate 6.1% vs local median 4.3% in Delray Beach — top-decile yield for the area; either an underpriced asset or a hidden risk that comps aren't pricing in. Stress-test before assuming the spread holds.
Location & tenants
- Location reads 77/100 on livability (#202 in FL, #3,160 nationally) — a middle-class / working-renter tenant base. Strengths: housing A+, health & safety A+, commute A-; Watch: cost of living C-, crime D-, amenities F.
- Palm Beach (suburban): math 46% / reading 53% proficiency, ranked #34 of 73 in FL (top 47%) — families likely to look elsewhere, expect single-tenant / working-renter base with shorter leases.
- Zoned schools: Banyan Creek Elementary School (math 62% / reading 64%, grade B, #582 of 2,144 statewide, top 28%, 844 students, 51% FRL); Carver Middle School (math 22% / reading 34%, grade F, #486 of 571 statewide, top 86%, 732 students, 73% FRL); Atlantic High School (math 28% / reading 52%, grade F, #296 of 667 statewide, top 45%, 1,889 students, 59% FRL).
- Market conditions: Rents rising (+1.8%/yr); 359 active listings in the ZIP; 40 comparable units currently listed for rent nearby; rentals at typical pace (median 24d on market — plan ~3-4 weeks tenant-placement turnaround); solid renter incomes; 3,974 units permitted in Palm Beach County in 2024 (1,012 in 5+ unit buildings).
- At $3,029/mo this rent would consume 47% of the median local household income ($78k/yr) (locally 1649% of renters already pay >50% of income on rent) — very limited rent-growth headroom before tenants either downsize or default.
Forward outlook
- Local home prices are declining (-3.0%/yr); year-one equity from $2k of loan paydown is wiped out by about $8k of value loss. Plan a longer hold.
- Palm Beach County population projected at +30% by 2050 — long-run rental-demand tailwind backs the buy-and-hold thesis.
Negotiation context
- Only 2 days on market — expect competitive offers; lowballing is unlikely to land.
- 4 sale attempts since 16y ago with the ask held roughly flat each time — persistent listings suggest the price (not the market) is what's stuck; bring a comps-based counter.
- Current owner paid $75k; list at $280k implies a 273% gain — meaningful room to come down on a strong offer.
Risks & watch-outs
- Climate carrying-cost: severe wind risk, 99% chance of damaging wind over 30y; extreme-heat days projected 7→26/yr by 2055 (HVAC capex compounding) — expect insurance premiums to compound above CPI over the hold.
Questions for the listing agent
- What do current leases actually rent for vs. the listed asking? Can we see a recent rent roll and the last 12 months of T-12 income?
- What does the HOA fee cover, when was the last increase, and are there any pending special assessments or reserve-fund shortfalls?
- Is there a deadline driving the sale (1031 exchange, divorce, estate, relocation)? That informs how much negotiation room exists.
- Schools are B-rated — typically a magnet for longer-tenancy family renters. What's the average tenant stay here, and is there a school-zone premium baked into asking?
- Crime grade is D in this area — have there been break-ins, vandalism, or insurance claims at this property in the last 3 years? What carrier currently insures it and at what premium?
- The area grade is low — what's the realistic commute time and amenity access for the typical tenant pool here? Any planned neighborhood developments (good or bad) we should know about?
- What's the average days-on-market for RENTAL listings here right now (not sales)? A rising rental-DOM trend means longer vacancies and softer asking-rent achievability than the comps imply.
- What's the recent tenant-quality profile in this submarket — average credit score on applications, eviction rate, late-payment / NSF rate, and stable-employment percentage? A property-management company in the area should have these aggregated.
- How much new for-sale + rental construction is in the pipeline within 1–3 miles? Heavy new supply typically softens prices + rents 12–24 months out; constrained supply supports both.
Investment metrics
- 1% rule
- 1.08% ✓
- Cap rate
- 6.09%
- Cash-on-cash
- -0.74%
- DSCR
- 0.97
- GRM
- 7.7
CMA / ARV
No comps found within radius.
Projected returns pro-forma
-3.0% appreciation · 1.83% rent growth · sell at horizon
- IRR
- -19.0%
- Equity multiple
- 0.34×
- Total profit
- $-51,628
- Equity at exit
- $41,749
- IRR
- -14.6%
- Equity multiple
- 0.21×
- Total profit
- $-61,612
- Equity at exit
- $24,209
Cash invested: $78,400 (down + closing). Projections, not guarantees.
Landlord ↔ Tenant lean methodology
- Overall (STATE)
- 87 Strongly Landlord-Friendly
- State Florida
- 87 Strongly Landlord-Friendly · R+3
- County
- — inherits STATE
- City
- — inherits STATE
ZIP-level market 33445
- Rents YoY
- 1.8%
- Active inventory
- 359
- Price-to-rent
- 7.7×
Monthly cashflow live
- Estimated rent
- $3,029 high interval (Pro) →
- Mortgage (P&I)
- −$1,468
- Tax from tax record
- −$384 /mo · $4,602/yr
- Insurance
- −$117
- HOA
- −$473
- Vacancy / Maint / Mgmt
- −$636
- Net cashflow
- $-48
Break-even live
Sensitivity live
| Price | -10% $110 | -5% $31 | +0% $-48 | +5% $-128 | +10% $-207 |
|---|---|---|---|---|---|
| Rent | -10% $-288 | -5% $-168 | +0% $-48 | +5% $71 | +10% $191 |
| Rate | -1.0pp $93 | -0.5pp $23 | base $-48 | +0.5pp $-121 | +1.0pp $-195 |
UW: 25.0% down · 7.5% · 30yr · 1.5% tax · 5.0% vac · 8.0% maint · 8.0% mgmt
Financing live
Cash to close
- Down payment
- $70,000
- Closing costs
- $8,400
- Reserves months
- —
- Total cash needed
- —
Loan-product check · same deal, 3 products live
Conventional
25% down · 7.5% · 30yr
- Down + closing
- —
- Monthly P&I
- —
- Monthly cashflow
- —
- DSCR
- —
- Eligible?
- —
Personal DTI + credit; lowest rate.
DSCR
20% down · 8.5% · 30yr
- Down + closing
- —
- Monthly P&I
- —
- Monthly cashflow
- —
- DSCR
- —
- Eligible?
- —
No personal income docs; deal must DSCR.
Hard money
10% down · 12.0% · 12mo
- Down + closing
- —
- Monthly P&I
- —
- Monthly cashflow
- —
- DSCR
- —
- Eligible?
- —
Short-term bridge; refi at stabilization.
Rent comps 40 comps
| Address | Beds | Baths | Sqft | Rent | $/sqft | DOM | Units | Dist |
|---|---|---|---|---|---|---|---|---|
| 1152 Circle Dr Unit D Delray Beach, FL | 2.0 | 2.0 | 1200 | $2,000 | $1.67 | 14d | 1 | 0.17mi |
| 1155 South Drive Cir Unit A Delray Beach, FL | 2.0 | 2.0 | 1080 | $2,195 | $2.03 | 26d | 1 | 0.17mi |
| 1152 Circle Dr Unit D Delray Beach, FL | 2.0 | 2.0 | 1200 | $2,000 | $1.67 | 26d | 1 | 0.17mi |
| 3935 Village Dr Delray Beach, FL | 3.0 | 3.0 | 1326 | $2,700 | $2.04 | 7d | 1 | 0.18mi |
| 3935 Village Dr Unit A Delray Beach, FL | 3.0 | 3.0 | 1326 | $2,700 | $2.04 | 9d | 1 | 0.18mi |
| 775 North Dr Unit A Delray Beach, FL | 2.0 | 2.0 | 1175 | $2,000 | $1.70 | 12d | 1 | 0.27mi |
| 775 North Dr Unit A Delray Beach, FL | 2.0 | 2.0 | 1175 | $2,000 | $1.70 | 1d | 1 | 0.27mi |
| 1252 Club Dr W Unit D Delray Beach, FL | 2.0 | 2.0 | 1137 | $2,100 | $1.85 | 26d | 1 | 0.35mi |
| 1252 Club Dr W Unit D Delray Beach, FL | 2.0 | 2.0 | 1137 | $2,100 | $1.85 | 7d | 1 | 0.35mi |
| 2941 Angler Dr Delray Beach, FL | 3.0 | 2.0 | 1578 | $5,000 | $3.17 | 26d | 1 | 0.38mi |
| 4310 Village Dr Unit D Delray Beach, FL | 3.0 | 3.0 | 1326 | $2,600 | $1.96 | 26d | 1 | 0.38mi |
| 328 W Coral Trace Cir Unit 328 Delray Beach, FL | 3.0 | 2.5 | 1632 | $3,500 | $2.14 | 12d | 1 | 0.42mi |
| 328 W Coral Trace Cir Delray Beach, FL | 3.0 | 2.5 | 1632 | $3,500 | $2.14 | 24d | 1 | 0.42mi |
| 3996 NW 7th Ct Delray Beach, FL | 3.0 | 2.0 | 1480 | $5,000 | $3.38 | 26d | 1 | 0.43mi |
| 2712 Lake Ida Rd Delray Beach, FL | 3.0 | 2.0 | 1604 | $4,000 | $2.49 | 9d | 1 | 0.44mi |
| 797 NW 32nd Ave Delray Beach, FL | 2.0 | 2.0 | 1480 | $2,800 | $1.89 | 26d | 1 | 0.48mi |
| 797 NW 32nd Ave Delray Beach, FL | 2.0 | 2.0 | 1480 | $2,800 | $1.89 | 19d | 1 | 0.48mi |
| 2622 NW 7th Ct Delray Beach, FL | 2.0 | 2.5 | 1384 | $2,750 | $1.99 | 26d | 1 | 0.51mi |
| 315 Coral Trace Ln Delray Beach, FL | 3.0 | 2.0 | 1576 | $3,800 | $2.41 | 9d | 1 | 0.53mi |
| 215 NW 40th Ave Delray Beach, FL | 3.0 | 2.0 | 1240 | $3,350 | $2.70 | 26d | 1 | 0.53mi |
| 227 Coral Trace Ln Unit 227 Delray Beach, FL | 2.0 | 2.0 | 1376 | $3,100 | $2.25 | 26d | 1 | 0.54mi |
| 2513 Coral Trace Pl Delray Beach, FL | 3.0 | 2.5 | 1632 | $3,500 | $2.14 | 26d | 1 | 0.54mi |
| 945 Sunflower Ave Delray Beach, FL | 3.0 | 2.0 | 1755 | $4,500 | $2.56 | 9d | 1 | 0.55mi |
| 2480 S Coral Trace Cir Delray Beach, FL | 2.0 | 2.0 | 1379 | $2,900 | $2.10 | 9d | 1 | 0.55mi |
| 872 NW 29th Ave Unit A Delray Beach, FL | 2.0 | 2.0 | 1188 | $2,700 | $2.27 | 26d | 1 | 0.55mi |
| 2450 S Coral Trace Cir Delray Beach, FL | 3.0 | 2.0 | 1576 | $2,975 | $1.89 | 26d | 1 | 0.58mi |
| 4110 NW 10th St Delray Beach, FL | 3.0 | 2.5 | 1839 | $4,500 | $2.45 | 26d | 1 | 0.60mi |
| 125 Via D Este Delray Beach, FL | 1.0–3.0 | 1.0–2.0 | 1156 | $4,144 | $3.58 | 1d | 14 | 0.64mi |
| 4510 NW 2nd St Unit A Delray Beach, FL | 2.0 | 2.0 | 1080 | $1,800 | $1.67 | 26d | 1 | 0.66mi |
| 2915 NW 12th St Unit D Delray Beach, FL | 2.0 | 2.0 | 1499 | $3,200 | $2.13 | 9d | 1 | 0.72mi |
| 13487 Barwick Rd Unit B Delray Beach, FL | 2.0 | 1.5 | 1092 | $3,600 | $3.30 | 1d | 1 | 0.78mi |
| 500 N Congress Ave Delray Beach, FL | 2.0–3.0 | 1.0–2.0 | 989 | $3,033 | $3.07 | 1d | 6 | 0.79mi |
| 1225 E Magnolia Cir Delray Beach, FL | 3.0 | 2.0 | 1705 | $3,700 | $2.17 | 26d | 1 | 0.80mi |
| 4477 NW 3rd Dr Delray Beach, FL | 2.0 | 1.5 | 1109 | $2,550 | $2.30 | 26d | 1 | 0.80mi |
| 305 SW 28th Ave Delray Beach, FL | 2.0 | 2.0 | 1369 | $4,300 | $3.14 | 15d | 1 | 0.82mi |
| 2583 NW 13th St Delray Beach, FL | 2.0 | 2.0 | 1466 | $2,600 | $1.77 | 19d | 1 | 0.83mi |
| 354 SW 28th Ave Delray Beach, FL | 2.0 | 2.0 | 1369 | $5,450 | $3.98 | 26d | 1 | 0.84mi |
| 378 SW 28th Ave Delray Beach, FL | 3.0 | 2.0 | 1519 | $3,500 | $2.30 | 12d | 1 | 0.87mi |
| 2095 W Atlantic Ave Delray Beach, FL | 3.0 | 1.0–2.0 | 1012 | $3,975 | $3.93 | 0d | 10 | 0.89mi |
| 4311 N Magnolia Cir Delray Beach, FL | 3.0 | 2.0 | 1705 | $3,100 | $1.82 | 26d | 1 | 0.91mi |
HOA detail
- Monthly dues
- $473 · $5,676/yr
Listing history 2 events
-
2026-06-21remarks 209-char remark
-
2026-06-21$280,000 Active 2 DOM
ⓘ Source: listings_history table (triggers on properties + properties_extension) + one-shot
backfill from property_details.listing_events for pre-trigger history.
Tax reassessment forecast FL · Resets to sale price
- Current annual tax
- $4,602 · $384/mo
- Projected year-2 tax
- $4,602 · $384/mo
- Expected delta
- $0/yr ($0/mo · 0.0%)
ⓘ Screening estimate from a state-policy table — verify with the county assessor before closing.
Climate risk First Street
- Flood 1/10 Low FEMA zone X (unshaded) · 0% chance over 30 yrs
- Wildfire 1/10 Low
- Heat 10/10 Extreme 7 d/yr ≥106°F today · 26 d/yr by 30 yrs out
- Wind 10/10 Extreme 99% chance of damaging wind over 30 yrs
- Air quality 2/10 Low 1 unhealthy d/yr today · 2 by 30 yrs out
Nearby sold comps map
Loading sold comps map…
Walkable amenities ~0.75 mi
Loading nearby amenities…
Taxation est. · year 1
- Rental income
- $36,350
- − Mortgage interest
- −$15,684
- − Property taxes
- −$4,602
- − Insurance
- −$1,400
- − Repairs & maintenance
- −$2,908
- − Management
- −$2,908
- − HOA
- −$5,676
- − Depreciation
- −$8,145
- Taxable loss
- −$4,974
- Est. tax savings @ 24.0%
- +$1,194
- After-tax cash flow
- $612/yr
For passive investors: Depreciation is non-cash, so a rental often shows a tax loss while cash-flowing — sheltering income. Rental losses are passive: they offset passive income freely, and up to $25,000/yr can offset ordinary (W-2) income if you actively participate and your MAGI is under $100k (phasing out to $0 by $150k); unused losses carry forward. On sale, claimed depreciation is recaptured at up to 25%, and gains may owe capital-gains tax (a 1031 exchange can defer both). Figures are a year-1 estimate at your 24.0% rate — not tax advice; consult a CPA.
Schools (NCES district)
- District
- Palm Beach
- NCES district ID
- 1201500
- Math proficiency
- 46% ▼ -16.00%
- Reading proficiency
- 53% ▼ -4.00%
- Median HH income
- $53,943
- Composite
- 42.72/100
- National rank
- #3160
- State rank
- #34 of 73 in FL
Livability — Delray Beach
- Score
- 77/100
- State rank
- #202
- US rank
- #3160
Category grades
Schools grade is shown separately in the Schools card above.
Census & demographics
- Census place
- Delray Beach, FL
- County
- Palm Beach County · 1,438,312 people
- City population
- 123,167
- Metro
- Miami-Fort Lauderdale-Pompano Beach, FL
- Population (ZIP)
- 33,122
- Household income
- $78,163
- Rent vs Own
- Severe rent burden
- 1649.0
Population outlook (Palm Beach County) Hauer SSP2
- Today (2025)
- 1,637,487 people
- By 2030
- 1,743,255 · +6.5%
- By 2040
- 1,948,712 · +19.0%
- By 2050
- 2,132,979 · +30.3%
- By 2075
- 2,530,027 · +54.5%
- By 2100
- 2,706,979 · +65.3%
Race, ethnicity, and origin ACS 2023
- Neighborhood character
- Diverse neighborhood (Simpson 0.62)
- Race & ethnicity
- White 55% Black 24% Hispanic / Latino 11% Two or more races 11% Asian 4%
- Hispanic origin (detail)
- Puerto Rican 3% Cuban 2%
- Common ancestry
- Hispanic 14% Romanian 3% Scotch-Irish 3%
- Foreign-born
- 27% · Canada, Jamaica, Dominican Republic
- Languages at home
- 66% English-only · French/Haitian/Cajun 18% Spanish 9% Other Indo-European 4%
Political lean MEDSL · Palm Beach
- 2024 margin
- Toss-up / Even · D 50.0% · R 49.2%
- 2008→2024 swing
- -22.1pp toward R · 2008: 22.9pp · 2024: 0.8pp
- All cycles
- 2024: D+0.8 2020: D+12.8 2016: D+15.3 2012: D+17.0 2008: D+22.9
Not yet ingested
- Civics
- —
Market trends
- HPI YoY
- ▼ -258.16%
- Current HPI
- 349.5505
- Rent YoY
- ▲ 1.83%
- Metro
- Miami-Fort Lauderdale-Pompano Beach, FL
- State GDP YoY
- ▲ 3.28%
- F500 in state
- 36
Industry mix (Fortune 500 HQ in FL)
| Industry | F500 HQs | Revenue |
|---|---|---|
| Industrial Technology | 2 | $29B |
|
||
| Insurance | 2 | $17B |
|
||
| Retail | 1 | $60B |
|
||
| Technology Distribution | 1 | $58B |
|
||
| Homebuilding | 1 | $35B |
|
||
| Technology Manufacturing | 1 | $35B |
|
||
Price history
+300.6% since first listed13 events — show timeline
- 2026-06-19 Listed $280,000 Beaches MLS
- 2025-05-08 Rental Removed $2,000 RMLSFL
- 2025-04-24 Price Changed $2,000 RMLSFL
- 2025-03-22 Listed for Rent $2,200 RMLSFL
- 2025-03-22 Rental Removed $2,200 GFLMLS
- 2025-03-22 Listed for Rent $2,200 GFLMLS
- 2010-04-12 Sold (MLS) $75,000 Beaches MLS
- 2010-03-30 Listing Removed — Beaches MLS
- 2010-03-10 Listed $69,900 Beaches MLS
- 2003-02-06 Sold (Public Records) $135,000 Public Records
- 1999-11-02 Sold (Public Records) $81,500 Public Records
- 1992-08-20 Sold (Public Records) $73,000 Public Records
- 1988-08-02 Sold (Public Records) $69,900 Public Records
Property tax history
+7.4%/yrLatest (2025): $4,602 · +11.1% YoY. Source: county tax records.
Cash-flow waterfall
monthlySold comps — $/sqft
last 12 mo · ≤1 miLoading sold comps…