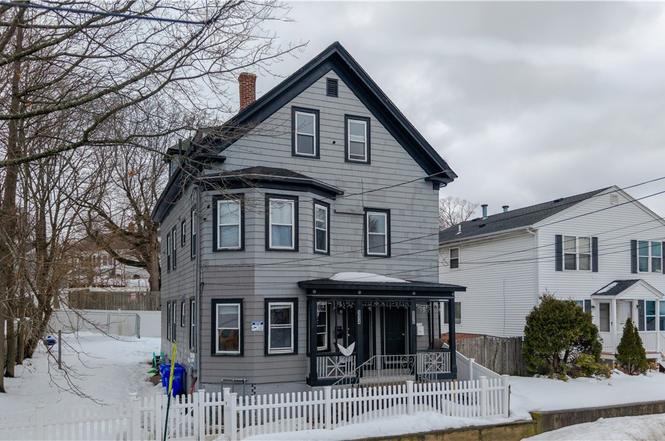
 Triplex
994 Douglas Ave · Providence, RI
Flood risk 1/10 · Minimal
- FEMA flood zone
- X (unshaded)
- Chance of flooding over 30 yrs
- 0.0%
- Est. flood insurance / yr
- $473 – $860
Fire risk 1/10 · Minimal
- Est. fire insurance / yr
- $835 – $1,551
Heat risk 5/10 · Moderate
- Hot days now (above 96°F)
- 7 days/yr
- Hot days in 30 yrs
- 15 days/yr
Wind risk 6/10 · Moderate
- Chance of severe wind over 30 yrs
- 69.0%
Air-quality risk 2/10 · Minimal
- Unhealthy air days now
- 1 days/yr
- Unhealthy air days in 30 yrs
- 2 days/yr
Risk factors via First Street. Map © Google.
Why this score? — see what drove the C- grade
The composite is a weighted blend of 9 inputs, each scored 0–100. Each bar is that input's sub-score; the figure is the points it added to the 100-point composite (weight × sub-score).
- Cash flow +20.9/30.0
- ARV discount +7.5/15.0
- DSCR +6.7/10.0
- 1% rule +4.6/10.0
- Rent growth +4.2/5.0
- Livability +4.2/5.0
- Condition / age +2.5/5.0
- Schools +1.0/10.0
- Appreciation +0.0/10.0
$699,900
🖨 Deal sheet 📄 Offer letter ✓ Due diligence
Multi-family units
County records classify this as Multi-Family (2-4 Unit). Listing-text estimate: 3 units. confirmed
Listing remarks MLS
Solid 3 family central to everything. Recently renovated. Great investment.
Key facts
- 5,000 sq ft lot
- 4 parking spots
- Built 1925
Neighborhood map
What this means for you Summary
Snapshot
- This is a 3 × 3-bed/1.0-bath units multifamily listed at $700k.
Deal economics
- At list price, monthly cash flow is $980 ($12k/yr) — positive. Per door: $327/mo.
- The deal already cash-flows at list — no discount required.
- To meet the 1% rule (rent ≥ 1% of price), the offer needs to be $668k (4.5% below list).
- Recommended offer: $668k (4.5% below list) — sets the bar for 1% rule.
- Cap rate 8.0% vs local median 4.2% in Providence — top-decile yield for the area; either an underpriced asset or a hidden risk that comps aren't pricing in. Stress-test before assuming the spread holds.
Location & tenants
- Location reads 84/100 on livability (#2 in RI, #794 nationally) — a professional / high-income tenant draw. Strengths: amenities A+, commute A+, housing A+; Watch: employment C-, schools F.
- Providence (urban): math 8% / reading 16% proficiency, ranked #34 of 39 in RI (top 87%) — low school quality limits family demand, transient renter base, plan for 1-2y turnover; 79% free/reduced lunch — lower-income household profile, screen leases tightly.
- Market conditions: Rents rising fast (+6.9%/yr); 151 active listings in the ZIP; 776 units permitted in Providence County in 2024 (229 in 5+ unit buildings).
- At $6,685/mo this rent would consume 120% of the median local household income ($67k/yr) (locally 1176% of renters already pay >50% of income on rent) — very limited rent-growth headroom before tenants either downsize or default.
Forward outlook
- Local home prices are declining (-3.0%/yr); year-one equity from $5k of loan paydown is wiped out by about $21k of value loss. Plan a longer hold.
- Providence County population projected at +5% by 2050 — modest demand growth; plan on rents tracking national, not racing it.
- At projected returns (-3.0% appreciation + 6.9% rent growth), your $196k cash investment doubles in ~10 years — after that, you're playing with house money.
Negotiation context
- It's been on market 43 days — a 3% lower offer ($679k) is reasonable based on typical stale-listing flexibility.
- 6 sale attempts since 27y ago; this cycle's ask has dropped $50k (7%) from the opening price — seller is motivated, your offer sets the floor, not the list.
- Current owner paid $322k; list at $700k implies a 117% gain — meaningful room to come down on a strong offer.
Risks & watch-outs
- Watch-outs: built in 1925 — expect roof / HVAC / electrical / plumbing capex.
- Climate carrying-cost: major wind risk, 69% chance of damaging wind over 30y; extreme-heat days projected 7→15/yr by 2055 (HVAC capex compounding) — expect insurance premiums to compound above CPI over the hold.
Questions for the listing agent
- It's been on market 43 days. Have you received any prior offers? Is the seller open to a 4% concession, seller financing, or rate buy-down credit?
- Can we see the unit-by-unit rent roll, current vacancy, and any below-market leases? What's the average tenancy length?
- What capital expenditures (roof, boiler, parking lot, exteriors) have been made in the last 5 years, and what's planned in the next 2?
- Built in 1925 — when were the roof, HVAC, electrical panel, plumbing, and water heater last replaced?
- Is there a deadline driving the sale (1031 exchange, divorce, estate, relocation)? That informs how much negotiation room exists.
- Schools are F-rated, which usually means shorter tenancies and higher turnover. Who's the typical renter profile here, and what's been the actual vacancy rate?
- What's the average days-on-market for RENTAL listings here right now (not sales)? A rising rental-DOM trend means longer vacancies and softer asking-rent achievability than the comps imply.
- What's the recent tenant-quality profile in this submarket — average credit score on applications, eviction rate, late-payment / NSF rate, and stable-employment percentage? A property-management company in the area should have these aggregated.
- How much new apartment / multifamily construction is in the pipeline within 1–3 miles? Heavy new supply (>2% of stock underway) typically softens rents 12–24 months out; light construction supports rent growth.
Investment metrics
- 1% rule
- 0.96% ✗
- Cap rate
- 7.97%
- Cash-on-cash
- 6.00%
- DSCR
- 1.27
- GRM
- 8.7
CMA / ARV
No comps found within radius.
Projected returns pro-forma
-3.0% appreciation · 6.88% rent growth · sell at horizon
- IRR
- -3.2%
- Equity multiple
- 0.88×
- Total profit
- $-24,137
- Equity at exit
- $104,357
- IRR
- 10.1%
- Equity multiple
- 1.91×
- Total profit
- $178,927
- Equity at exit
- $60,515
Cash invested: $195,972 (down + closing). Projections, not guarantees.
Landlord ↔ Tenant lean methodology
- Overall (STATE)
- 31 Tenant-Leaning
- State Rhode Island
- 31 Tenant-Leaning · D+8
- County
- — inherits STATE
- City
- — inherits STATE
ZIP-level market 02904
- Rents YoY
- 6.9%
- Active inventory
- 151
- Price-to-rent
- 26.2×
Monthly cashflow live
- Estimated rent
- $6,685 high interval (Pro) →
- Mortgage (P&I)
- −$3,670
- Tax from tax record
- −$340 /mo · $4,075/yr
- Insurance
- −$292
- HOA
- −$0
- Vacancy / Maint / Mgmt
- −$1,404
- Net cashflow
- $980
Break-even live
3-unit breakdown (identical units grouped — click to expand)
| Units | Beds | Baths | Est. rent |
|---|---|---|---|
| 3× units | 3 | 1 | $6,684 |
| #1 | 3 | 1 | $2,228 |
| #2 | 3 | 1 | $2,228 |
| #3 | 3 | 1 | $2,228 |
| Total (3 units) | $6,685 | ||
UW: 25.0% down · 7.5% · 30yr · 1.5% tax · 5.0% vac · 8.0% maint · 8.0% mgmt
Financing live
Cash to close
- Down payment
- $174,975
- Closing costs
- $20,997
- Reserves months
- —
- Total cash needed
- —
Loan-product check · same deal, 3 products live
Conventional
25% down · 7.5% · 30yr
- Down + closing
- —
- Monthly P&I
- —
- Monthly cashflow
- —
- DSCR
- —
- Eligible?
- —
Personal DTI + credit; lowest rate.
DSCR
20% down · 8.5% · 30yr
- Down + closing
- —
- Monthly P&I
- —
- Monthly cashflow
- —
- DSCR
- —
- Eligible?
- —
No personal income docs; deal must DSCR.
Hard money
10% down · 12.0% · 12mo
- Down + closing
- —
- Monthly P&I
- —
- Monthly cashflow
- —
- DSCR
- —
- Eligible?
- —
Short-term bridge; refi at stabilization.
Listing history 21 events
-
2026-04-21status Pending
-
2026-03-30historical Active Under Contract
-
2026-03-16price $699,900
-
2026-03-09$749,900 Active
-
2021-02-22soldstatus $322,000 Closed 75-char remark
Show marketing remark (75 chars)
Solid 3 family central to everything. Recently renovated. Great investment.
-
2021-01-26status Pending 75-char remark
Show marketing remark (75 chars)
Solid 3 family central to everything. Recently renovated. Great investment.
-
2021-01-12soldstatus $322,000
-
2020-11-03price $318,500 75-char remark
Show marketing remark (75 chars)
Solid 3 family central to everything. Recently renovated. Great investment.
-
2020-10-27price $319,000 75-char remark
Show marketing remark (75 chars)
Solid 3 family central to everything. Recently renovated. Great investment.
-
2020-10-20price $319,500 75-char remark
Show marketing remark (75 chars)
Solid 3 family central to everything. Recently renovated. Great investment.
-
2020-09-23price $325,000 75-char remark
Show marketing remark (75 chars)
Solid 3 family central to everything. Recently renovated. Great investment.
-
2020-08-05$335,000 Active 75-char remark
Show marketing remark (75 chars)
Solid 3 family central to everything. Recently renovated. Great investment.
-
2010-05-28soldstatus $112,000 93-char remark
Show marketing remark (93 chars)
SOLID MULTI-FAMILY NEAR THE NORTH PROVIDENCE LINE. OVERALL FAIR TO GOOD CONDITION. EASY SHOW!
-
2010-03-10historical 93-char remark
Show marketing remark (93 chars)
SOLID MULTI-FAMILY NEAR THE NORTH PROVIDENCE LINE. OVERALL FAIR TO GOOD CONDITION. EASY SHOW!
-
2010-02-25$109,900 93-char remark
Show marketing remark (93 chars)
SOLID MULTI-FAMILY NEAR THE NORTH PROVIDENCE LINE. OVERALL FAIR TO GOOD CONDITION. EASY SHOW!
-
2007-04-18historical
-
2006-09-27$339,900
-
2003-07-11soldstatus $252,000
-
2003-05-22historical
-
2003-05-16$209,900
-
1999-09-13$99,900
ⓘ Source: listings_history table (triggers on properties + properties_extension) + one-shot
backfill from property_details.listing_events for pre-trigger history.
Tax reassessment forecast RI · Partial reset (capped growth)
- Current annual tax
- $4,075 · $340/mo
- Projected year-2 tax
- $7,742 · $645/mo
- Expected delta
- +$3,667/yr (+$306/mo · 90.0%)
ⓘ Screening estimate from a state-policy table — verify with the county assessor before closing.
Climate risk First Street
- Flood 1/10 Low FEMA zone X (unshaded) · 0% chance over 30 yrs
- Wildfire 1/10 Low
- Heat 5/10 Major 7 d/yr ≥96°F today · 15 d/yr by 30 yrs out
- Wind 6/10 Major 69% chance of damaging wind over 30 yrs
- Air quality 2/10 Low 1 unhealthy d/yr today · 2 by 30 yrs out
Nearby sold comps map
Loading sold comps map…
Walkable amenities ~0.75 mi
Loading nearby amenities…
Taxation est. · year 1
- Rental income
- $80,220
- − Mortgage interest
- −$39,205
- − Property taxes
- −$4,075
- − Insurance
- −$3,500
- − Repairs & maintenance
- −$6,418
- − Management
- −$6,418
- − Depreciation
- −$20,361
- Taxable income
- $244
- Est. tax owed @ 24.0%
- −$59
- After-tax cash flow
- $11,696/yr
For passive investors: Depreciation is non-cash, so a rental often shows a tax loss while cash-flowing — sheltering income. Rental losses are passive: they offset passive income freely, and up to $25,000/yr can offset ordinary (W-2) income if you actively participate and your MAGI is under $100k (phasing out to $0 by $150k); unused losses carry forward. On sale, claimed depreciation is recaptured at up to 25%, and gains may owe capital-gains tax (a 1031 exchange can defer both). Figures are a year-1 estimate at your 24.0% rate — not tax advice; consult a CPA.
Schools (NCES district)
- District
- Providence
- NCES district ID
- 4400900
- Math proficiency
- 8% ▼ -4.00%
- Reading proficiency
- 16% ▼ -2.00%
- Median HH income
- $38,197
- Composite
- 10.12/100
- National rank
- #9803
- State rank
- #34 of 39 in RI
Livability — Providence
- Score
- 84/100
- State rank
- #2
- US rank
- #794
Category grades
Schools grade is shown separately in the Schools card above.
Census & demographics
- Census place
- Providence, RI
- County
- Providence County · 548,917 people
- City population
- 212,734
- Metro
- Providence-Warwick, RI-MA
- Population (ZIP)
- 32,531
- Household income
- $67,003
- Rent vs Own
- Severe rent burden
- 1176.0
Population outlook (Providence County) Hauer SSP2
- Today (2025)
- 653,469 people
- By 2030
- 660,819 · +1.1%
- By 2040
- 672,747 · +3.0%
- By 2050
- 683,741 · +4.6%
- By 2075
- 720,435 · +10.2%
- By 2100
- 741,582 · +13.5%
Race, ethnicity, and origin ACS 2023
- Neighborhood character
- Diverse neighborhood (Simpson 0.66)
- Race & ethnicity
- White 51% Hispanic / Latino 27% Two or more races 16% Black 8% Asian 5%
- Hispanic origin (detail)
- Mexican 2% Puerto Rican 6% Dominican 7%
- Common ancestry
- Lithuanian 7% Russian 6% Romanian 2%
- Foreign-born
- 18% · Canada, Jamaica, China
- Languages at home
- 64% English-only · Spanish 20% Other Indo-European 5% Other Asian/Pacific 3%
Political lean MEDSL · Providence
- 2024 margin
- D (+14.4) · D 56.1% · R 41.7% · Other 2.2%
- 2008→2024 swing
- -20.0pp toward R · 2008: 34.4pp · 2024: 14.4pp
- All cycles
- 2024: D+14.4 2020: D+22.9 2016: D+21.2 2012: D+34.9 2008: D+34.4
Not yet ingested
- Civics
- —
Market trends
- HPI YoY
- ▼ -379.06%
- Current HPI
- 363.1386
- Rent YoY
- ▲ 6.88%
- Metro
- Providence-Warwick, RI-MA
- State GDP YoY
- ▲ 2.25%
- F500 in state
- 10
Industry mix (Fortune 500 HQ in RI)
| Industry | F500 HQs | Revenue |
|---|---|---|
| Healthcare | 1 | $373B |
|
||
| Food Distribution | 1 | $31B |
|
||
| Aerospace / Defense | 1 | $14B |
|
||
| Financial Services | 1 | $8B |
|
||
| Consumer Goods | 1 | $4B |
|
||
Price history
+600.6% since first listed21 events — show timeline
- 2026-04-21 Pending — RIS
- 2026-03-30 Contingent — RIS
- 2026-03-16 Price Changed $699,900 RIS
- 2026-03-09 Listed $749,900 RIS
- 2021-02-22 Sold (MLS) $322,000 RIS
- 2021-01-26 Pending — RIS
- 2021-01-12 Sold (Public Records) $322,000 Public Records
- 2020-11-03 Price Changed $318,500 RIS
- 2020-10-27 Price Changed $319,000 RIS
- 2020-10-20 Price Changed $319,500 RIS
- 2020-09-23 Price Changed $325,000 RIS
- 2020-08-05 Listed $335,000 RIS
- 2010-05-28 Sold (MLS) $112,000 RIS
- 2010-03-10 Listing Removed — RIS
- 2010-02-25 Listed $109,900 RIS
- 2007-04-18 Listing Removed — RIS
- 2006-09-27 Listed $339,900 RIS
- 2003-07-11 Sold (MLS) $252,000 RIS
- 2003-05-22 Listing Removed — RIS
- 2003-05-16 Listed $209,900 RIS
- 1999-09-13 Listed $99,900 RIS
Property tax history
-1.4%/yrLatest (2025): $4,075 · -35.1% YoY. Source: county tax records.
Cash-flow waterfall
monthlySold comps — $/sqft
last 12 mo · ≤1 miLoading sold comps…