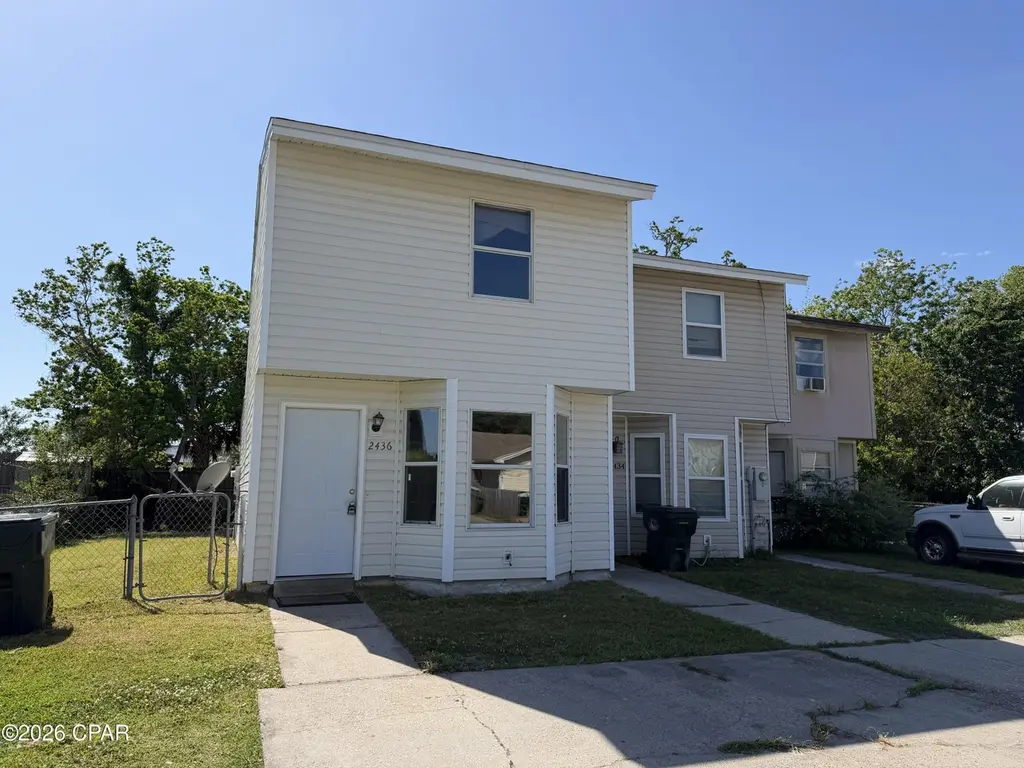
2436 Johnson Dr · Lynn Haven, FL
Flood risk 1/10 · Minimal
- FEMA flood zone
- X (unshaded)
- Chance of flooding over 30 yrs
- 0.0%
- Est. flood insurance / yr
- $507 – $1,088
Fire risk 2/10 · Minimal
- Est. fire insurance / yr
- $947 – $1,759
Heat risk 10/10 · Severe
- Hot days now (above 104°F)
- 7 days/yr
- Hot days in 30 yrs
- 22 days/yr
Wind risk 9/10 · Severe
- Chance of severe wind over 30 yrs
- 99.0%
Air-quality risk 1/10 · Minimal
- Unhealthy air days now
- 0 days/yr
- Unhealthy air days in 30 yrs
- 0 days/yr
Risk factors via First Street. Map © Google.
Why this score? — see what drove the F grade
The composite is a weighted blend of 9 inputs, each scored 0–100. Each bar is that input's sub-score; the figure is the points it added to the 100-point composite (weight × sub-score).
- Cash flow +11.2/30.0
- Schools +4.3/10.0
- Livability +4.0/5.0
- DSCR +3.3/10.0
- Rent growth +3.1/5.0
- Condition / age +2.5/5.0
- 1% rule +2.4/10.0
- ARV discount +0.0/15.0
- Appreciation +0.0/10.0
$219,900
🖨 Deal sheet (PDF) 📄 Offer letter ✓ Due diligence
Listing remarks MLS
Neat and clean townhome located adjacent to Publix shopping in Lynn Haven with easy access to Hwy 77interior features new paint, laminate flooring, tile flooring, dining area, living area with Bay Window, kitchen with breakfast area, and . 5 bathexterior features newer roof and siding, covered patio overlooking fenced back yard, and termite bond. Sold As Is. All information is estimated including measurements, age, square footage, and school zones. Click pic for additional photos, virtual tour, and homes website.
Key facts
- Washer dryer closet
- Fenced yard
- October roof
Tags
Property features AI
Finance
- HOA & community: Short-term rental allowed
Exterior
- Parking: No garage
- Security: Smoke detector(s)
- Utilities: Public sewer
- Home design: 2-story single-family residence; Slab foundation
- Construction: Vinyl siding; Composition/shingle roof
- Exterior features: Covered porch; Full chain-link fence; Paved lot; City street frontage; Publicly maintained road
Interior
- Kitchen: Electric cooktop; Electric oven
- Bedrooms: Two bedrooms on the second floor (14 x 11 and 12 x 11)
- Flooring: Luxury vinyl plank
- Bathrooms: One full bathroom on the second floor (8 x 6); One half bathroom
- Heating & cooling: Central heating (electric); Central air; Ceiling fan(s)
- Interior features: Luxury vinyl plank flooring; Smoke detector(s)
- Laundry & utility: Electric water heater
Neighborhood map
What this means for you Summary
Snapshot
- This is a 2-bed/2.0-bath townhouse listed at $220k.
Deal economics
- At list price, monthly cash flow is $-83 ($-991/yr) — negative.
- To cash-flow at today's rent, offer at most $205k (6.6% below list).
- To meet the 1% rule (rent ≥ 1% of price), the offer needs to be $164k (25.5% below list).
- Recommended offer: $164k (25.5% below list) — sets the bar for 1% rule.
- Cap rate 5.8% vs local median 3.5% in Lynn Haven — top-decile yield for the area; either an underpriced asset or a hidden risk that comps aren't pricing in. Stress-test before assuming the spread holds.
Location & tenants
- Location reads 81/100 on livability (#96 in FL, #1,472 nationally) — a professional / high-income tenant draw. Strengths: crime A+, housing A+, health & safety A+; Watch: amenities D+, commute F.
- Bay (suburban): math 51% / reading 51% proficiency, ranked #29 of 73 in FL (top 40%) — acceptable for families but not a draw, mixed tenant base, ~2y average lease.
- Zoned schools: Hiland Park Elementary School (math 42% / reading 36%, grade F, #1,560 of 2,144 statewide, top 73%, 643 students, 56% FRL); Mowat Middle School (math 49% / reading 51%, grade C, #254 of 571 statewide, top 45%, 868 students, 49% FRL); A. Crawford Mosley High School (math 51% / reading 55%, grade C-, #148 of 667 statewide, top 23%, 1,901 students, 36% FRL) — zoned schools at 47% FRL track the district average.
- Market conditions: Rents rising (+2.5%/yr); 199 active listings in the ZIP; 9 comparable units currently listed for rent nearby; rentals at typical pace (median 23d on market — plan ~3-4 weeks tenant-placement turnaround); solid renter incomes; 2,473 units permitted in Bay County in 2024 (559 in 5+ unit buildings).
Forward outlook
- Local home prices are declining (-3.0%/yr); year-one equity from $2k of loan paydown is wiped out by about $7k of value loss. Plan a longer hold.
- Bay County population projected at +24% by 2050 — long-run rental-demand tailwind backs the buy-and-hold thesis.
Negotiation context
- It's been on market 64 days — a 6% lower offer ($207k) is reasonable based on typical stale-listing flexibility.
- 3 sale attempts since 12y ago with the ask held roughly flat each time — persistent listings suggest the price (not the market) is what's stuck; bring a comps-based counter.
- Current owner paid $64k; list at $220k implies a 246% gain — meaningful room to come down on a strong offer.
Risks & watch-outs
- Climate carrying-cost: severe wind risk, 99% chance of damaging wind over 30y; extreme-heat days projected 7→22/yr by 2055 (HVAC capex compounding) — expect insurance premiums to compound above CPI over the hold.
Questions for the listing agent
- What do current leases actually rent for vs. the listed asking? Can we see a recent rent roll and the last 12 months of T-12 income?
- It's been on market 64 days. Have you received any prior offers? Is the seller open to a 26% concession, seller financing, or rate buy-down credit?
- Why hasn't it sold? Are there any deal-killer items the seller is aware of (foundation, flood, title, zoning, code violations)?
- Is there a deadline driving the sale (1031 exchange, divorce, estate, relocation)? That informs how much negotiation room exists.
- Schools are B-rated — typically a magnet for longer-tenancy family renters. What's the average tenant stay here, and is there a school-zone premium baked into asking?
- The area grade is low — what's the realistic commute time and amenity access for the typical tenant pool here? Any planned neighborhood developments (good or bad) we should know about?
- What's the average days-on-market for RENTAL listings here right now (not sales)? A rising rental-DOM trend means longer vacancies and softer asking-rent achievability than the comps imply.
- What's the recent tenant-quality profile in this submarket — average credit score on applications, eviction rate, late-payment / NSF rate, and stable-employment percentage? A property-management company in the area should have these aggregated.
- How much new for-sale + rental construction is in the pipeline within 1–3 miles? Heavy new supply typically softens prices + rents 12–24 months out; constrained supply supports both.
Investment metrics
- 1% rule
- 0.74% ✗
- Cap rate
- 5.84%
- Cash-on-cash
- -1.61%
- DSCR
- 0.93
- GRM
- 11.2
CMA / ARV
- ARV (median comp)
- $176,246
- List price
- $219,900
- Delta
- 24.77%
- Verdict
- OVERPRICED
- Comps
- 13 within 1.0 mi
Show comp detail 2 sales within ~0.75 mi
| Address | Dist | Beds/Ba | Sqft | Sold | Price | $/sf | Match |
|---|---|---|---|---|---|---|---|
| 2502 Johnson Dr | 0.01mi | 2/1.0 | 1,004 (-1%) | 1mo | $166,900 | $166 | 94 |
| 825 Bradford Cir | 0.45mi | 2/1.0 | 912 (-10%) | 22mo | $122,500 | $134 | 40 |
Match score weights: distance 35% · size 25% · config 20% · recency 20%. Top-matched comps best support the ARV.
Projected returns pro-forma
-3.0% appreciation · 2.52% rent growth · sell at horizon
- IRR
- -19.5%
- Equity multiple
- 0.32×
- Total profit
- $-41,745
- Equity at exit
- $32,788
- IRR
- -13.2%
- Equity multiple
- 0.24×
- Total profit
- $-46,583
- Equity at exit
- $19,013
Cash invested: $61,572 (down + closing). Projections, not guarantees.
Landlord ↔ Tenant lean methodology
- Overall (STATE)
- 87 Strongly Landlord-Friendly
- State Florida
- 87 Strongly Landlord-Friendly · R+3
- County
- — inherits STATE
- City
- — inherits STATE
ZIP-level market 32444
- Home prices YoY
- -29.1%
- Rents YoY
- 2.5%
- Active inventory
- 199
- Price-to-rent
- 11.2×
Monthly cashflow live
- Estimated rent
- $1,638 high interval (Pro) →
- Mortgage (P&I)
- −$1,153
- Tax from tax record
- −$132 /mo · $1,583/yr
- Insurance
- −$92
- HOA
- −$0
- Vacancy / Maint / Mgmt
- −$344
- Net cashflow
- $-83
Break-even live
Sensitivity live
| Price | -10% $42 | -5% $-20 | +0% $-83 | +5% $-145 | +10% $-207 |
|---|---|---|---|---|---|
| Rent | -10% $-212 | -5% $-147 | +0% $-83 | +5% $-18 | +10% $47 |
| Rate | -1.0pp $28 | -0.5pp $-27 | base $-83 | +0.5pp $-140 | +1.0pp $-198 |
UW: 25.0% down · 7.5% · 30yr · 1.5% tax · 5.0% vac · 8.0% maint · 8.0% mgmt
Financing live
Cash to close
- Down payment
- $54,975
- Closing costs
- $6,597
- Reserves months
- —
- Total cash needed
- —
Loan-product check · same deal, 3 products live
Conventional
25% down · 7.5% · 30yr
- Down + closing
- —
- Monthly P&I
- —
- Monthly cashflow
- —
- DSCR
- —
- Eligible?
- —
Personal DTI + credit; lowest rate.
DSCR
20% down · 8.5% · 30yr
- Down + closing
- —
- Monthly P&I
- —
- Monthly cashflow
- —
- DSCR
- —
- Eligible?
- —
No personal income docs; deal must DSCR.
Hard money
10% down · 12.0% · 12mo
- Down + closing
- —
- Monthly P&I
- —
- Monthly cashflow
- —
- DSCR
- —
- Eligible?
- —
Short-term bridge; refi at stabilization.
Rent comps 9 comps
| Address | Beds | Baths | Sqft | Rent | $/sqft | DOM | Units | Dist |
|---|---|---|---|---|---|---|---|---|
| 1019 Bradford Cir Unit 1019 Lynn Haven, FL | 2.0 | 1.0 | 810 | $1,225 | $1.51 | 23d | 1 | 0.56mi |
| 1125 Bradley Cir Lynn Haven, FL | 3.0 | 2.0 | 1190 | $1,850 | $1.55 | 15d | 1 | 0.65mi |
| 3502 Jenks Ave Panama City, FL | 1.0–3.0 | 1.0–2.0 | 1176 | $1,624 | $1.38 | 15d | 24 | 0.82mi |
| 3900 Arbor Trace Dr Lynn Haven, FL | 2.0–3.0 | 2.0 | 1520 | $1,634 | $1.07 | 15d | 34 | 0.89mi |
| 3938 Solano Rd Unit 3938 Panama City, FL | 3.0 | 2.5 | 1450 | $1,800 | $1.24 | 23d | 1 | 0.97mi |
| 1409 Florida Ave Lynn Haven, FL | 2.0 | 1.0 | 800 | $1,276 | $1.59 | 23d | 1 | 1.10mi |
| 1307 Pennsylvania Ave Unit 1 Lynn Haven, FL | 3.0 | 1.0 | 1256 | $1,500 | $1.19 | 15d | 1 | 1.23mi |
| 2950 Harrison Ave Panama City, FL | 1.0–3.0 | 1.0–2.0 | 1199 | $1,524 | $1.27 | 23d | 6 | 1.41mi |
| 2870 Harrison Ave Panama City, FL | 1.0–3.0 | 1.0–2.0 | 1230 | $1,540 | $1.25 | 23d | 1 | 1.45mi |
Listing history 27 events
-
2026-06-21days on market $219,900 Active 64 DOM
-
2026-06-19days on market $219,900 Active 62 DOM
-
2026-06-18days on market $219,900 Active 61 DOM
-
2026-06-17days on market $219,900 Active 60 DOM
-
2026-06-16days on market $219,900 Active 59 DOM
-
2026-06-15days on market $219,900 Active 58 DOM
-
2026-06-14days on market $219,900 Active 56 DOM
-
2026-06-13days on market $219,900 Active 55 DOM
-
2026-06-10days on market $219,900 Active 53 DOM
-
2026-06-09days on market $219,900 Active 52 DOM
-
2026-06-08days on market $219,900 Active 51 DOM
-
2026-06-07days on market $219,900 Active 50 DOM
-
2026-06-05days on market $219,900 Active 47 DOM
-
2026-06-03days on market $219,900 Active 46 DOM
-
2026-06-02days on market $219,900 Active 45 DOM
-
2026-06-01days on market $219,900 Active 44 DOM
-
2026-05-31days on market $219,900 Active 43 DOM
-
2026-05-30days on market $219,900 Active 42 DOM
-
2026-05-11price $219,900 1214-char remark
-
2026-04-18$225,000 Active 1214-char remark
-
2021-12-14historical
-
2014-09-09soldstatus $63,500
-
2014-09-07soldstatus $63,000
Show marketing remark (518 chars)
Neat and clean townhome located adjacent to Publix shopping in Lynn Haven with easy access to Hwy 77interior features new paint, laminate flooring, tile flooring, dining area, living area with Bay Window, kitchen with breakfast area, and . 5 bathexterior features newer roof and siding, covered patio overlooking fenced back yard, and termite bond. Sold As Is. All information is estimated including measurements, age, square footage, and school zones. Click pic for additional photos, virtual tour, and homes website.
-
2014-09-02$65,000
Show marketing remark (518 chars)
Neat and clean townhome located adjacent to Publix shopping in Lynn Haven with easy access to Hwy 77interior features new paint, laminate flooring, tile flooring, dining area, living area with Bay Window, kitchen with breakfast area, and . 5 bathexterior features newer roof and siding, covered patio overlooking fenced back yard, and termite bond. Sold As Is. All information is estimated including measurements, age, square footage, and school zones. Click pic for additional photos, virtual tour, and homes website.
-
2014-01-31$65,000
-
1998-05-01soldstatus $39,500
-
1994-09-01soldstatus $33,000
ⓘ Source: listings_history table (triggers on properties + properties_extension) + one-shot
backfill from property_details.listing_events for pre-trigger history.
Tax reassessment forecast FL · Resets to sale price
- Current annual tax
- $1,583 · $132/mo
- Projected year-2 tax
- $1,825 · $152/mo
- Expected delta
- +$242/yr (+$20/mo · 15.3%)
ⓘ Screening estimate from a state-policy table — verify with the county assessor before closing.
Climate risk First Street
- Flood 1/10 Low FEMA zone X (unshaded) · 0% chance over 30 yrs
- Wildfire 2/10 Low
- Heat 10/10 Extreme 7 d/yr ≥104°F today · 22 d/yr by 30 yrs out
- Wind 9/10 Extreme 99% chance of damaging wind over 30 yrs
- Air quality 1/10 Low 0 unhealthy d/yr today · 0 by 30 yrs out
Nearby sold comps map
Loading sold comps map…
Walkable amenities ~0.75 mi
Loading nearby amenities…
Taxation est. · year 1
- Rental income
- $19,658
- − Mortgage interest
- −$12,318
- − Property taxes
- −$1,583
- − Insurance
- −$1,100
- − Repairs & maintenance
- −$1,573
- − Management
- −$1,573
- − Depreciation
- −$6,397
- Taxable loss
- −$4,885
- Est. tax savings @ 24.0%
- +$1,172
- After-tax cash flow
- $181/yr
For passive investors: Depreciation is non-cash, so a rental often shows a tax loss while cash-flowing — sheltering income. Rental losses are passive: they offset passive income freely, and up to $25,000/yr can offset ordinary (W-2) income if you actively participate and your MAGI is under $100k (phasing out to $0 by $150k); unused losses carry forward. On sale, claimed depreciation is recaptured at up to 25%, and gains may owe capital-gains tax (a 1031 exchange can defer both). Figures are a year-1 estimate at your 24.0% rate — not tax advice; consult a CPA.
Schools (NCES district)
- District
- Bay
- NCES district ID
- 1200090
- Math proficiency
- 51% ▼ -8.00%
- Reading proficiency
- 51% ▼ -7.00%
- Median HH income
- $47,740
- Composite
- 43.41/100
- National rank
- #3014
- State rank
- #29 of 73 in FL
Livability — Lynn Haven
- Score
- 81/100
- State rank
- #96
- US rank
- #1472
Category grades
Schools grade is shown separately in the Schools card above.
Census & demographics
- Census place
- Lynn Haven, FL
- County
- Bay County · 163,593 people
- City population
- 21,459
- Metro
- Panama City, FL
- Population (ZIP)
- 21,459
- Household income
- $83,160
- Rent vs Own
- Severe rent burden
- 430.0
Population outlook (Bay County) Hauer SSP2
- Today (2025)
- 206,264 people
- By 2030
- 217,740 · +5.6%
- By 2040
- 238,738 · +15.7%
- By 2050
- 255,545 · +23.9%
- By 2075
- 288,295 · +39.8%
- By 2100
- 288,638 · +39.9%
Race, ethnicity, and origin ACS 2023
- Neighborhood character
- Predominantly White (75%)
- Race & ethnicity
- White 75% Two or more races 11% Hispanic / Latino 10% Black 6% Asian 3%
- Hispanic origin (detail)
- Mexican 2% Puerto Rican 2%
- Common ancestry
- Lithuanian 3% Romanian 3% Serbian 2%
- Foreign-born
- 10% · Canada, Vietnam, South Korea
- Languages at home
- 87% English-only · Spanish 8% Russian/Polish/Slavic 1% Other Indo-European 1%
Political lean MEDSL · Bay
- 2024 margin
- Solid R (+47.4) · D 25.8% · R 73.1% · Other 1.1%
- 2008→2024 swing
- -6.6pp toward R · 2008: -40.7pp · 2024: -47.4pp
- All cycles
- 2024: R+47.4 2020: R+43.5 2016: R+46.3 2012: R+43.6 2008: R+40.7
Not yet ingested
- Civics
- —
Market trends
- HPI YoY
- ▼ -108.08%
- Current HPI
- 263.5418
- Rent YoY
- ▲ 2.52%
- Metro
- Panama City, FL
- State GDP YoY
- ▲ 3.28%
- F500 in state
- 36
Industry mix (Fortune 500 HQ in FL)
| Industry | F500 HQs | Revenue |
|---|---|---|
| Industrial Technology | 2 | $29B |
|
||
| Insurance | 2 | $17B |
|
||
| Retail | 1 | $60B |
|
||
| Technology Distribution | 1 | $58B |
|
||
| Homebuilding | 1 | $35B |
|
||
| Technology Manufacturing | 1 | $35B |
|
||
Price history
+566.4% since first listed9 events — show timeline
- 2026-05-11 Price Changed $219,900 CPARMLS
- 2026-04-18 Listed $225,000 CPARMLS
- 2021-12-14 Listing Removed — CPARMLS
- 2014-09-09 Sold (Public Records) $63,500 Public Records
- 2014-09-07 Sold (MLS) $63,000 CPARMLS
- 2014-09-02 Listed $65,000 CPARMLS
- 2014-01-31 Listed $65,000 CPARMLS
- 1998-05-01 Sold (Public Records) $39,500 Public Records
- 1994-09-01 Sold (Public Records) $33,000 Public Records
Property tax history
+5.9%/yrLatest (2025): $1,583 · +6.6% YoY. Source: county tax records.
Cash-flow waterfall
monthlySold comps — $/sqft
last 12 mo · ≤1 miLoading sold comps…