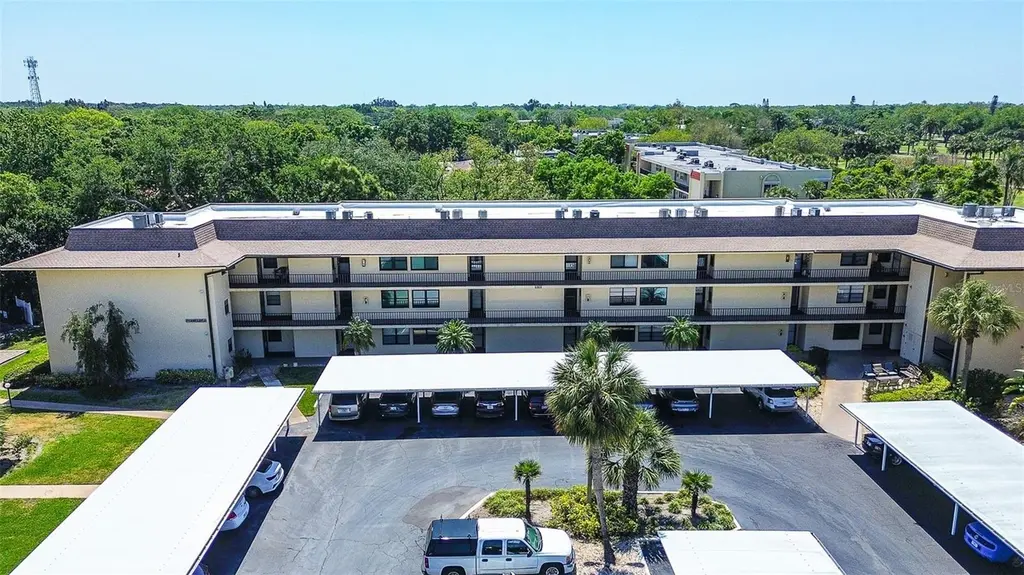
12300 Vonn Rd #7203 · Largo, FL
Flood risk 1/10 · Minimal
- FEMA flood zone
- X (unshaded)
- Chance of flooding over 30 yrs
- 0.0%
- Est. flood insurance / yr
- $507 – $1,088
Fire risk 1/10 · Minimal
- Est. fire insurance / yr
- $947 – $1,759
Heat risk 10/10 · Severe
- Hot days now (above 107°F)
- 7 days/yr
- Hot days in 30 yrs
- 25 days/yr
Wind risk 10/10 · Severe
- Chance of severe wind over 30 yrs
- 99.0%
Air-quality risk 3/10 · Minor
- Unhealthy air days now
- 2 days/yr
- Unhealthy air days in 30 yrs
- 3 days/yr
Risk factors via First Street. Map © Google.
Why this score? — see what drove the C- grade
The composite is a weighted blend of 9 inputs, each scored 0–100. Each bar is that input's sub-score; the figure is the points it added to the 100-point composite (weight × sub-score).
- Cash flow +16.6/30.0
- 1% rule +10.0/10.0
- ARV discount +7.5/15.0
- DSCR +5.2/10.0
- Schools +4.3/10.0
- Livability +4.1/5.0
- Rent growth +3.0/5.0
- Condition / age +2.5/5.0
- Appreciation +0.0/10.0
$145,000
🖨 Deal sheet 📄 Offer letter ✓ Due diligence
Listing remarks
Welcome To Your Slice of Florida Living! This Bright and Beautiful 2-Bedroom, 2-Bath Split Plan Condo Offers 1,045 Square Feet of Comfort and Style. Step Inside to a Refreshed Kitchen and 2 Ensuite Modern Baths Featuring Sleek Walk-In Showers—Perfect for Easy, Everyday Living. Start Your Mornings on the Lanai, Where A Tranquil Brook View Sets the Tone For Relaxed, Coastal Vibes. Just Next Door, You’ll Find a Golf Course with Active Leagues, Making It Easy to Jump Into The Game or Simply Enjoy The Scenery. This Vibrant Community Is All About Connection and Fun. Featuring A Heated Pool, Lively Social Center, And Plenty Of Ways to Stay Active with Tennis And Pickleball. Whether You
Key facts
- $604 HOA
- Parking
- Community pool
Property features AI
Finance
- Other: Association recreation owned; buyer approval required
- Financial info: Lease restrictions apply
- HOA & community: HOA managed by Resource Property Management; Monthly condo fee: $604; Total annual fees: $7,248; Association amenities include clubhouse, pool, pickleball and tennis courts, shuffleboard, recreation facilities, storage, maintenance, laundry, cable TV; Association fees cover cable TV, common area taxes, reserves, insurance, internet, structure and grounds maintenance, management, pest control, pool, recreational facilities, sewer, trash and water; Association approval required for buyers; Senior community; Pets not allowed
Exterior
- Parking: Assigned covered parking; Guest parking; Carport (1 space)
- Security: Buyer/Association approval required for membership
- Utilities: Public water; Public sewer; Electricity connected; Cable available/connected; Water connected; Sewer connected
- Home design: Condominium; Residential property; One-story building; Faces north; Located on second floor (unit is on floor 2)
- Construction: Block construction; Shingle roof; Slab foundation; Completed condition
- Exterior features: Covered, enclosed and screened rear porch; Patio/porch with cover and screens; Rain gutters; Sidewalks; On-site storage; Tennis courts; Mature landscaping; Landscaped and level grounds; Near golf course; Near public transit; Paved surfaces
Interior
- Kitchen: Dishwasher; Disposal; Microwave; Range; Refrigerator; Electric water heater
- Bedrooms: 2 bedrooms
- Flooring: Carpet; Tile; Vinyl
- Bathrooms: 2 full bathrooms
- Heating & cooling: Central heating; Central air conditioning
- Interior features: Built-in features; Ceiling fans; Living room/dining room combo; Split bedroom floor plan; Stone countertops; Walk-in closets; Blinds
- Laundry & utility: Laundry in building (association amenity listed)
Neighborhood map
What this means for you Summary
Snapshot
- This is a 2-bed/2.0-bath condo listed at $145k.
Deal economics
- At list price, monthly cash flow is $87 ($1k/yr) — positive.
- The deal already cash-flows at list — no discount required.
- Meets the 1% rule at list price ($2k rent vs $145k).
- Recommended offer: $136k (6.0% below list) — sets the bar for market timing.
- Cap rate 7.0% vs local median 4.2% in Largo — top-decile yield for the area; either an underpriced asset or a hidden risk that comps aren't pricing in. Stress-test before assuming the spread holds.
Location & tenants
- Location reads 82/100 on livability (#82 in FL, #1,240 nationally) — a professional / high-income tenant draw. Strengths: commute A+, cost of living A+, housing A+; Watch: employment D+, amenities F.
- Pinellas (suburban): math 51% / reading 51% proficiency, ranked #31 of 73 in FL (top 42%) — acceptable for families but not a draw, mixed tenant base, ~2y average lease.
- Zoned schools: Anona Elementary School (math 80% / reading 67%, grade A, #260 of 2,144 statewide, top 13%, 473 students, 45% FRL); Largo High School (math 30% / reading 50%, grade F, #296 of 667 statewide, top 45%, 2,055 students, 53% FRL) — zoned schools at 49% FRL track the district average.
- Market conditions: Rents rising (+2.0%/yr); 209 active listings in the ZIP; 40 comparable units currently listed for rent nearby; rentals at typical pace (median 20d on market — plan ~3-4 weeks tenant-placement turnaround); solid renter incomes; 2,676 units permitted in Pinellas County in 2024 (1,422 in 5+ unit buildings).
- This rent runs 34% of the median local income ($79k/yr) — at the standard rent-burdened threshold; future hikes will face affordability resistance.
Forward outlook
- Local home prices are declining (-3.0%/yr); year-one equity from $1k of loan paydown is wiped out by about $4k of value loss. Plan a longer hold.
- Pinellas County population projected at +14% by 2050 — modest demand growth; plan on rents tracking national, not racing it.
Negotiation context
- It's been on market 81 days — a 6% lower offer ($136k) is reasonable based on typical stale-listing flexibility.
- 4 sale attempts since 3y ago; this cycle's ask has dropped $16k (10%) from the opening price — seller is motivated, your offer sets the floor, not the list.
Risks & watch-outs
- Watch-outs: HOA is 27% of rent.
- Climate carrying-cost: severe wind risk, 99% chance of damaging wind over 30y; extreme-heat days projected 7→25/yr by 2055 (HVAC capex compounding) — expect insurance premiums to compound above CPI over the hold.
Questions for the listing agent
- It's been on market 81 days. Have you received any prior offers? Is the seller open to a 6% concession, seller financing, or rate buy-down credit?
- Built in 1974 — when were the roof, HVAC, electrical panel, plumbing, and water heater last replaced?
- What does the HOA fee cover, when was the last increase, and are there any pending special assessments or reserve-fund shortfalls?
- Any open or pending special assessments — roof, HVAC, plumbing, elevator, façade? What's the per-unit balance and payoff schedule, and is the seller paying it off at close or rolling it to the buyer?
- Why hasn't it sold? Are there any deal-killer items the seller is aware of (foundation, flood, title, zoning, code violations)?
- Is there a deadline driving the sale (1031 exchange, divorce, estate, relocation)? That informs how much negotiation room exists.
- What's the average days-on-market for RENTAL listings here right now (not sales)? A rising rental-DOM trend means longer vacancies and softer asking-rent achievability than the comps imply.
- What's the recent tenant-quality profile in this submarket — average credit score on applications, eviction rate, late-payment / NSF rate, and stable-employment percentage? A property-management company in the area should have these aggregated.
- How much new apartment / multifamily construction is in the pipeline within 1–3 miles? Heavy new supply (>2% of stock underway) typically softens rents 12–24 months out; light construction supports rent growth.
Investment metrics
- 1% rule
- 1.54% ✓
- Cap rate
- 7.02%
- Cash-on-cash
- 2.59%
- DSCR
- 1.12
- GRM
- 5.4
CMA / ARV
No comps found within radius.
Projected returns pro-forma
-3.0% appreciation · 2.01% rent growth · sell at horizon
- IRR
- -13.7%
- Equity multiple
- 0.52×
- Total profit
- $-19,681
- Equity at exit
- $21,620
- IRR
- -7.0%
- Equity multiple
- 0.58×
- Total profit
- $-17,012
- Equity at exit
- $12,537
Cash invested: $40,600 (down + closing). Projections, not guarantees.
Landlord ↔ Tenant lean methodology
- Overall (STATE)
- 87 Strongly Landlord-Friendly
- State Florida
- 87 Strongly Landlord-Friendly · R+3
- County
- — inherits STATE
- City
- — inherits STATE
ZIP-level market 33774
- Rents YoY
- 2.0%
- Active inventory
- 209
- Price-to-rent
- 5.4×
Monthly cashflow live
- Estimated rent
- $2,238 high interval (Pro) →
- Mortgage (P&I)
- −$760
- Tax from tax record
- −$255 /mo · $3,064/yr
- Insurance
- −$60
- HOA
- −$604
- Vacancy / Maint / Mgmt
- −$470
- Net cashflow
- $87
Break-even live
UW: 25.0% down · 7.5% · 30yr · 1.5% tax · 5.0% vac · 8.0% maint · 8.0% mgmt
Financing live
Cash to close
- Down payment
- $36,250
- Closing costs
- $4,350
- Reserves months
- —
- Total cash needed
- —
Loan-product check · same deal, 3 products live
Conventional
25% down · 7.5% · 30yr
- Down + closing
- —
- Monthly P&I
- —
- Monthly cashflow
- —
- DSCR
- —
- Eligible?
- —
Personal DTI + credit; lowest rate.
DSCR
20% down · 8.5% · 30yr
- Down + closing
- —
- Monthly P&I
- —
- Monthly cashflow
- —
- DSCR
- —
- Eligible?
- —
No personal income docs; deal must DSCR.
Hard money
10% down · 12.0% · 12mo
- Down + closing
- —
- Monthly P&I
- —
- Monthly cashflow
- —
- DSCR
- —
- Eligible?
- —
Short-term bridge; refi at stabilization.
Rent comps 40 comps
| Address | Beds | Baths | Sqft | Rent | $/sqft | DOM | Units | Dist |
|---|---|---|---|---|---|---|---|---|
| 12800 Vonn Rd Largo, FL | 1.0–2.0 | 1.0 | 810 | $1,458 | $1.80 | 2d | 16 | 0.35mi |
| 13584 Twig Ter Largo, FL | 3.0 | 2.0 | 1278 | $4,200 | $3.29 | 4d | 1 | 0.36mi |
| 13300 Walsingham Rd Largo, FL | 1.0–4.0 | 1.0–2.0 | 1060 | $1,788 | $1.69 | 24d | 1 | 0.41mi |
| 12497 136th Ln Largo, FL | 3.0 | 2.0 | 1350 | $2,950 | $2.19 | 24d | 1 | 0.43mi |
| 13200 Wilcox Rd Largo, FL | 2.0 | 2.0 | 932 | $1,755 | $1.88 | 3d | 2 | 0.48mi |
| 13125 Wilcox Rd Largo, FL | 1.0–2.0 | 1.0–2.0 | 840 | $1,830 | $2.18 | 1d | 8 | 0.57mi |
| 2503 Mary Sue St SW Largo, FL | 3.0 | 2.0 | 1260 | $2,211 | $1.75 | 13d | 1 | 0.73mi |
| 14130 Rosemary Ln Largo, FL | 2.0 | 1.5 | 880 | $1,725 | $1.96 | 20d | 2 | 0.77mi |
| 2200 Gladys St Largo, FL | 1.0–2.0 | 1.0–1.5 | 677 | $1,595 | $2.35 | 24d | 1 | 0.79mi |
| 2316 Fulton Way Largo, FL | 3.0 | 2.0 | 1209 | $2,699 | $2.23 | 4d | 1 | 0.82mi |
| 9 Jeff Rd Largo, FL | 2.0 | 1.0 | 964 | $2,150 | $2.23 | 4d | 1 | 0.87mi |
| 14283 Sharon Dr Largo, FL | 3.0 | 2.0 | 1314 | $2,590 | $1.97 | 24d | 1 | 0.97mi |
| 3000 Karen Ave Largo, FL | 2.0 | 1.0 | 888 | $2,450 | $2.76 | 21d | 1 | 0.99mi |
| 3000 Karen Ave Largo, FL | 2.0 | 1.0 | 888 | $2,800 | $3.15 | 24d | 1 | 0.99mi |
| 12760 Indian Rocks Rd Largo, FL | 1.0–2.0 | 1.0–2.0 | 923 | $2,500 | $2.71 | 4d | 6 | 1.09mi |
| 14472 Valentine Dr Largo, FL | 2.0 | 2.0 | 1271 | $2,300 | $1.81 | 17d | 1 | 1.10mi |
| 1830 30th Ln SW Largo, FL | 3.0 | 2.0 | 1400 | $2,725 | $1.95 | 13d | 1 | 1.11mi |
| 1884 Pine St Largo, FL | 3.0 | 1.5 | 1012 | $2,499 | $2.47 | 21d | 1 | 1.13mi |
| 13001 120th St Largo, FL | 3.0 | 1.0 | 1044 | $1,950 | $1.87 | 7d | 1 | 1.15mi |
| 3054 Adrian Ave Largo, FL | 2.0 | 1.0 | 1059 | $3,500 | $3.31 | 4d | 1 | 1.17mi |
| 14531 Walsingham Rd Largo, FL | 2.0 | 1.0–2.0 | 657 | $2,600 | $3.96 | 24d | 3 | 1.18mi |
| 11980 133rd Ave Largo, FL | 3.0 | 1.0 | 1200 | $2,150 | $1.79 | 16d | 3 | 1.20mi |
| 11980 133rd Ave Apt 4 Largo, FL | 3.0 | 1.0 | 1200 | $2,150 | $1.79 | 24d | 1 | 1.20mi |
| 1825 134th Ave Largo, FL | 3.0 | 2.0 | 1005 | $2,200 | $2.19 | 24d | 1 | 1.21mi |
| 11960 133rd Ave Largo, FL | 3.0 | 1.0 | 936 | $2,150 | $2.30 | 7d | 1 | 1.21mi |
| 11960 133rd Ave Unit 4 Largo, FL | 3.0 | 1.0 | 1200 | $2,150 | $1.79 | 24d | 1 | 1.21mi |
| 3115 Adrian Ave Largo, FL | 1.0 | 1.0 | 1344 | $1,695 | $1.26 | 4d | 1 | 1.21mi |
| 1635 Gladys St Unit 2 Largo, FL | 3.0 | 1.0 | 1194 | $1,900 | $1.59 | 7d | 1 | 1.22mi |
| 1635 Gladys St Unit 2 Largo, FL | 3.0 | 1.0 | 1200 | $2,000 | $1.67 | 16d | 1 | 1.22mi |
| 11938 133rd Ave Largo, FL | 3.0 | 1.0 | 1200 | $2,150 | $1.79 | 16d | 1 | 1.22mi |
| 11938 133rd Ave Apt 4 Largo, FL | 3.0 | 1.0 | 1200 | $2,150 | $1.79 | 24d | 1 | 1.23mi |
| 1628 Pine St Largo, FL | 1.0 | 1.0 | 850 | $1,650 | $1.94 | 24d | 1 | 1.25mi |
| 11704 127th Ave Largo, FL | 3.0 | 2.0 | 1311 | $2,345 | $1.79 | 4d | 1 | 1.27mi |
| 3223 Dryer Ave Largo, FL | 2.0 | 1.0 | 1000 | $1,800 | $1.80 | 24d | 1 | 1.27mi |
| 1741 Trotter Rd Unit A Largo, FL | 2.0 | 1.0 | 800 | $1,350 | $1.69 | 24d | 1 | 1.29mi |
| 11666 126th Ter Largo, FL | 3.0 | 1.0 | 1056 | $2,183 | $2.07 | 24d | 1 | 1.29mi |
| 1448 Oak St Largo, FL | 2.0 | 2.0 | 1070 | $2,300 | $2.15 | 4d | 1 | 1.39mi |
| 2272 16th Ave SW Unit C Largo, FL | 2.0 | 1.0 | 1031 | $2,600 | $2.52 | 24d | 1 | 1.39mi |
| 1387 Hill Dr Largo, FL | 2.0 | 2.0 | 1450 | $2,850 | $1.97 | 23d | 1 | 1.45mi |
| 1 Windrush Blvd Indian Rocks Beach, FL | 2.0–3.0 | 1.0–2.0 | 1177 | $3,200 | $2.72 | 24d | 2 | 1.45mi |
HOA detail condo
- Monthly dues
- $604 · $7,248/yr
- Likely covers
- pool
- Assessments
- None detected in remarks — confirm with the listing agent.
Listing history 26 events
-
2026-06-18pricedays on market $145,000 Active 81 DOM
-
2026-06-17days on market $161,000 Active 80 DOM
-
2026-06-16days on market $161,000 Active 79 DOM
-
2026-06-15days on market $161,000 Active 78 DOM
-
2026-06-13days on market $161,000 Active 76 DOM
-
2026-06-09days on market $161,000 Active 72 DOM
-
2026-06-08days on market $161,000 Active 71 DOM
-
2026-06-07days on market $161,000 Active 70 DOM
-
2026-06-04days on market $161,000 Active 67 DOM
-
2026-06-03days on market $161,000 Active 66 DOM
-
2026-06-01days on market $161,000 Active 64 DOM
-
2026-05-31days on market $161,000 Active 63 DOM
-
2026-03-29$161,000 Active
-
2025-03-12historical
-
2025-03-11price $174,900
-
2025-03-07price $176,900
-
2025-03-01price $178,900
-
2025-02-21price $180,900
-
2025-02-17price $182,900
-
2025-02-10$184,900 Active
-
2024-07-26historical
-
2024-06-07$194,900 Active
-
2024-03-31historical
-
2023-11-13price $210,000
-
2023-09-24price $249,000
-
2023-09-24$229,000 Active
ⓘ Source: listings_history table (triggers on properties + properties_extension) + one-shot
backfill from property_details.listing_events for pre-trigger history.
Tax reassessment forecast FL · Resets to sale price
- Current annual tax
- $3,064 · $255/mo
- Projected year-2 tax
- $3,064 · $255/mo
- Expected delta
- $0/yr ($0/mo · 0.0%)
ⓘ Screening estimate from a state-policy table — verify with the county assessor before closing.
Climate risk First Street
- Flood 1/10 Low FEMA zone X (unshaded) · 0% chance over 30 yrs
- Wildfire 1/10 Low
- Heat 10/10 Extreme 7 d/yr ≥107°F today · 25 d/yr by 30 yrs out
- Wind 10/10 Extreme 99% chance of damaging wind over 30 yrs
- Air quality 3/10 Moderate 2 unhealthy d/yr today · 3 by 30 yrs out
Nearby sold comps map
Loading sold comps map…
Walkable amenities ~0.75 mi
Loading nearby amenities…
Taxation est. · year 1
- Rental income
- $26,850
- − Mortgage interest
- −$8,122
- − Property taxes
- −$3,064
- − Insurance
- −$725
- − Repairs & maintenance
- −$2,148
- − Management
- −$2,148
- − HOA
- −$7,248
- − Depreciation
- −$4,218
- Taxable loss
- −$823
- Est. tax savings @ 24.0%
- +$198
- After-tax cash flow
- $1,247/yr
For passive investors: Depreciation is non-cash, so a rental often shows a tax loss while cash-flowing — sheltering income. Rental losses are passive: they offset passive income freely, and up to $25,000/yr can offset ordinary (W-2) income if you actively participate and your MAGI is under $100k (phasing out to $0 by $150k); unused losses carry forward. On sale, claimed depreciation is recaptured at up to 25%, and gains may owe capital-gains tax (a 1031 exchange can defer both). Figures are a year-1 estimate at your 24.0% rate — not tax advice; consult a CPA.
Schools (NCES district)
- District
- Pinellas
- NCES district ID
- 1201560
- Math proficiency
- 51% ▼ -5.00%
- Reading proficiency
- 51% ▼ -3.00%
- Median HH income
- $46,270
- Composite
- 43.27/100
- National rank
- #3046
- State rank
- #31 of 73 in FL
Livability — Largo
- Score
- 82/100
- State rank
- #82
- US rank
- #1240
Category grades
Schools grade is shown separately in the Schools card above.
Census & demographics
- Census place
- Largo, FL
- County
- Pinellas County · 939,478 people
- City population
- 106,311
- Metro
- Tampa-St. Petersburg-Clearwater, FL
- Population (ZIP)
- 19,799
- Household income
- $79,139
- Rent vs Own
- Severe rent burden
- 546.0
Population outlook (Pinellas County) Hauer SSP2
- Today (2025)
- 1,027,532 people
- By 2030
- 1,063,586 · +3.5%
- By 2040
- 1,125,020 · +9.5%
- By 2050
- 1,168,637 · +13.7%
- By 2075
- 1,265,188 · +23.1%
- By 2100
- 1,260,357 · +22.7%
Race, ethnicity, and origin ACS 2023
- Neighborhood character
- Predominantly White (74%)
- Race & ethnicity
- White 74% Black 11% Hispanic / Latino 9% Two or more races 7%
- Hispanic origin (detail)
- Mexican 2% Puerto Rican 3% Cuban 2%
- Common ancestry
- Romanian 7% Lithuanian 4% Hispanic 2%
- Foreign-born
- 8% · Canada
- Languages at home
- 91% English-only · Spanish 4% French/Haitian/Cajun 2% Russian/Polish/Slavic 1%
Political lean MEDSL · Pinellas
- 2024 margin
- Lean R (+5.2) · D 46.9% · R 52.1%
- 2008→2024 swing
- -13.5pp toward R · 2008: 8.3pp · 2024: -5.2pp
- All cycles
- 2024: R+5.2 2020: D+0.2 2016: R+1.1 2012: D+5.6 2008: D+8.3
Not yet ingested
- Civics
- —
Market trends
- HPI YoY
- ▼ -383.61%
- Current HPI
- 336.629
- Rent YoY
- ▲ 2.01%
- Metro
- Tampa-St. Petersburg-Clearwater, FL
- State GDP YoY
- ▲ 3.28%
- F500 in state
- 36
Industry mix (Fortune 500 HQ in FL)
| Industry | F500 HQs | Revenue |
|---|---|---|
| Industrial Technology | 2 | $29B |
|
||
| Insurance | 2 | $17B |
|
||
| Retail | 1 | $60B |
|
||
| Technology Distribution | 1 | $58B |
|
||
| Homebuilding | 1 | $35B |
|
||
| Technology Manufacturing | 1 | $35B |
|
||
Price history
-29.7% since first listed14 events — show timeline
- 2026-03-29 Listed $161,000 Stellar MLS as Distributed by MLS Grid
- 2025-03-12 Listing Removed — Stellar MLS as Distributed by MLS Grid
- 2025-03-11 Price Changed $174,900 Stellar MLS as Distributed by MLS Grid
- 2025-03-07 Price Changed $176,900 Stellar MLS as Distributed by MLS Grid
- 2025-03-01 Price Changed $178,900 Stellar MLS as Distributed by MLS Grid
- 2025-02-21 Price Changed $180,900 Stellar MLS as Distributed by MLS Grid
- 2025-02-17 Price Changed $182,900 Stellar MLS as Distributed by MLS Grid
- 2025-02-10 Listed $184,900 Stellar MLS as Distributed by MLS Grid
- 2024-07-26 Listing Removed — Stellar MLS as Distributed by MLS Grid
- 2024-06-07 Listed $194,900 Stellar MLS as Distributed by MLS Grid
- 2024-03-31 Listing Removed — Stellar MLS as Distributed by MLS Grid
- 2023-11-13 Price Changed $210,000 Stellar MLS as Distributed by MLS Grid
- 2023-09-24 Price Changed $249,000 Stellar MLS as Distributed by MLS Grid
- 2023-09-24 Listed $229,000 Stellar MLS as Distributed by MLS Grid
Property tax history
+9.2%/yrLatest (2025): $3,064 · +2.0% YoY. Source: county tax records.
Cash-flow waterfall
monthlySold comps — $/sqft
last 12 mo · ≤1 miLoading sold comps…