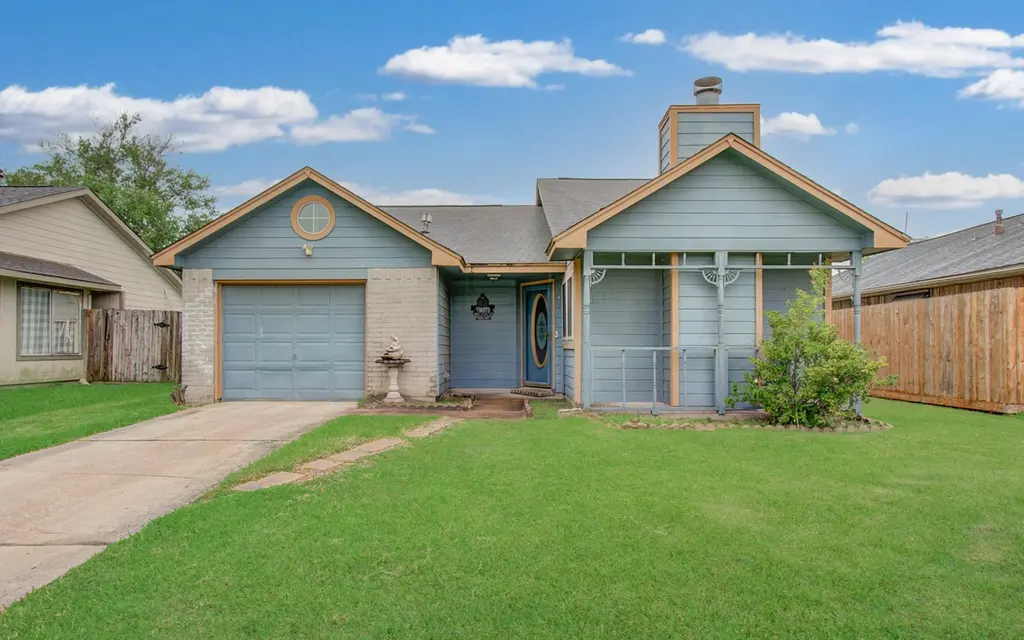
1427 Dell Dale St · Channelview, TX
Flood risk 1/10 · Minimal
- FEMA flood zone
- X (unshaded)
- Chance of flooding over 30 yrs
- 0.0%
- Est. flood insurance / yr
- $507 – $1,088
Fire risk 4/10 · Minor
- Est. fire insurance / yr
- $1,222 – $2,270
Heat risk 9/10 · Severe
- Hot days now (above 109°F)
- 7 days/yr
- Hot days in 30 yrs
- 24 days/yr
Wind risk 9/10 · Severe
- Chance of severe wind over 30 yrs
- 99.0%
Air-quality risk 2/10 · Minimal
- Unhealthy air days now
- 2 days/yr
- Unhealthy air days in 30 yrs
- 2 days/yr
Risk factors via First Street. Map © Google.
Why this score? — see what drove the C+ grade
The composite is a weighted blend of 9 inputs, each scored 0–100. Each bar is that input's sub-score; the figure is the points it added to the 100-point composite (weight × sub-score).
- Cash flow +22.5/30.0
- ARV discount +13.1/15.0
- DSCR +7.2/10.0
- 1% rule +6.6/10.0
- Rent growth +5.0/5.0
- Livability +3.3/5.0
- Schools +2.5/10.0
- Condition / age +2.5/5.0
- Appreciation +0.0/10.0
$149,000
🖨 Deal sheet (PDF) 📄 Offer letter ✓ Due diligence
Listing remarks
Step into a cozy, functional home that’s ready for your personal touch. This 3-bedroom, 2-bath single-story offers 968 square feet with a practical, easy-to-live-in layout and upgraded dual-pane vinyl windows for added comfort and efficiency. Inside, the living spaces are perfectly suited for fresh paint and new flooring, giving you a simple way to update the look and feel to match your style. The fenced backyard includes a storage shed and room for outdoor seating, gardening, or pets, while the one-car garage with automatic opener provides convenient parking and extra storage. Located off a major thoroughfare, the home offers quick access to shopping, dining, and key commuter routes,
Key facts
- Outdoor seating
- Key commuter routes
- Storage shed
Tags
Property features AI
Finance
- HOA & community: Community association (Sterling Green CIA) with an annual fee of $270
Exterior
- Parking: Attached garage (1 space)
- Security: Smoke detector(s)
- Utilities: Public water; Public sewer
- Home design: Residential property; Faces east; Single-story entry (all main rooms listed on the first level)
- Construction: Built in 1983; Cement siding and wood siding; Composition roof; Slab foundation
- Exterior features: Private yard; Subdivision lot
Interior
- Kitchen: Dishwasher; Gas range; Electric oven; Microwave; Disposal; Oven
- Bedrooms: Primary bedroom (First level) — 16x13; Bedroom (First level) — 12x10; Bedroom (First level) — 10x10
- Flooring: Laminate; Tile
- Bathrooms: 2 full bathrooms; Primary bathroom (First level) — 5x11; Bathroom (First level) — 5x8
- Heating & cooling: Central heating (gas); Central electric air conditioning
- Interior features: Kitchen/family room combo; Tub with shower; Combined living and dining area; Gas fireplace with gas log; Smoke detector(s)
- Laundry & utility: Washer hookup; Electric dryer hookup; Gas dryer hookup
Neighborhood map
What this means for you Summary
Snapshot
- This is a 3-bed/2.0-bath single-family listed at $149k.
Deal economics
- At list price, monthly cash flow is $250 ($3k/yr) — positive.
- The deal already cash-flows at list — no discount required.
- Meets the 1% rule at list price ($2k rent vs $149k).
- Recommended offer: $147k (1.5% below list) — sets the bar for market timing.
- Cap rate 8.3% vs local median 4.7% in Channelview — top-decile yield for the area; either an underpriced asset or a hidden risk that comps aren't pricing in. Stress-test before assuming the spread holds.
Location & tenants
- Location reads 66/100 on livability (#598 in TX) — a middle-class / working-renter tenant base. Strengths: cost of living A+, housing A+; Watch: crime F, amenities F, commute F.
- Channelview ISD (suburban): math 27% / reading 30% proficiency, ranked #640 of 826 in TX (top 78%) — low school quality limits family demand, transient renter base, plan for 1-2y turnover; 70% free/reduced lunch — lower-income household profile, screen leases tightly.
- Zoned schools: B H Hamblen El (math 30% / reading 32%, grade F, #2,429 of 4,322 statewide, top 57%, 954 students, 83% FRL); Aguirre J H (math 24% / reading 28%, grade F, #1,222 of 1,662 statewide, top 74%, 975 students, 76% FRL); Channelview H S (math 24% / reading 35%, grade F, #1,112 of 1,632 statewide, top 70%, 2,893 students, 87% FRL).
- Market conditions: Rents rising fast (+16.9%/yr); 100 active listings in the ZIP; 4 comparable units currently listed for rent nearby; rentals leasing fast (median 12d on market — plan ~1-2 weeks tenant-placement turnaround); 29,883 units permitted in Harris County in 2024 (8,621 in 5+ unit buildings).
- This rent runs 33% of the median local income ($62k/yr) — at the standard rent-burdened threshold; future hikes will face affordability resistance.
Forward outlook
- Local home prices are declining (-3.0%/yr); year-one equity from $1k of loan paydown is wiped out by about $4k of value loss. Plan a longer hold.
- Harris County population projected at +47% by 2050 — long-run rental-demand tailwind backs the buy-and-hold thesis.
- At projected returns (-3.0% appreciation + 8.0% rent growth), your $42k cash investment doubles in ~8 years — after that, you're playing with house money.
Negotiation context
- It's been on market 24 days — a 2% lower offer ($147k) is reasonable based on typical stale-listing flexibility.
- Current owner paid $25k; list at $149k implies a 496% gain — meaningful room to come down on a strong offer.
Risks & watch-outs
- Climate carrying-cost: severe wind risk, 99% chance of damaging wind over 30y; extreme-heat days projected 7→24/yr by 2055 (HVAC capex compounding) — expect insurance premiums to compound above CPI over the hold.
Questions for the listing agent
- What does the HOA fee cover, when was the last increase, and are there any pending special assessments or reserve-fund shortfalls?
- Is there a deadline driving the sale (1031 exchange, divorce, estate, relocation)? That informs how much negotiation room exists.
- Schools are D-rated, which usually means shorter tenancies and higher turnover. Who's the typical renter profile here, and what's been the actual vacancy rate?
- Crime grade is F in this area — have there been break-ins, vandalism, or insurance claims at this property in the last 3 years? What carrier currently insures it and at what premium?
- What's the average days-on-market for RENTAL listings here right now (not sales)? A rising rental-DOM trend means longer vacancies and softer asking-rent achievability than the comps imply.
- What's the recent tenant-quality profile in this submarket — average credit score on applications, eviction rate, late-payment / NSF rate, and stable-employment percentage? A property-management company in the area should have these aggregated.
- How much new for-sale + rental construction is in the pipeline within 1–3 miles? Heavy new supply typically softens prices + rents 12–24 months out; constrained supply supports both.
Investment metrics
- 1% rule
- 1.16% ✓
- Cap rate
- 8.31%
- Cash-on-cash
- 7.19%
- DSCR
- 1.32
- GRM
- 7.2
CMA / ARV
- ARV (on-the-fly)
- $170,368
- Comps found
- 5
Show comp detail 5 sales within ~0.75 mi
| Address | Dist | Beds/Ba | Sqft | Sold | Price | $/sf | Match |
|---|---|---|---|---|---|---|---|
| 1331 Dell Dale St | 0.23mi | 3/2.0 | 924 (-4%) | 23mo | $169,500 | $183 | 63 |
| 1131 Somercotes Ln | 0.60mi | 2/1.0 (-1) | 946 (-2%) | 1mo | $150,000 | $159 | 59 |
| 15239 Peachmeadow Ln | 0.21mi | 3/2.0 | 1,099 (+14%) | 23mo | $190,000 | $173 | 49 |
| 1115 Littleport Ln | 0.69mi | 3/1.5 | 1,020 (+5%) | 20mo | $179,900 | $176 | 40 |
| 1106 Holbech Ln | 0.72mi | 2/1.0 (-1) | 826 (-15%) | 21mo | $195,000 | $236 | 16 |
Match score weights: distance 35% · size 25% · config 20% · recency 20%. Top-matched comps best support the ARV.
Projected returns pro-forma
-3.0% appreciation · 8.0% rent growth · sell at horizon
- IRR
- 0.6%
- Equity multiple
- 1.02×
- Total profit
- $1,014
- Equity at exit
- $22,216
- IRR
- 15.0%
- Equity multiple
- 2.52×
- Total profit
- $63,361
- Equity at exit
- $12,883
Cash invested: $41,720 (down + closing). Projections, not guarantees.
Landlord ↔ Tenant lean methodology
- Overall (STATE)
- 87 Strongly Landlord-Friendly
- State Texas
- 87 Strongly Landlord-Friendly · R+5
- County
- — inherits STATE
- City
- — inherits STATE
ZIP-level market 77530
- Rents YoY
- 16.9%
- Active inventory
- 100
- Price-to-rent
- 7.2×
Monthly cashflow live
- Estimated rent
- $1,731 medium interval (Pro) →
- Mortgage (P&I)
- −$781
- Tax from tax record
- −$251 /mo · $3,014/yr
- Insurance
- −$62
- HOA
- −$23
- Vacancy / Maint / Mgmt
- −$364
- Net cashflow
- $250
Break-even live
Sensitivity live
| Price | -10% $334 | -5% $292 | +0% $250 | +5% $208 | +10% $166 |
|---|---|---|---|---|---|
| Rent | -10% $113 | -5% $182 | +0% $250 | +5% $318 | +10% $387 |
| Rate | -1.0pp $325 | -0.5pp $288 | base $250 | +0.5pp $211 | +1.0pp $172 |
UW: 25.0% down · 7.5% · 30yr · 1.5% tax · 5.0% vac · 8.0% maint · 8.0% mgmt
Financing live
Cash to close
- Down payment
- $37,250
- Closing costs
- $4,470
- Reserves months
- —
- Total cash needed
- —
Loan-product check · same deal, 3 products live
Conventional
25% down · 7.5% · 30yr
- Down + closing
- —
- Monthly P&I
- —
- Monthly cashflow
- —
- DSCR
- —
- Eligible?
- —
Personal DTI + credit; lowest rate.
DSCR
20% down · 8.5% · 30yr
- Down + closing
- —
- Monthly P&I
- —
- Monthly cashflow
- —
- DSCR
- —
- Eligible?
- —
No personal income docs; deal must DSCR.
Hard money
10% down · 12.0% · 12mo
- Down + closing
- —
- Monthly P&I
- —
- Monthly cashflow
- —
- DSCR
- —
- Eligible?
- —
Short-term bridge; refi at stabilization.
Rent comps 4 comps
| Address | Beds | Baths | Sqft | Rent | $/sqft | DOM | Units | Dist |
|---|---|---|---|---|---|---|---|---|
| 6160 E Sam Houston Pkwy N Unit 6197 Houston, TX | 2.0 | 2.0 | 1033 | $1,640 | $1.59 | 12d | 1 | 1.47mi |
| 6160 E Sam Houston Pkwy N Unit 424 Houston, TX | 2.0 | 2.0 | 1033 | $1,616 | $1.56 | 7d | 1 | 1.47mi |
| 6160 E Sam Houston Pkwy N Unit 425 Houston, TX | 2.0 | 2.0 | 1033 | $1,600 | $1.55 | 0d | 1 | 1.47mi |
| 6160 E Sam Houston Pkwy N Unit 6217 Houston, TX | 2.0 | 2.0 | 923 | $1,294 | $1.40 | 14d | 1 | 1.47mi |
HOA detail
- Monthly dues
- $23 · $276/yr
Listing history 17 events
-
2026-06-17status $149,000 Pending 24 DOM
-
2026-06-17days on market $149,000 Active Under Contract 24 DOM
-
2026-06-16days on market $149,000 Active Under Contract 23 DOM
-
2026-06-15days on market $149,000 Active Under Contract 22 DOM
-
2026-06-13days on market $149,000 Active Under Contract 20 DOM
-
2026-06-09days on market $149,000 Active Under Contract 16 DOM
-
2026-06-08days on market $149,000 Active Under Contract 15 DOM
-
2026-06-07days on market $149,000 Active Under Contract 14 DOM
-
2026-06-04days on market $149,000 Active Under Contract 11 DOM
-
2026-06-03days on market $149,000 Active Under Contract 10 DOM
-
2026-06-02days on market $149,000 Active Under Contract 9 DOM
-
2026-06-01days on market $149,000 Active Under Contract 8 DOM
-
2026-05-31days on market $149,000 Active Under Contract 7 DOM
-
2026-05-24$149,000 Active
-
2023-12-07soldstatus
-
2023-12-07soldstatus
-
1990-06-01soldstatus $25,000
ⓘ Source: listings_history table (triggers on properties + properties_extension) + one-shot
backfill from property_details.listing_events for pre-trigger history.
Tax reassessment forecast TX · Resets to sale price
- Current annual tax
- $3,014 · $251/mo
- Projected year-2 tax
- $3,014 · $251/mo
- Expected delta
- $0/yr ($0/mo · 0.0%)
ⓘ Screening estimate from a state-policy table — verify with the county assessor before closing.
Climate risk First Street
- Flood 1/10 Low FEMA zone X (unshaded) · 0% chance over 30 yrs
- Wildfire 4/10 Moderate
- Heat 9/10 Extreme 7 d/yr ≥109°F today · 24 d/yr by 30 yrs out
- Wind 9/10 Extreme 99% chance of damaging wind over 30 yrs
- Air quality 2/10 Low 2 unhealthy d/yr today · 2 by 30 yrs out
Nearby sold comps map
Loading sold comps map…
Walkable amenities ~0.75 mi
Loading nearby amenities…
Taxation est. · year 1
- Rental income
- $20,775
- − Mortgage interest
- −$8,346
- − Property taxes
- −$3,014
- − Insurance
- −$745
- − Repairs & maintenance
- −$1,662
- − Management
- −$1,662
- − HOA
- −$276
- − Depreciation
- −$4,335
- Taxable income
- $736
- Est. tax owed @ 24.0%
- −$177
- After-tax cash flow
- $2,825/yr
For passive investors: Depreciation is non-cash, so a rental often shows a tax loss while cash-flowing — sheltering income. Rental losses are passive: they offset passive income freely, and up to $25,000/yr can offset ordinary (W-2) income if you actively participate and your MAGI is under $100k (phasing out to $0 by $150k); unused losses carry forward. On sale, claimed depreciation is recaptured at up to 25%, and gains may owe capital-gains tax (a 1031 exchange can defer both). Figures are a year-1 estimate at your 24.0% rate — not tax advice; consult a CPA.
Schools (NCES district)
- District
- Channelview ISD
- NCES district ID
- 4813590
- Math proficiency
- 27% ▼ -22.00%
- Reading proficiency
- 30% ▼ -8.00%
- Median HH income
- $52,320
- Composite
- 25.18/100
- National rank
- #7513
- State rank
- #640 of 826 in TX
Livability — Channelview
- Score
- 66/100
- State rank
- #598
- US rank
- #11392
Category grades
Schools grade is shown separately in the Schools card above.
Census & demographics
- Census place
- Channelview, TX
- County
- Harris County · 4,702,590 people
- City population
- 31,527
- Metro
- Houston-The Woodlands-Sugar Land, TX
- Population (ZIP)
- 31,527
- Household income
- $62,195
- Rent vs Own
- Severe rent burden
- 966.0
Population outlook (Harris County) Hauer SSP2
- Today (2025)
- 5,571,493 people
- By 2030
- 6,089,821 · +9.3%
- By 2040
- 7,142,806 · +28.2%
- By 2050
- 8,185,864 · +46.9%
- By 2075
- 10,574,329 · +89.8%
- By 2100
- 12,109,958 · +117.4%
Race, ethnicity, and origin ACS 2023
- Neighborhood character
- Predominantly Hispanic (71%)
- Race & ethnicity
- Hispanic / Latino 71% Two or more races 31% White 16% Black 9% Asian 4% Native American 1%
- Hispanic origin (detail)
- Mexican 61%
- Common ancestry
- Slovak 1% Lithuanian 1%
- Foreign-born
- 33% · Canada, Vietnam, Jamaica
- Languages at home
- 37% English-only · Spanish 60% Other Asian/Pacific 1% Vietnamese 1%
Political lean MEDSL · Harris
- 2024 margin
- Lean D (+5.5) · D 52.0% · R 46.4% · Other 1.6%
- 2008→2024 swing
- +3.9pp toward D · 2008: 1.6pp · 2024: 5.5pp
- All cycles
- 2024: D+5.5 2020: D+13.3 2016: D+12.4 2012: D+0.1 2008: D+1.6
Not yet ingested
- Civics
- —
Market trends
- HPI YoY
- ▼ -172.05%
- Current HPI
- 292.1862
- Rent YoY
- ▲ 16.85%
- Metro
- Houston-The Woodlands-Sugar Land, TX
- State GDP YoY
- ▲ 3.95%
- F500 in state
- 110
Industry mix (Fortune 500 HQ in TX)
| Industry | F500 HQs | Revenue |
|---|---|---|
| Energy | 16 | $1,198B |
|
||
| Technology | 5 | $198B |
|
||
| Engineering / Construction | 4 | $72B |
|
||
| Energy Services | 3 | $60B |
|
||
| Utilities | 3 | $41B |
|
||
| Healthcare | 2 | $330B |
|
||
Price history
+496.0% since first listed4 events — show timeline
- 2026-05-24 Listed $149,000 HARMLS
- 2023-12-07 Sold (Public Records) — Public Records
- 2023-12-07 Sold (Public Records) — Public Records
- 1990-06-01 Sold (Public Records) $25,000 Public Records
Property tax history
+2.4%/yrLatest (2025): $3,014 · -1.8% YoY. Source: county tax records.
Cash-flow waterfall
monthlySold comps — $/sqft
last 12 mo · ≤1 miLoading sold comps…