7350 N Inkster Rd #118 · Dearborn Heights, MI
Flood risk No data
- FEMA flood zone
- —
- Chance of flooding over 30 yrs
- —
- Est. flood insurance / yr
- —
Fire risk No data
- Est. fire insurance / yr
- —
Heat risk No data
- Hot days now (above threshold)
- —
- Hot days in 30 yrs
- —
Wind risk No data
- Chance of severe wind over 30 yrs
- —
Air-quality risk No data
- Unhealthy air days now
- —
- Unhealthy air days in 30 yrs
- —
Risk factors via First Street. Map © Google.
Why this score? — see what drove the D grade
The composite is a weighted blend of 9 inputs, each scored 0–100. Each bar is that input's sub-score; the figure is the points it added to the 100-point composite (weight × sub-score).
- Cash flow +11.0/30.0
- 1% rule +9.2/10.0
- ARV discount +7.5/15.0
- Livability +4.0/5.0
- DSCR +3.2/10.0
- Schools +3.2/10.0
- Rent growth +2.6/5.0
- Condition / age +2.5/5.0
- Appreciation +0.0/10.0
$75,000
🖨 Deal sheet (PDF) 📄 Offer letter ✓ Due diligence
Listing remarks MLS
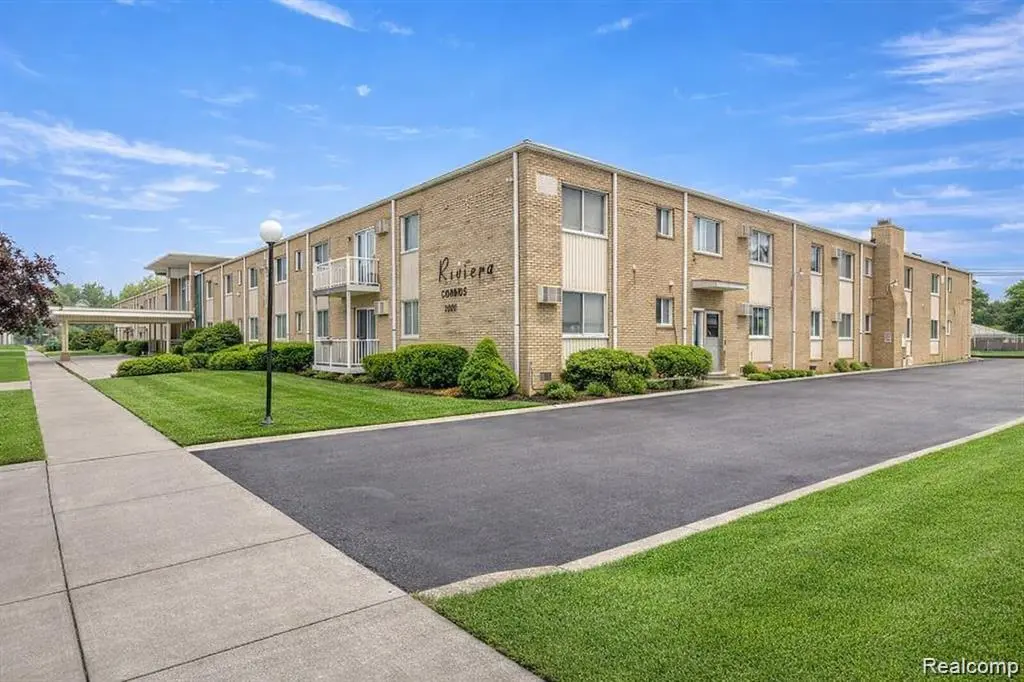
Welcome to Unit 118 at the Riviera Condominiums, located at 7350 Inkster Road in Dearborn Heights. This updated condo offers comfortable and affordable living. The unit features new flooring, fresh paint, and an updated bathroom, along with a bright living area that flows into a functional kitchen with included appliances. The building offers secured entry, shared laundry facilities, and additional basement storage. Residents can also enjoy the in-ground community pool, and the association covers exterior maintenance, water, and heat. Buyer and buyer’s agent to verify all information.
Key facts
- Functional kitchen
- Bright living area
- Updated bathroom
Tags
Neighborhood map
What this means for you Summary
Snapshot
- This is a 1-bed/1.0-bath condo listed at $75k.
Deal economics
- At list price, monthly cash flow is $-32 ($-386/yr) — negative.
- To cash-flow at today's rent, offer at most $69k (7.6% below list).
- Meets the 1% rule at list price ($1k rent vs $75k).
- Recommended offer: $69k (7.6% below list) — sets the bar for cash-flow.
Location & tenants
- Location reads 79/100 on livability (#82 in MI, #1,885 nationally) — a middle-class / working-renter tenant base. Strengths: commute A+, cost of living A+, housing A+; Watch: crime D+, employment D+, health & safety D+.
- Crestwood School District (suburban): math 32% / reading 43% proficiency, ranked #242 of 540 in MI (top 45%) — families likely to look elsewhere, expect single-tenant / working-renter base with shorter leases.
- Zoned schools: Riverside Middle School (math 37% / reading 57%, grade D+, #143 of 493 statewide, top 30%, 1,172 students, 78% FRL); Crestwood High School (math 36% / reading 48%, grade F, #264 of 713 statewide, top 41%, 1,336 students, 72% FRL) — zoned schools average 75% FRL vs 59% district-wide (16 pts higher); higher-poverty schools than district average — tighter screening recommended.
- Market conditions: Rents flat; 148 active listings in the ZIP; 3 comparable units currently listed for rent nearby; rentals leasing fast (median 1d on market — plan ~1-2 weeks tenant-placement turnaround); 2,639 units permitted in Wayne County in 2024 (1,216 in 5+ unit buildings).
Forward outlook
- Local home prices are declining (-3.0%/yr); year-one equity from $519 of loan paydown is wiped out by about $2k of value loss. Plan a longer hold.
- Wayne County population projected at -17% by 2050 — secular population decline; favor cash flow + early exit over multi-decade hold.
Negotiation context
- It's been on market 74 days — a 6% lower offer ($70k) is reasonable based on typical stale-listing flexibility.
- 4 sale attempts since 20y ago with the ask held roughly flat each time — persistent listings suggest the price (not the market) is what's stuck; bring a comps-based counter.
- Current owner paid $45k; list at $75k implies a 67% gain — meaningful room to come down on a strong offer.
Risks & watch-outs
- Watch-outs: HOA is 36% of rent.
Questions for the listing agent
- What do current leases actually rent for vs. the listed asking? Can we see a recent rent roll and the last 12 months of T-12 income?
- It's been on market 74 days. Have you received any prior offers? Is the seller open to a 8% concession, seller financing, or rate buy-down credit?
- Built in 1964 — when were the roof, HVAC, electrical panel, plumbing, and water heater last replaced?
- What does the HOA fee cover, when was the last increase, and are there any pending special assessments or reserve-fund shortfalls?
- Any open or pending special assessments — roof, HVAC, plumbing, elevator, façade? What's the per-unit balance and payoff schedule, and is the seller paying it off at close or rolling it to the buyer?
- Why hasn't it sold? Are there any deal-killer items the seller is aware of (foundation, flood, title, zoning, code violations)?
- Is there a deadline driving the sale (1031 exchange, divorce, estate, relocation)? That informs how much negotiation room exists.
- Crime grade is D in this area — have there been break-ins, vandalism, or insurance claims at this property in the last 3 years? What carrier currently insures it and at what premium?
- The area grade is low — what's the realistic commute time and amenity access for the typical tenant pool here? Any planned neighborhood developments (good or bad) we should know about?
- What's the average days-on-market for RENTAL listings here right now (not sales)? A rising rental-DOM trend means longer vacancies and softer asking-rent achievability than the comps imply.
- What's the recent tenant-quality profile in this submarket — average credit score on applications, eviction rate, late-payment / NSF rate, and stable-employment percentage? A property-management company in the area should have these aggregated.
- How much new apartment / multifamily construction is in the pipeline within 1–3 miles? Heavy new supply (>2% of stock underway) typically softens rents 12–24 months out; light construction supports rent growth.
Investment metrics
- 1% rule
- 1.42% ✓
- Cap rate
- 5.78%
- Cash-on-cash
- -1.84%
- DSCR
- 0.92
- GRM
- 5.9
CMA / ARV
No comps found within radius.
Projected returns pro-forma
-3.0% appreciation · 0.41% rent growth · sell at horizon
- IRR
- -24.1%
- Equity multiple
- 0.21×
- Total profit
- $-16,678
- Equity at exit
- $11,183
- IRR
- -41.3%
- Equity multiple
- -0.27×
- Total profit
- $-26,769
- Equity at exit
- $6,485
Cash invested: $21,000 (down + closing). Projections, not guarantees.
Landlord ↔ Tenant lean methodology
- Overall (STATE)
- 62 Landlord-Friendly
- State Michigan
- 62 Landlord-Friendly · EVEN
- County
- — inherits STATE
- City
- — inherits STATE
ZIP-level market 48127
- Rents YoY
- 0.4%
- Active inventory
- 148
- Price-to-rent
- 5.9×
Monthly cashflow live
- Estimated rent
- $1,068 medium interval (Pro) →
- Mortgage (P&I)
- −$393
- Tax from tax record
- −$62 /mo · $744/yr
- Insurance
- −$31
- HOA
- −$389
- Vacancy / Maint / Mgmt
- −$224
- Net cashflow
- $-32
Break-even live
Sensitivity live
| Price | -10% $10 | -5% $-11 | +0% $-32 | +5% $-53 | +10% $-75 |
|---|---|---|---|---|---|
| Rent | -10% $-116 | -5% $-74 | +0% $-32 | +5% $10 | +10% $52 |
| Rate | -1.0pp $6 | -0.5pp $-13 | base $-32 | +0.5pp $-52 | +1.0pp $-71 |
UW: 25.0% down · 7.5% · 30yr · 1.5% tax · 5.0% vac · 8.0% maint · 8.0% mgmt
Financing live
Cash to close
- Down payment
- $18,750
- Closing costs
- $2,250
- Reserves months
- —
- Total cash needed
- —
Loan-product check · same deal, 3 products live
Conventional
25% down · 7.5% · 30yr
- Down + closing
- —
- Monthly P&I
- —
- Monthly cashflow
- —
- DSCR
- —
- Eligible?
- —
Personal DTI + credit; lowest rate.
DSCR
20% down · 8.5% · 30yr
- Down + closing
- —
- Monthly P&I
- —
- Monthly cashflow
- —
- DSCR
- —
- Eligible?
- —
No personal income docs; deal must DSCR.
Hard money
10% down · 12.0% · 12mo
- Down + closing
- —
- Monthly P&I
- —
- Monthly cashflow
- —
- DSCR
- —
- Eligible?
- —
Short-term bridge; refi at stabilization.
Rent comps 3 comps
| Address | Beds | Baths | Sqft | Rent | $/sqft | DOM | Units | Dist |
|---|---|---|---|---|---|---|---|---|
| 6954 Inkster Rd Dearborn Heights, MI | 1.0–2.0 | 1.0–1.5 | 837 | $949 | $1.13 | 0d | 9 | 0.26mi |
| 27201 Canfield St W Dearborn Heights, MI | 1.0–2.0 | 1.0–2.0 | 852 | $1,024 | $1.20 | 0d | 21 | 0.74mi |
| 5726 Inkster Rd Dearborn Heights, MI | 1.0 | 1.0 | 630 | $1,050 | $1.67 | 46d | 1 | 0.98mi |
HOA detail condo
- Monthly dues
- $389 · $4,668/yr
- Likely covers
- waterexterior maint.pool
- Assessments
- None detected in remarks — confirm with the listing agent.
Listing history 8 events
-
2026-03-17$75,000 Active 597-char remark
Show marketing remark (591 chars)
Welcome to Unit 118 at the Riviera Condominiums, located at 7350 Inkster Road in Dearborn Heights. This updated condo offers comfortable and affordable living. The unit features new flooring, fresh paint, and an updated bathroom, along with a bright living area that flows into a functional kitchen with included appliances. The building offers secured entry, shared laundry facilities, and additional basement storage. Residents can also enjoy the in-ground community pool, and the association covers exterior maintenance, water, and heat. Buyer and buyer's agent to verify all information.
-
2026-03-17$75,000 Active 591-char remark
Show marketing remark (591 chars)
Welcome to Unit 118 at the Riviera Condominiums, located at 7350 Inkster Road in Dearborn Heights. This updated condo offers comfortable and affordable living. The unit features new flooring, fresh paint, and an updated bathroom, along with a bright living area that flows into a functional kitchen with included appliances. The building offers secured entry, shared laundry facilities, and additional basement storage. Residents can also enjoy the in-ground community pool, and the association covers exterior maintenance, water, and heat. Buyer and buyer's agent to verify all information.
-
2007-01-30soldstatus $45,000
-
2007-01-30soldstatus $45,000
-
2007-01-15historical
-
2006-07-15$50,000
-
2006-07-15$50,000
-
1991-10-17soldstatus $32,500
ⓘ Source: listings_history table (triggers on properties + properties_extension) + one-shot
backfill from property_details.listing_events for pre-trigger history.
Tax reassessment forecast MI · Partial reset (capped growth)
- Current annual tax
- $744 · $62/mo
- Projected year-2 tax
- $949 · $79/mo
- Expected delta
- +$206/yr (+$17/mo · 27.6%)
ⓘ Screening estimate from a state-policy table — verify with the county assessor before closing.
Nearby sold comps map
Loading sold comps map…
Walkable amenities ~0.75 mi
Loading nearby amenities…
Taxation est. · year 1
- Rental income
- $12,811
- − Mortgage interest
- −$4,201
- − Property taxes
- −$744
- − Insurance
- −$375
- − Repairs & maintenance
- −$1,025
- − Management
- −$1,025
- − HOA
- −$4,668
- − Depreciation
- −$2,182
- Taxable loss
- −$1,409
- Est. tax savings @ 24.0%
- +$338
- After-tax cash flow
- $-48/yr
For passive investors: Depreciation is non-cash, so a rental often shows a tax loss while cash-flowing — sheltering income. Rental losses are passive: they offset passive income freely, and up to $25,000/yr can offset ordinary (W-2) income if you actively participate and your MAGI is under $100k (phasing out to $0 by $150k); unused losses carry forward. On sale, claimed depreciation is recaptured at up to 25%, and gains may owe capital-gains tax (a 1031 exchange can defer both). Figures are a year-1 estimate at your 24.0% rate — not tax advice; consult a CPA.
Schools (NCES district)
- District
- Crestwood School District
- NCES district ID
- 2600016
- Math proficiency
- 32% ▼ -6.00%
- Reading proficiency
- 43% ▼ -4.00%
- Median HH income
- $47,101
- Composite
- 32.1/100
- National rank
- #5806
- State rank
- #242 of 540 in MI
Livability — Dearborn Heights
- Score
- 79/100
- State rank
- #82
- US rank
- #1885
Category grades
Schools grade is shown separately in the Schools card above.
Census & demographics
- Census place
- Dearborn Heights, MI
- County
- Wayne County · 1,562,939 people
- City population
- 61,771
- Metro
- Detroit-Warren-Dearborn, MI
- Population (ZIP)
- 39,646
- Household income
- $60,742
- Rent vs Own
- Severe rent burden
- 1196.0
Population outlook (Wayne County) Hauer SSP2
- Today (2025)
- 1,675,273 people
- By 2030
- 1,620,300 · -3.3%
- By 2040
- 1,502,341 · -10.3%
- By 2050
- 1,384,039 · -17.4%
- By 2075
- 1,124,592 · -32.9%
- By 2100
- 881,193 · -47.4%
Race, ethnicity, and origin ACS 2023
- Neighborhood character
- Predominantly White (85%)
- Race & ethnicity
- White 85% Black 8% Two or more races 3% Hispanic / Latino 3% Asian 2%
- Common ancestry
- Arab 8% Romanian 7% Lithuanian 2%
- Foreign-born
- 31% · Canada
- Languages at home
- 46% English-only · Arabic 45% Russian/Polish/Slavic 2% Other Indo-European 2%
Political lean MEDSL · Wayne
- 2024 margin
- Strong D (+29.0) · D 62.7% · R 33.7% · Other 3.6%
- 2008→2024 swing
- -20.5pp toward R · 2008: 49.5pp · 2024: 29.0pp
- All cycles
- 2024: D+29.0 2020: D+38.1 2016: D+37.3 2012: D+46.9 2008: D+49.5
Not yet ingested
- Civics
- —
Market trends
- HPI YoY
- ▼ -319.04%
- Current HPI
- 225.9407
- Rent YoY
- ▲ 0.41%
- Metro
- Detroit-Warren-Dearborn, MI
- State GDP YoY
- ▲ 1.37%
- F500 in state
- 28
Industry mix (Fortune 500 HQ in MI)
| Industry | F500 HQs | Revenue |
|---|---|---|
| Automotive Parts | 3 | $48B |
|
||
| Automotive | 2 | $372B |
|
||
| Chemicals | 1 | $45B |
|
||
| Automotive Retail | 1 | $29B |
|
||
| Healthcare / Medical Devices | 1 | $23B |
|
||
| Automotive Technology | 1 | $20B |
|
||
Price history
+130.8% since first listed8 events — show timeline
- 2026-03-17 Listed $75,000 REALCOMP
- 2026-03-17 Listed $75,000 MiRealSource-MiMLS
- 2007-01-30 Sold (MLS) $45,000 REALCOMP
- 2007-01-30 Sold (MLS) $45,000 MiRealSource-MiMLS
- 2007-01-15 Listing Removed — MiRealSource-MiMLS
- 2006-07-15 Listed $50,000 REALCOMP
- 2006-07-15 Listed $50,000 MiRealSource-MiMLS
- 1991-10-17 Sold (Public Records) $32,500 Public Records
Property tax history
+3.0%/yrLatest (2025): $744 · -27.6% YoY. Source: county tax records.
Cash-flow waterfall
monthlySold comps — $/sqft
last 12 mo · ≤1 miLoading sold comps…