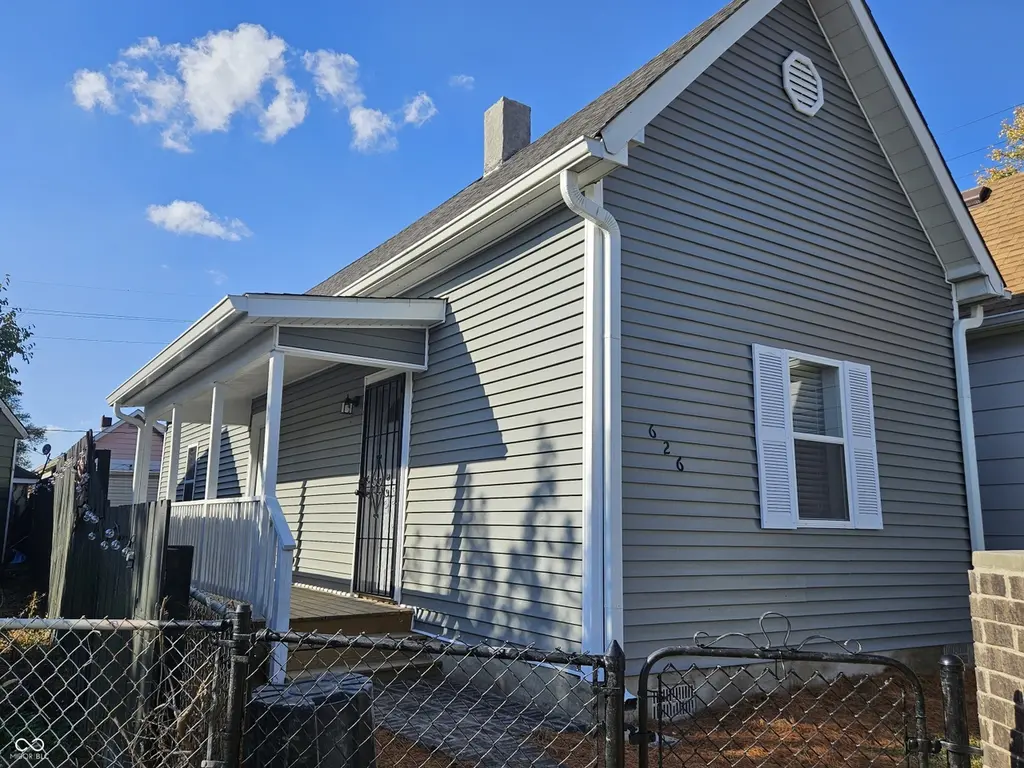
626 Holly Ave · Indianapolis city (balance), IN
Flood risk 3/10 · Minor
- FEMA flood zone
- X
- Chance of flooding over 30 yrs
- 0.2%
- Est. flood insurance / yr
- $507 – $1,088
Fire risk 1/10 · Minimal
- Est. fire insurance / yr
- $717 – $1,331
Heat risk 4/10 · Minor
- Hot days now (above 101°F)
- 7 days/yr
- Hot days in 30 yrs
- 19 days/yr
Wind risk 2/10 · Minimal
- Chance of severe wind over 30 yrs
- 0.0%
Air-quality risk 4/10 · Minor
- Unhealthy air days now
- 5 days/yr
- Unhealthy air days in 30 yrs
- 7 days/yr
Risk factors via First Street. Map © Google.
Why this score? — see what drove the C grade
The composite is a weighted blend of 9 inputs, each scored 0–100. Each bar is that input's sub-score; the figure is the points it added to the 100-point composite (weight × sub-score).
- Cash flow +22.0/30.0
- ARV discount +14.4/15.0
- DSCR +7.0/10.0
- 1% rule +4.8/10.0
- Rent growth +2.9/5.0
- Livability +2.5/5.0
- Condition / age +2.5/5.0
- Schools +1.4/10.0
- Appreciation +0.0/10.0
$132,900
🖨 Deal sheet (PDF) 📄 Offer letter ✓ Due diligence
Listing remarks MLS
Move in Ready Bungalow in Downtown Indy. 1 bedroom, 1 full bath with 675 Sq ft. This home has been totally remodeled inside and out. Brand New HVAC, Lighting, Windows, Raised Ceiling, Interior Paint, Drywall, Exterior Siding, Gas Water Heater, and Vinyl Plank Flooring throughout. Home comes with a stackable washer and dryer. Enjoy sitting on the covered deck overlooking the fenced in yard. Walkable to downtown amenities including Lucas Oil Stadium, Gainbridge Field House, Victory Field, the new Eleven Park, Crane Bay Event Center, the Convention Center, Circle Center Mall and many more of Indy's entertainment scene. This home is perfect for owner occupants, an Airbnb or a college student. This is a must see!!
Key facts
- Covered deck
- Totally remodeled
- Move in ready
Tags
Neighborhood map
What this means for you Summary
Snapshot
- This is a 1-bed/1.0-bath single-family listed at $133k.
Deal economics
- At list price, monthly cash flow is $211 ($3k/yr) — positive.
- The deal already cash-flows at list — no discount required.
- To meet the 1% rule (rent ≥ 1% of price), the offer needs to be $130k (2.3% below list).
- Recommended offer: $117k (12.0% below list) — sets the bar for market timing.
- Cap rate 8.2% vs local median 4.4% in Indianapolis city (balance) — top-decile yield for the area; either an underpriced asset or a hidden risk that comps aren't pricing in. Stress-test before assuming the spread holds.
Location & tenants
- Location reads: area grade C — affects rentability + tenant quality, not the cash-flow math above.
- Indianapolis Public Schools (urban): math 14% / reading 20% proficiency, ranked #286 of 301 in IN (top 95%) — low school quality limits family demand, transient renter base, plan for 1-2y turnover; 77% free/reduced lunch — lower-income household profile, screen leases tightly.
- Zoned schools: William Penn School 49 (math 9% / reading 9%, grade F, #935 of 994 statewide, top 94%, 509 students, 78% FRL); H L Harshman Middle School (math 3% / reading 16%, grade F, #316 of 330 statewide, top 96%, 549 students, 84% FRL); George Washington High School (math 2% / reading 17%, grade F, #366 of 369 statewide, top 99%, 753 students, 68% FRL) — zoned schools at 77% FRL track the district average.
- Market conditions: Rents rising (+1.8%/yr); 43 active listings in the ZIP; 22 comparable units currently listed for rent nearby; rentals leasing fast (median 9d on market — plan ~1-2 weeks tenant-placement turnaround); 1,906 units permitted in Marion County in 2024 (621 in 5+ unit buildings).
Forward outlook
- Local home prices are declining (-3.0%/yr); year-one equity from $919 of loan paydown is wiped out by about $4k of value loss. Plan a longer hold.
- Marion County population projected at +18% by 2050 — long-run rental-demand tailwind backs the buy-and-hold thesis.
Negotiation context
- It's been on market 197 days — a 12% lower offer ($117k) is reasonable based on typical stale-listing flexibility.
Risks & watch-outs
- Watch-outs: built in 1955 — expect roof / HVAC / electrical / plumbing capex.
Questions for the listing agent
- It's been on market 197 days. Have you received any prior offers? Is the seller open to a 12% concession, seller financing, or rate buy-down credit?
- Built in 1955 — when were the roof, HVAC, electrical panel, plumbing, and water heater last replaced?
- Why hasn't it sold? Are there any deal-killer items the seller is aware of (foundation, flood, title, zoning, code violations)?
- Is there a deadline driving the sale (1031 exchange, divorce, estate, relocation)? That informs how much negotiation room exists.
- What's the average days-on-market for RENTAL listings here right now (not sales)? A rising rental-DOM trend means longer vacancies and softer asking-rent achievability than the comps imply.
- What's the recent tenant-quality profile in this submarket — average credit score on applications, eviction rate, late-payment / NSF rate, and stable-employment percentage? A property-management company in the area should have these aggregated.
- How much new for-sale + rental construction is in the pipeline within 1–3 miles? Heavy new supply typically softens prices + rents 12–24 months out; constrained supply supports both.
Investment metrics
- 1% rule
- 0.98% ✗
- Cap rate
- 8.20%
- Cash-on-cash
- 6.81%
- DSCR
- 1.30
- GRM
- 8.5
CMA / ARV
- ARV (median comp)
- $156,853
- List price
- $132,900
- Delta
- -15.27%
- Verdict
- UNDERPRICED
- Comps
- 5 within 1.0 mi
Show comp detail 3 sales within ~0.75 mi
| Address | Dist | Beds/Ba | Sqft | Sold | Price | $/sf | Match |
|---|---|---|---|---|---|---|---|
| 617 Marion Ave | 0.02mi | 1/1.0 | 675 (0%) | 15mo | $166,000 | $246 | 87 |
| 624 Holly Ave | 0.00mi | 1/1.0 | 675 (0%) | 17mo | $155,000 | $230 | 86 |
| 1623 Oliver Ave | 0.57mi | 2/1.0 (+1) | 744 (+10%) | 11mo | $158,000 | $212 | 42 |
Match score weights: distance 35% · size 25% · config 20% · recency 20%. Top-matched comps best support the ARV.
Projected returns pro-forma
-3.0% appreciation · 1.79% rent growth · sell at horizon
- IRR
- -7.1%
- Equity multiple
- 0.74×
- Total profit
- $-9,689
- Equity at exit
- $19,816
- IRR
- 1.0%
- Equity multiple
- 1.07×
- Total profit
- $2,449
- Equity at exit
- $11,491
Cash invested: $37,212 (down + closing). Projections, not guarantees.
Landlord ↔ Tenant lean methodology
- Overall (STATE)
- 90 Strongly Landlord-Friendly
- State Indiana
- 90 Strongly Landlord-Friendly · R+11
- County
- — inherits STATE
- City
- — inherits STATE
ZIP-level market 46221
- Home prices YoY
- -23.7%
- Rents YoY
- 1.8%
- Active inventory
- 43
- Price-to-rent
- 8.5×
Monthly cashflow live
- Estimated rent
- $1,299 high interval (Pro) →
- Mortgage (P&I)
- −$697
- Tax from tax record
- −$63 /mo · $752/yr
- Insurance
- −$55
- HOA
- −$0
- Vacancy / Maint / Mgmt
- −$273
- Net cashflow
- $211
Break-even live
Sensitivity live
| Price | -10% $286 | -5% $249 | +0% $211 | +5% $174 | +10% $136 |
|---|---|---|---|---|---|
| Rent | -10% $109 | -5% $160 | +0% $211 | +5% $263 | +10% $314 |
| Rate | -1.0pp $278 | -0.5pp $245 | base $211 | +0.5pp $177 | +1.0pp $142 |
UW: 25.0% down · 7.5% · 30yr · 1.5% tax · 5.0% vac · 8.0% maint · 8.0% mgmt
Financing live
Cash to close
- Down payment
- $33,225
- Closing costs
- $3,987
- Reserves months
- —
- Total cash needed
- —
Loan-product check · same deal, 3 products live
Conventional
25% down · 7.5% · 30yr
- Down + closing
- —
- Monthly P&I
- —
- Monthly cashflow
- —
- DSCR
- —
- Eligible?
- —
Personal DTI + credit; lowest rate.
DSCR
20% down · 8.5% · 30yr
- Down + closing
- —
- Monthly P&I
- —
- Monthly cashflow
- —
- DSCR
- —
- Eligible?
- —
No personal income docs; deal must DSCR.
Hard money
10% down · 12.0% · 12mo
- Down + closing
- —
- Monthly P&I
- —
- Monthly cashflow
- —
- DSCR
- —
- Eligible?
- —
Short-term bridge; refi at stabilization.
Rent comps 22 comps
| Address | Beds | Baths | Sqft | Rent | $/sqft | DOM | Units | Dist |
|---|---|---|---|---|---|---|---|---|
| 1105 Blaine Ave Indianapolis, IN | 1.0–2.0 | 1.0–2.5 | 1157 | $1,100 | $0.95 | 25d | 1 | 0.56mi |
| 1925 Westview Dr Unit 100 Indianapolis, IN | 1.0 | 1.0 | 600 | $900 | $1.50 | 23d | 1 | 0.91mi |
| 1925 Westview Dr Indianapolis, IN | 1.0 | 1.0 | 600 | $900 | $1.50 | 16d | 2 | 0.92mi |
| 1925 Westview Dr Unit 212 Indianapolis, IN | 1.0 | 1.0 | 600 | $900 | $1.50 | 9d | 1 | 0.92mi |
| 1918 W Washington St Unit 12 Indianapolis, IN | 1.0 | 1.0 | 600 | $950 | $1.58 | 45d | 1 | 1.00mi |
| 305 W Washington St Indianapolis, IN | 1.0 | 1.0 | 717 | $925 | $1.29 | 3d | 1 | 1.06mi |
| 915 S Meridian St Indianapolis, IN | 2.0 | 1.0–2.0 | 829 | $1,918 | $2.31 | 0d | 42 | 1.14mi |
| 501 Madison Ave Indianapolis, IN | 1.0 | 1.0 | 750 | $1,412 | $1.88 | 0d | 1 | 1.23mi |
| 501 Madison Ave Indianapolis, IN | 1.0 | 1.0 | 800 | $1,412 | $1.76 | 25d | 2 | 1.23mi |
| 460 N White River Parkway Dr W Indianapolis, IN | 2.0 | 1.0 | 681 | $1,460 | $2.14 | 0d | 15 | 1.25mi |
| 50 N Illinois St Unit 1534468P Indianapolis, IN | 1.0–5.0 | 1.5–4.0 | 1770 | $2,280 | $1.29 | 0d | 5 | 1.26mi |
| 114 W Market St Indianapolis, IN | 1.0–3.0 | 1.0–2.0 | 1193 | $1,399 | $1.17 | 46d | 9 | 1.27mi |
| 841 S Addison St Indianapolis, IN | 2.0 | 1.0 | 750 | $1,295 | $1.73 | 45d | 1 | 1.29mi |
| 30 E Georgia St Indianapolis, IN | 2.0 | 1.0–2.0 | 947 | $1,366 | $1.44 | 0d | 14 | 1.30mi |
| 1409 Union St Indianapolis, IN | 1.0 | 1.0 | 475 | $749 | $1.58 | 25d | 1 | 1.38mi |
| 229 S Delaware St Indianapolis, IN | 3.0 | 1.0–3.5 | 1207 | $2,498 | $2.07 | 0d | 54 | 1.41mi |
| 632 Doctor Martin Luther King Junior St Indianapolis, IN | — | 1.0 | 444 | $1,100 | $2.48 | 45d | 1 | 1.42mi |
| 632 Doctor Martin Luther King Junior St Indianapolis, IN | 1.0 | 1.0 | 504 | $1,300 | $2.58 | 0d | 2 | 1.42mi |
| 220 N Meridian St Indianapolis, IN | 3.0 | 1.0–3.0 | 1038 | $2,406 | $2.32 | 21d | 28 | 1.43mi |
| 310 W Michigan St Indianapolis, IN | 2.0 | 1.0–2.5 | 1098 | $2,160 | $1.97 | 0d | 20 | 1.46mi |
| 115 N Pennsylvania St Indianapolis, IN | 1.0–2.0 | 1.0 | 858 | $1,199 | $1.40 | 4d | 7 | 1.49mi |
| 401 N Illinois St Indianapolis, IN | 1.0–2.0 | 1.0–2.0 | 625 | $1,365 | $2.18 | 5d | 17 | 1.50mi |
Listing history 4 events
-
2026-04-23price $132,900 724-char remark
Show marketing remark (724 chars)
Move in Ready Bungalow in Downtown Indy. 1 bedroom, 1 full bath with 675 Sq ft. This home has been totally remodeled inside and out. Brand New HVAC, Lighting, Windows, Raised Ceiling, Interior Paint, Drywall, Exterior Siding, Gas Water Heater, and Vinyl Plank Flooring throughout. Home comes with a stackable washer and dryer. Enjoy sitting on the covered deck overlooking the fenced in yard. Walkable to downtown amenities including Lucas Oil Stadium, Gainbridge Field House, Victory Field, the new Eleven Park, Crane Bay Event Center, the Convention Center, Circle Center Mall and many more of Indy's entertainment scene. This home is perfect for owner occupants, an Airbnb or a college student. This is a must see!!
-
2026-02-28price $139,900 724-char remark
Show marketing remark (724 chars)
Move in Ready Bungalow in Downtown Indy. 1 bedroom, 1 full bath with 675 Sq ft. This home has been totally remodeled inside and out. Brand New HVAC, Lighting, Windows, Raised Ceiling, Interior Paint, Drywall, Exterior Siding, Gas Water Heater, and Vinyl Plank Flooring throughout. Home comes with a stackable washer and dryer. Enjoy sitting on the covered deck overlooking the fenced in yard. Walkable to downtown amenities including Lucas Oil Stadium, Gainbridge Field House, Victory Field, the new Eleven Park, Crane Bay Event Center, the Convention Center, Circle Center Mall and many more of Indy's entertainment scene. This home is perfect for owner occupants, an Airbnb or a college student. This is a must see!!
-
2026-01-06price $149,900 724-char remark
Show marketing remark (724 chars)
Move in Ready Bungalow in Downtown Indy. 1 bedroom, 1 full bath with 675 Sq ft. This home has been totally remodeled inside and out. Brand New HVAC, Lighting, Windows, Raised Ceiling, Interior Paint, Drywall, Exterior Siding, Gas Water Heater, and Vinyl Plank Flooring throughout. Home comes with a stackable washer and dryer. Enjoy sitting on the covered deck overlooking the fenced in yard. Walkable to downtown amenities including Lucas Oil Stadium, Gainbridge Field House, Victory Field, the new Eleven Park, Crane Bay Event Center, the Convention Center, Circle Center Mall and many more of Indy's entertainment scene. This home is perfect for owner occupants, an Airbnb or a college student. This is a must see!!
-
2025-11-07$169,900 Active 724-char remark
Show marketing remark (724 chars)
Move in Ready Bungalow in Downtown Indy. 1 bedroom, 1 full bath with 675 Sq ft. This home has been totally remodeled inside and out. Brand New HVAC, Lighting, Windows, Raised Ceiling, Interior Paint, Drywall, Exterior Siding, Gas Water Heater, and Vinyl Plank Flooring throughout. Home comes with a stackable washer and dryer. Enjoy sitting on the covered deck overlooking the fenced in yard. Walkable to downtown amenities including Lucas Oil Stadium, Gainbridge Field House, Victory Field, the new Eleven Park, Crane Bay Event Center, the Convention Center, Circle Center Mall and many more of Indy's entertainment scene. This home is perfect for owner occupants, an Airbnb or a college student. This is a must see!!
ⓘ Source: listings_history table (triggers on properties + properties_extension) + one-shot
backfill from property_details.listing_events for pre-trigger history.
Tax reassessment forecast IN · Partial reset (capped growth)
- Current annual tax
- $752 · $63/mo
- Projected year-2 tax
- $941 · $78/mo
- Expected delta
- +$189/yr (+$16/mo · 25.1%)
ⓘ Screening estimate from a state-policy table — verify with the county assessor before closing.
Climate risk First Street
- Flood 3/10 Moderate FEMA zone X · 20% chance over 30 yrs
- Wildfire 1/10 Low
- Heat 4/10 Moderate 7 d/yr ≥101°F today · 19 d/yr by 30 yrs out
- Wind 2/10 Low 0% chance of damaging wind over 30 yrs
- Air quality 4/10 Moderate 5 unhealthy d/yr today · 7 by 30 yrs out
Nearby sold comps map
Loading sold comps map…
Walkable amenities ~0.75 mi
Loading nearby amenities…
Taxation est. · year 1
- Rental income
- $15,588
- − Mortgage interest
- −$7,444
- − Property taxes
- −$752
- − Insurance
- −$664
- − Repairs & maintenance
- −$1,247
- − Management
- −$1,247
- − Depreciation
- −$3,866
- Taxable income
- $367
- Est. tax owed @ 24.0%
- −$88
- After-tax cash flow
- $2,447/yr
For passive investors: Depreciation is non-cash, so a rental often shows a tax loss while cash-flowing — sheltering income. Rental losses are passive: they offset passive income freely, and up to $25,000/yr can offset ordinary (W-2) income if you actively participate and your MAGI is under $100k (phasing out to $0 by $150k); unused losses carry forward. On sale, claimed depreciation is recaptured at up to 25%, and gains may owe capital-gains tax (a 1031 exchange can defer both). Figures are a year-1 estimate at your 24.0% rate — not tax advice; consult a CPA.
Schools (NCES district)
- District
- Indianapolis Public Schools
- NCES district ID
- 1804770
- Math proficiency
- 14% ▼ -7.00%
- Reading proficiency
- 20% ▼ -3.00%
- Median HH income
- $32,034
- Composite
- 13.69/100
- National rank
- #9499
- State rank
- #286 of 301 in IN
Livability — Indianapolis city (balance)
No livability data for this city. (Only ~50 U.S. cities are tracked.)
Census & demographics
- Census place
- Indianapolis city (balance), IN
- County
- Marion County · 998,460 people
- City population
- 881,119
- Metro
- Indianapolis-Carmel-Anderson, IN
- Population (ZIP)
- 27,027
- Household income
- $65,280
- Rent vs Own
- Severe rent burden
- 1011.0
Population outlook (Marion County) Hauer SSP2
- Today (2025)
- 1,025,572 people
- By 2030
- 1,065,727 · +3.9%
- By 2040
- 1,141,577 · +11.3%
- By 2050
- 1,208,920 · +17.9%
- By 2075
- 1,367,288 · +33.3%
- By 2100
- 1,438,201 · +40.2%
Race, ethnicity, and origin ACS 2023
- Neighborhood character
- Predominantly White (69%)
- Race & ethnicity
- White 69% Black 13% Hispanic / Latino 13% Two or more races 7%
- Hispanic origin (detail)
- Mexican 7%
- Common ancestry
- Italian 2% Iranian 2% Lithuanian 2%
- Foreign-born
- 9% · Canada, China
- Languages at home
- 87% English-only · Spanish 9% Arabic 1%
Political lean MEDSL · Marion
- 2024 margin
- Strong D (+27.7) · D 63.0% · R 35.3% · Other 1.7%
- 2008→2024 swing
- -0.7pp no change · 2008: 28.4pp · 2024: 27.7pp
- All cycles
- 2024: D+27.7 2020: D+29.1 2016: D+22.8 2012: D+22.2 2008: D+28.4
Not yet ingested
- Civics
- —
Market trends
- HPI YoY
- ▼ -97.56%
- Current HPI
- 313.4711
- Rent YoY
- ▲ 1.79%
- Metro
- Indianapolis-Carmel-Anderson, IN
- State GDP YoY
- ▲ 2.90%
- F500 in state
- 18
Industry mix (Fortune 500 HQ in IN)
| Industry | F500 HQs | Revenue |
|---|---|---|
| Industrial Machinery | 2 | $37B |
|
||
| Healthcare | 1 | $177B |
|
||
| Pharmaceuticals | 1 | $45B |
|
||
| Metals / Steel | 1 | $18B |
|
||
| Agriculture | 1 | $17B |
|
||
| Packaging | 1 | $12B |
|
||
Price history
-21.8% since first listed4 events — show timeline
- 2026-04-23 Price Changed $132,900 MIBOR as Distributed by MLS Grid
- 2026-02-28 Price Changed $139,900 MIBOR as Distributed by MLS Grid
- 2026-01-06 Price Changed $149,900 MIBOR as Distributed by MLS Grid
- 2025-11-07 Listed $169,900 MIBOR as Distributed by MLS Grid
Property tax history
+8.2%/yrLatest (2025): $752 · +11.4% YoY. Source: county tax records.
Cash-flow waterfall
monthlySold comps — $/sqft
last 12 mo · ≤1 miLoading sold comps…