70822 SW Douglas Dr · Green Meadows, OR
Flood risk 1/10 · Minimal
- FEMA flood zone
- X (unshaded)
- Chance of flooding over 30 yrs
- 0.0%
- Est. flood insurance / yr
- $507 – $1,088
Fire risk 7/10 · Major
- Est. fire insurance / yr
- $498 – $926
Heat risk 4/10 · Minor
- Hot days now (above 97°F)
- 5 days/yr
- Hot days in 30 yrs
- 11 days/yr
Wind risk 1/10 · Minimal
- Chance of severe wind over 30 yrs
- —
Air-quality risk 7/10 · Major
- Unhealthy air days now
- 8 days/yr
- Unhealthy air days in 30 yrs
- 8 days/yr
Risk factors via First Street. Map © Google.
Why this score? — see what drove the D+ grade
The composite is a weighted blend of 9 inputs, each scored 0–100. Each bar is that input's sub-score; the figure is the points it added to the 100-point composite (weight × sub-score).
- Cash flow +15.2/30.0
- ARV discount +15.0/15.0
- DSCR +4.7/10.0
- 1% rule +3.1/10.0
- Schools +3.0/10.0
- Livability +2.5/5.0
- Condition / age +2.5/5.0
- Rent growth +1.8/5.0
- Appreciation +0.0/10.0
$209,000
🖨 Deal sheet (PDF) 📄 Offer letter ✓ Due diligence
Listing remarks
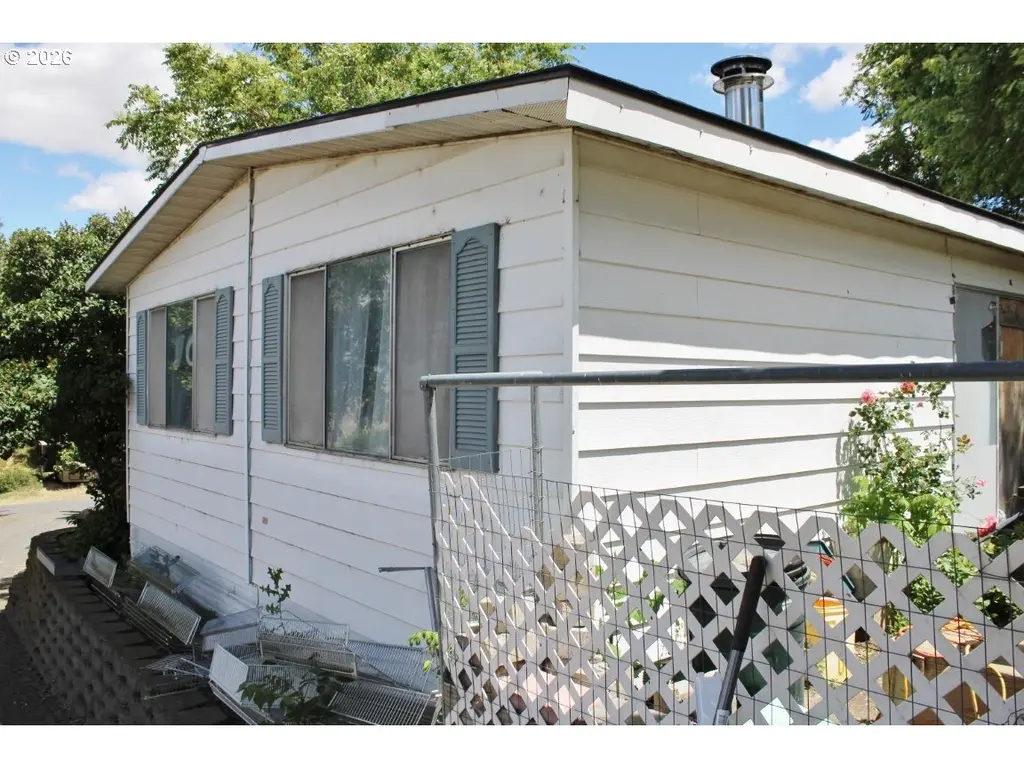
Check out this 1977 double wide on a 0.53 acre lot. 3 bed 2 bath with 1536 sf(m/l) all on 1 level. Home has a wood stove for extra heat on those cold winter days. There is a shared well agreement and a septic system. The home needs tlc but this is a great opportunity at this price! Call today!
Key facts
- 0.53 acre lot
- Wood stove
- Septic system
Tags
Property features AI
Finance
- Other: Property type: Residential; Property sub-type: Manufactured home on real property; Resale condition; Main level living area reported as 1,536 (county)
- Financial info: No land lease
- HOA & community: Not a senior community; Zoned RR2
Exterior
- Parking: Driveway; Off-street parking
- Security: No built-in security features reported
- Utilities: Public water; Public sewer; Electric service and electric fuel
- Home design: Manufactured home on real property; Single-story (main living on one level); Valley view
- Construction: Built in 1977; Composition roof; Skirting foundation (manufactured-home skirting)
- Exterior features: Deck; Garden; RV parking; Public road access; T-111 siding; Seasonal and sloped lot; Gravel road surface
Interior
- Kitchen: Dishwasher; Free-standing range; Free-standing refrigerator
- Bedrooms: Primary bedroom on main level; Second bedroom on main level; Third bedroom on main level
- Flooring: Laminate flooring; Vinyl flooring
- Bathrooms: Two full bathrooms (both on the main level)
- Heating & cooling: Forced air heating; Central air conditioning; Electric water heater
- Interior features: Ground-level, one-level living with accessibility features; Laminate and vinyl flooring; Laundry area; Wood-burning fireplace (1); Aluminum-framed windows; Crawl space
- Laundry & utility: Main-level laundry
Neighborhood map
What this means for you Summary
Snapshot
- This is a 3-bed/2.0-bath manufactured listed at $209k.
Deal economics
- At list price, monthly cash flow is $72 ($861/yr) — positive.
- The deal already cash-flows at list — no discount required.
- To meet the 1% rule (rent ≥ 1% of price), the offer needs to be $170k (18.6% below list).
- Recommended offer: $170k (18.6% below list) — sets the bar for 1% rule.
Location & tenants
- Location reads: area grade D — affects rentability + tenant quality, not the cash-flow math above.
- Pendleton SD 16 (town): math 27% / reading 43% proficiency, ranked #24 of 58 in OR (top 41%) — families likely to look elsewhere, expect single-tenant / working-renter base with shorter leases.
- Zoned schools: Mckay Creek Elementary School (math 54% / reading 54%, grade C, #79 of 412 statewide, top 21%, 246 students, 65% FRL); Sunridge Middle School (math 28% / reading 43%, grade F, #59 of 128 statewide, top 46%, 637 students, 65% FRL); Pendleton High School (math 22% / reading 62%, grade F, #67 of 143 statewide, top 46%, 795 students, 73% FRL) — zoned schools average 68% FRL vs 44% district-wide (23 pts higher); higher-poverty schools than district average — tighter screening recommended.
- Market conditions: Rents soft (-2.7%/yr); 139 active listings in the ZIP; 205 units permitted in Umatilla County in 2024 (0 in 5+ unit buildings).
Forward outlook
- Local home prices are declining (-3.0%/yr); year-one equity from $1k of loan paydown is wiped out by about $6k of value loss. Plan a longer hold.
- Umatilla County population projected to shrink 3% by 2050 — rents likely to lag national; underwrite the cash flow, not the appreciation.
Negotiation context
- Only 8 days on market — expect competitive offers; lowballing is unlikely to land.
Risks & watch-outs
- Climate carrying-cost: major wildfire risk — expect insurance premiums to compound above CPI over the hold.
Questions for the listing agent
- Built in 1977 — when were the roof, HVAC, electrical panel, plumbing, and water heater last replaced?
- Is there a deadline driving the sale (1031 exchange, divorce, estate, relocation)? That informs how much negotiation room exists.
- The area grade is low — what's the realistic commute time and amenity access for the typical tenant pool here? Any planned neighborhood developments (good or bad) we should know about?
- What's the average days-on-market for RENTAL listings here right now (not sales)? A rising rental-DOM trend means longer vacancies and softer asking-rent achievability than the comps imply.
- What's the recent tenant-quality profile in this submarket — average credit score on applications, eviction rate, late-payment / NSF rate, and stable-employment percentage? A property-management company in the area should have these aggregated.
- How much new for-sale + rental construction is in the pipeline within 1–3 miles? Heavy new supply typically softens prices + rents 12–24 months out; constrained supply supports both.
Investment metrics
- 1% rule
- 0.81% ✗
- Cap rate
- 6.70%
- Cash-on-cash
- 1.47%
- DSCR
- 1.07
- GRM
- 10.2
CMA / ARV
- ARV (on-the-fly)
- $267,264
- Comps found
- 1
Show comp detail 1 sale within ~0.75 mi
| Address | Dist | Beds/Ba | Sqft | Sold | Price | $/sf | Match |
|---|---|---|---|---|---|---|---|
| 70809 SW Douglas Dr | 0.07mi | 3/2.0 | 1,728 (+12%) | 20mo | $300,000 | $174 | 60 |
Match score weights: distance 35% · size 25% · config 20% · recency 20%. Top-matched comps best support the ARV.
Projected returns pro-forma
-3.0% appreciation · 0.0% rent growth · sell at horizon
- IRR
- -17.0%
- Equity multiple
- 0.41×
- Total profit
- $-34,368
- Equity at exit
- $31,163
- IRR
- -14.9%
- Equity multiple
- 0.25×
- Total profit
- $-43,647
- Equity at exit
- $18,071
Cash invested: $58,520 (down + closing). Projections, not guarantees.
Landlord ↔ Tenant lean methodology
- Overall (STATE)
- 28 Tenant-Leaning
- State Oregon
- 28 Tenant-Leaning · D+6
- County
- — inherits STATE
- City
- — inherits STATE
ZIP-level market 97801
- Rents YoY
- -2.7%
- Active inventory
- 139
- Price-to-rent
- 10.2×
Monthly cashflow live
- Estimated rent
- $1,702 medium interval (Pro) →
- Mortgage (P&I)
- −$1,096
- Tax from tax record
- −$90 /mo · $1,079/yr
- Insurance
- −$87
- HOA
- −$0
- Vacancy / Maint / Mgmt
- −$357
- Net cashflow
- $72
Break-even live
Sensitivity live
| Price | -10% $190 | -5% $131 | +0% $72 | +5% $13 | +10% $-47 |
|---|---|---|---|---|---|
| Rent | -10% $-63 | -5% $4 | +0% $72 | +5% $139 | +10% $206 |
| Rate | -1.0pp $177 | -0.5pp $125 | base $72 | +0.5pp $18 | +1.0pp $-38 |
UW: 25.0% down · 7.5% · 30yr · 1.5% tax · 5.0% vac · 8.0% maint · 8.0% mgmt
Financing live
Cash to close
- Down payment
- $52,250
- Closing costs
- $6,270
- Reserves months
- —
- Total cash needed
- —
Loan-product check · same deal, 3 products live
Conventional
25% down · 7.5% · 30yr
- Down + closing
- —
- Monthly P&I
- —
- Monthly cashflow
- —
- DSCR
- —
- Eligible?
- —
Personal DTI + credit; lowest rate.
DSCR
20% down · 8.5% · 30yr
- Down + closing
- —
- Monthly P&I
- —
- Monthly cashflow
- —
- DSCR
- —
- Eligible?
- —
No personal income docs; deal must DSCR.
Hard money
10% down · 12.0% · 12mo
- Down + closing
- —
- Monthly P&I
- —
- Monthly cashflow
- —
- DSCR
- —
- Eligible?
- —
Short-term bridge; refi at stabilization.
Listing history 8 events
-
2026-06-19days on market $209,000 Active 8 DOM
-
2026-06-18days on market $209,000 Active 7 DOM
-
2026-06-17days on market $209,000 Active 6 DOM
-
2026-06-16days on market $209,000 Active 5 DOM
-
2026-06-15days on market $209,000 Active 4 DOM
-
2026-06-14days on market $209,000 Active 2 DOM
-
2026-06-12remarks 295-char remark
-
2026-06-12$209,000 Active 1 DOM
ⓘ Source: listings_history table (triggers on properties + properties_extension) + one-shot
backfill from property_details.listing_events for pre-trigger history.
Tax reassessment forecast OR · Resets to sale price
- Current annual tax
- $1,079 · $90/mo
- Projected year-2 tax
- $2,027 · $169/mo
- Expected delta
- +$948/yr (+$79/mo · 87.9%)
ⓘ Screening estimate from a state-policy table — verify with the county assessor before closing.
Climate risk First Street
- Flood 1/10 Low FEMA zone X (unshaded) · 0% chance over 30 yrs
- Wildfire 7/10 Severe
- Heat 4/10 Moderate 5 d/yr ≥97°F today · 11 d/yr by 30 yrs out
- Wind 1/10 Low
- Air quality 7/10 Severe 8 unhealthy d/yr today · 8 by 30 yrs out
Nearby sold comps map
Loading sold comps map…
Walkable amenities ~0.75 mi
Loading nearby amenities…
Taxation est. · year 1
- Rental income
- $20,426
- − Mortgage interest
- −$11,707
- − Property taxes
- −$1,079
- − Insurance
- −$1,045
- − Repairs & maintenance
- −$1,634
- − Management
- −$1,634
- − Depreciation
- −$6,080
- Taxable loss
- −$2,753
- Est. tax savings @ 24.0%
- +$661
- After-tax cash flow
- $1,521/yr
For passive investors: Depreciation is non-cash, so a rental often shows a tax loss while cash-flowing — sheltering income. Rental losses are passive: they offset passive income freely, and up to $25,000/yr can offset ordinary (W-2) income if you actively participate and your MAGI is under $100k (phasing out to $0 by $150k); unused losses carry forward. On sale, claimed depreciation is recaptured at up to 25%, and gains may owe capital-gains tax (a 1031 exchange can defer both). Figures are a year-1 estimate at your 24.0% rate — not tax advice; consult a CPA.
Schools (NCES district)
- District
- Pendleton SD 16
- NCES district ID
- 4109510
- Math proficiency
- 27% ▼ -11.00%
- Reading proficiency
- 43% ▼ -7.00%
- Median HH income
- $49,009
- Composite
- 30.19/100
- National rank
- #6315
- State rank
- #24 of 58 in OR
Livability — Green Meadows
No livability data for this city. (Only ~50 U.S. cities are tracked.)
Census & demographics
- Census place
- Green Meadows, OR
- County
- Umatilla County · 29,551 people
- Metro
- Hermiston-Pendleton, OR
- Population (ZIP)
- 21,575
- Household income
- $71,639
- Rent vs Own
- Severe rent burden
- 866.0
Population outlook (Umatilla County) Hauer SSP2
- Today (2025)
- 76,329 people
- By 2030
- 75,975 · -0.5%
- By 2040
- 75,119 · -1.6%
- By 2050
- 74,058 · -3.0%
- By 2075
- 70,639 · -7.5%
- By 2100
- 63,441 · -16.9%
Race, ethnicity, and origin ACS 2023
- Neighborhood character
- Predominantly White (75%)
- Race & ethnicity
- White 75% Two or more races 11% Hispanic / Latino 10% Native American 7%
- Hispanic origin (detail)
- Mexican 8%
- Common ancestry
- Italian 4% Slovak 4% Portuguese 4%
- Foreign-born
- 2% · Canada
- Languages at home
- 93% English-only · Spanish 6%
Political lean MEDSL · Umatilla
- 2024 margin
- Solid R (+37.8) · D 29.7% · R 67.5% · Other 2.8%
- 2008→2024 swing
- -15.1pp toward R · 2008: -22.6pp · 2024: -37.8pp
- All cycles
- 2024: R+37.8 2020: R+32.0 2016: R+35.6 2012: R+28.1 2008: R+22.6
Not yet ingested
- Civics
- —
Market trends
- HPI YoY
- ▼ -312.42%
- Current HPI
- 198.6911
- Rent YoY
- ▼ -2.66%
- Metro
- Hermiston-Pendleton, OR
- State GDP YoY
- ▲ 2.05%
- F500 in state
- 2
Industry mix (Fortune 500 HQ in OR)
| Industry | F500 HQs | Revenue |
|---|---|---|
| Consumer Goods | 1 | $51B |
|
||
Price history
1 event — show timeline
- 2026-06-11 Listed $209,000 RMLS
Property tax history
+1.6%/yrLatest (2025): $1,079 · +2.2% YoY. Source: county tax records.
Cash-flow waterfall
monthlySold comps — $/sqft
last 12 mo · ≤1 miLoading sold comps…