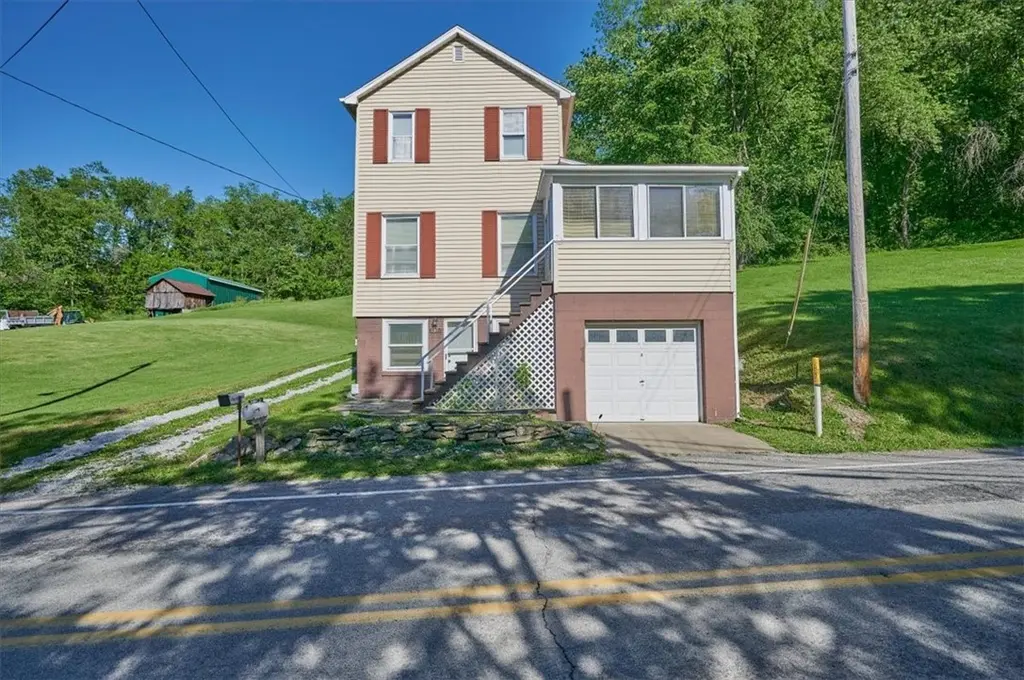
452 Cross Creek Rd · Cross Creek, PA
Flood risk 9/10 · Severe
- FEMA flood zone
- X (unshaded)
- Chance of flooding over 30 yrs
- 0.99%
- Est. flood insurance / yr
- $473 – $860
Fire risk 1/10 · Minimal
- Est. fire insurance / yr
- $511 – $949
Heat risk 3/10 · Minor
- Hot days now (above 96°F)
- 7 days/yr
- Hot days in 30 yrs
- 17 days/yr
Wind risk 2/10 · Minimal
- Chance of severe wind over 30 yrs
- —
Air-quality risk 2/10 · Minimal
- Unhealthy air days now
- 1 days/yr
- Unhealthy air days in 30 yrs
- 2 days/yr
Risk factors via First Street. Map © Google.
Why this score? — see what drove the C grade
The composite is a weighted blend of 9 inputs, each scored 0–100. Each bar is that input's sub-score; the figure is the points it added to the 100-point composite (weight × sub-score).
- Cash flow +20.8/30.0
- ARV discount +7.5/15.0
- Appreciation +6.8/10.0
- DSCR +6.6/10.0
- 1% rule +4.7/10.0
- Schools +4.2/10.0
- Livability +3.3/5.0
- Rent growth +2.5/5.0
- Condition / age +2.5/5.0
$134,900
🖨 Deal sheet 📄 Offer letter ✓ Due diligence
Listing remarks
Welcome to 452 Cross Creek Road in Avella! Set in a peaceful country setting, this charming 3-bedroom, 2-full-bath home offers a wonderful blend of comfort, privacy, and rural charm. Inside, you’ll find spacious living areas filled with natural light and a functional floor plan designed for everyday living. Three comfortable bedrooms, two full bathrooms, and inviting gathering spaces make this home as practical as it is welcoming. Outdoors, picturesque views of the surrounding countryside create the perfect backdrop for relaxing or entertaining. With plenty of room to enjoy nature and embrace the tranquility of country living, this property offers the chance to create your own private
Key facts
- Natural light
- Private retreat
- Picturesque views
Tags
Property features AI
Exterior
- Parking: Attached garage with garage door opener (1 parking space total)
- Utilities: Public water; Public sewer
- Home design: 2-story home; Resale property
- Construction: Aluminum siding; Vinyl siding; Asphalt roof
- Exterior features: Irregular lot dimensions
Interior
- Kitchen: Stove; Refrigerator
- Flooring: Tile; Carpet
- Bathrooms: 2 full bathrooms
- Heating & cooling: Forced air gas heating; Central air conditioning
- Interior features: Unfinished walk-out basement
- Laundry & utility: Washer; Dryer
Neighborhood map
What this means for you Summary
Snapshot
- This is a 3-bed/1.0-bath single-family listed at $135k.
Deal economics
- At list price, monthly cash flow is $129 ($2k/yr) — positive.
- The deal already cash-flows at list — no discount required.
- To meet the 1% rule (rent ≥ 1% of price), the offer needs to be $131k (2.9% below list).
- Recommended offer: $131k (2.9% below list) — sets the bar for 1% rule.
Location & tenants
- Location reads 66/100 on livability (#1,092 in PA) — a middle-class / working-renter tenant base. Strengths: employment A+, cost of living A+, housing A+; Watch: amenities F, commute F, health & safety F.
- Avella Area SD (rural): math 37% / reading 59% proficiency, ranked #198 of 539 in PA (top 37%) — families likely to look elsewhere, expect single-tenant / working-renter base with shorter leases.
- Market conditions: 8 active listings in the ZIP; 489 units permitted in Washington County in 2024 (30 in 5+ unit buildings).
Forward outlook
- In year one you build about $6k of equity ($933 loan paydown + $5k appreciation (3.6% local appreciation)).
- Washington County population projected to shrink 6% by 2050 — rents likely to lag national; underwrite the cash flow, not the appreciation.
- At projected returns (3.6% appreciation + 3.0% rent growth), your $38k cash investment doubles in ~5 years — after that, you're playing with house money.
- By year 6, paydown + projected appreciation supports a ~$31k cash-out refi (75% LTV) — recoverable capital for the next deal without selling this one.
Negotiation context
- Only 6 days on market — expect competitive offers; lowballing is unlikely to land.
Risks & watch-outs
- Watch-outs: flood insurance adds $56/mo; built in 1900 — expect roof / HVAC / electrical / plumbing capex.
- Climate carrying-cost: severe flood risk — expect insurance premiums to compound above CPI over the hold.
Questions for the listing agent
- Built in 1900 — when were the roof, HVAC, electrical panel, plumbing, and water heater last replaced?
- What's the actual annual flood-insurance premium (NFIP or private), and is the property in a SFHA with mandatory coverage?
- Is there a deadline driving the sale (1031 exchange, divorce, estate, relocation)? That informs how much negotiation room exists.
- What's the average days-on-market for RENTAL listings here right now (not sales)? A rising rental-DOM trend means longer vacancies and softer asking-rent achievability than the comps imply.
- What's the recent tenant-quality profile in this submarket — average credit score on applications, eviction rate, late-payment / NSF rate, and stable-employment percentage? A property-management company in the area should have these aggregated.
- How much new for-sale + rental construction is in the pipeline within 1–3 miles? Heavy new supply typically softens prices + rents 12–24 months out; constrained supply supports both.
Investment metrics
- 1% rule
- 0.97% ✗
- Cap rate
- 7.94%
- Cash-on-cash
- 5.87%
- DSCR
- 1.26
- GRM
- 8.6
CMA / ARV
No comps found within radius.
Projected returns pro-forma
3.57% appreciation · 3.0% rent growth · sell at horizon
- IRR
- 12.8%
- Equity multiple
- 1.76×
- Total profit
- $28,615
- Equity at exit
- $65,053
- IRR
- 14.5%
- Equity multiple
- 3.26×
- Total profit
- $85,365
- Equity at exit
- $103,816
Cash invested: $37,772 (down + closing). Projections, not guarantees.
Landlord ↔ Tenant lean methodology
- Overall (STATE)
- 62 Landlord-Friendly
- State Pennsylvania
- 62 Landlord-Friendly · EVEN
- County
- — inherits STATE
- City
- — inherits STATE
ZIP-level market 15312
- Home prices YoY
- 2.1%
- Active inventory
- 8
- Price-to-rent
- 8.6×
Monthly cashflow live
- Estimated rent
- $1,310 medium interval (Pro) →
- Mortgage (P&I)
- −$707
- Tax from tax record
- −$87 /mo · $1,041/yr
- Insurance
- −$56
- Flood insurance flood zone
- −$56 /mo · $666/yr
- HOA
- −$0
- Vacancy / Maint / Mgmt
- −$275
- Net cashflow
- $129
Break-even live
UW: 25.0% down · 7.5% · 30yr · 1.5% tax · 5.0% vac · 8.0% maint · 8.0% mgmt
Financing live
Cash to close
- Down payment
- $33,725
- Closing costs
- $4,047
- Reserves months
- —
- Total cash needed
- —
Loan-product check · same deal, 3 products live
Conventional
25% down · 7.5% · 30yr
- Down + closing
- —
- Monthly P&I
- —
- Monthly cashflow
- —
- DSCR
- —
- Eligible?
- —
Personal DTI + credit; lowest rate.
DSCR
20% down · 8.5% · 30yr
- Down + closing
- —
- Monthly P&I
- —
- Monthly cashflow
- —
- DSCR
- —
- Eligible?
- —
No personal income docs; deal must DSCR.
Hard money
10% down · 12.0% · 12mo
- Down + closing
- —
- Monthly P&I
- —
- Monthly cashflow
- —
- DSCR
- —
- Eligible?
- —
Short-term bridge; refi at stabilization.
Listing history 6 events
-
2026-06-18days on market $134,900 Active 6 DOM
-
2026-06-17days on market $134,900 Active 5 DOM
-
2026-06-16days on market $134,900 Active 4 DOM
-
2026-06-15days on market $134,900 Active 3 DOM
-
2026-06-13remarks 693-char remark
-
2026-06-13$134,900 Active 1 DOM
ⓘ Source: listings_history table (triggers on properties + properties_extension) + one-shot
backfill from property_details.listing_events for pre-trigger history.
Tax reassessment forecast PA · Partial reset (capped growth)
- Current annual tax
- $1,041 · $87/mo
- Projected year-2 tax
- $1,586 · $132/mo
- Expected delta
- +$545/yr (+$45/mo · 52.4%)
ⓘ Screening estimate from a state-policy table — verify with the county assessor before closing.
Climate risk First Street
- Flood 9/10 Extreme FEMA zone X (unshaded) · 99% chance over 30 yrs
- Wildfire 1/10 Low
- Heat 3/10 Moderate 7 d/yr ≥96°F today · 17 d/yr by 30 yrs out
- Wind 2/10 Low
- Air quality 2/10 Low 1 unhealthy d/yr today · 2 by 30 yrs out
Nearby sold comps map
Loading sold comps map…
Walkable amenities ~0.75 mi
Loading nearby amenities…
Taxation est. · year 1
- Rental income
- $15,723
- − Mortgage interest
- −$7,556
- − Property taxes
- −$1,041
- − Insurance
- −$1,341
- − Repairs & maintenance
- −$1,258
- − Management
- −$1,258
- − Depreciation
- −$3,924
- Taxable loss
- −$655
- Est. tax savings @ 24.0%
- +$157
- After-tax cash flow
- $1,708/yr
For passive investors: Depreciation is non-cash, so a rental often shows a tax loss while cash-flowing — sheltering income. Rental losses are passive: they offset passive income freely, and up to $25,000/yr can offset ordinary (W-2) income if you actively participate and your MAGI is under $100k (phasing out to $0 by $150k); unused losses carry forward. On sale, claimed depreciation is recaptured at up to 25%, and gains may owe capital-gains tax (a 1031 exchange can defer both). Figures are a year-1 estimate at your 24.0% rate — not tax advice; consult a CPA.
Schools (NCES district)
- District
- Avella Area SD
- NCES district ID
- 4202760
- Math proficiency
- 37% ▼ -9.00%
- Reading proficiency
- 59% ▼ -6.00%
- Median HH income
- $58,499
- Composite
- 41.85/100
- National rank
- #3381
- State rank
- #198 of 539 in PA
Livability — Cross Creek
- Score
- 66/100
- State rank
- #1092
- US rank
- #12356
Category grades
Schools grade is shown separately in the Schools card above.
Census & demographics
- Population (ZIP)
- 3,631
Population outlook (Washington County) Hauer SSP2
- Today (2025)
- 208,060 people
- By 2030
- 207,168 · -0.4%
- By 2040
- 202,738 · -2.6%
- By 2050
- 195,269 · -6.1%
- By 2075
- 175,588 · -15.6%
- By 2100
- 145,827 · -29.9%
Race, ethnicity, and origin ACS 2023
- Neighborhood character
- Predominantly White (94%)
- Race & ethnicity
- White 94% Two or more races 4% Hispanic / Latino 1%
- Common ancestry
- Romanian 14% Serbian 6% Slovak 3%
- Foreign-born
- 1% · Canada
- Languages at home
- 98% English-only · Spanish 1% Other Indo-European 1%
Political lean MEDSL · Washington
- 2024 margin
- Strong R (+25.5) · D 36.9% · R 62.4%
- 2008→2024 swing
- -20.8pp toward R · 2008: -4.7pp · 2024: -25.5pp
- All cycles
- 2024: R+25.5 2020: R+22.8 2016: R+25.3 2012: R+13.3 2008: R+4.7
Not yet ingested
- Civics
- —
Market trends
- HPI YoY
- ▲ 3.57%
- Current HPI
- 170.4879
- Rent YoY
- —
- Metro
- —
- State GDP YoY
- ▲ 1.68%
- F500 in state
- 34
Industry mix (Fortune 500 HQ in PA)
| Industry | F500 HQs | Revenue |
|---|---|---|
| Healthcare | 2 | $309B |
|
||
| Insurance | 2 | $27B |
|
||
| Telecommunications / Media | 1 | $124B |
|
||
| Industrial Distribution | 1 | $22B |
|
||
| Financial Services | 1 | $20B |
|
||
| Chemicals / Materials | 1 | $18B |
|
||
Price history
1 event — show timeline
- 2026-06-12 Listed $134,900 West Penn MLS
Property tax history
+4.1%/yrLatest (2026): $1,041 · +2.0% YoY. Source: county tax records.
Cash-flow waterfall
monthlySold comps — $/sqft
last 12 mo · ≤1 miLoading sold comps…