 Multi-family
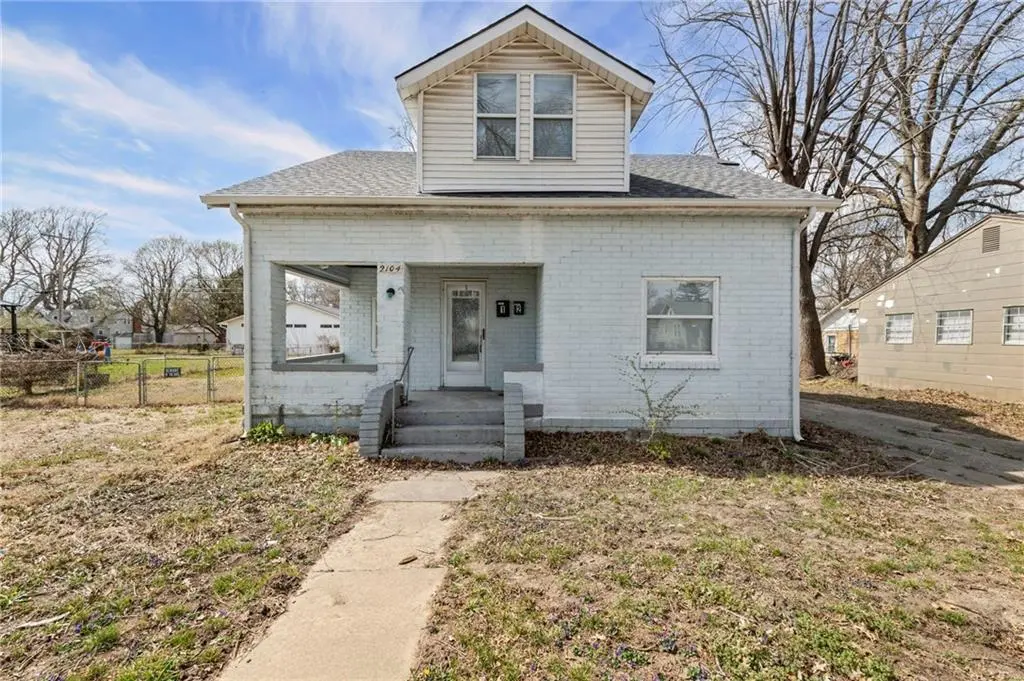
2104 S Norwood Ave · Independence, MO
Flood risk 1/10 · Minimal
- FEMA flood zone
- X (unshaded)
- Chance of flooding over 30 yrs
- 0.0%
- Est. flood insurance / yr
- $473 – $860
Fire risk 1/10 · Minimal
- Est. fire insurance / yr
- $1,054 – $1,958
Heat risk 4/10 · Minor
- Hot days now (above 106°F)
- 7 days/yr
- Hot days in 30 yrs
- 17 days/yr
Wind risk 2/10 · Minimal
- Chance of severe wind over 30 yrs
- —
Air-quality risk 3/10 · Minor
- Unhealthy air days now
- 3 days/yr
- Unhealthy air days in 30 yrs
- 3 days/yr
Risk factors via First Street. Map © Google.
Why this score? — see what drove the B grade
The composite is a weighted blend of 9 inputs, each scored 0–100. Each bar is that input's sub-score; the figure is the points it added to the 100-point composite (weight × sub-score).
- Cash flow +27.3/30.0
- ARV discount +14.3/15.0
- DSCR +9.5/10.0
- 1% rule +6.4/10.0
- Livability +4.1/5.0
- Rent growth +3.9/5.0
- Schools +2.7/10.0
- Condition / age +2.5/5.0
- Appreciation +0.0/10.0
$182,000
🖨 Deal sheet (PDF) 📄 Offer letter ✓ Due diligence
Multi-family units
County records classify this as Multi-Family (2-4 Unit). Listing-text estimate: 1 unit. estimate disagrees with records
Listing remarks MLS
Great Duplex. !st Contract flipped no fault of seller, buyer funding fell through) inspection reports in supplements. .. 1 bed and 2 bed unit. seperate gas and electric as well as hvac systems. 1 water meter. detached garage and car port, off street parking. newer hotwaterheaters. Brick home, with concrete floors, even second floor is concrete floor. Solid well built home. half basement with outside entrance. detached garage and off street parking, mostly fenced back yard. No appliances stay, they are tenants.
Key facts
- 9,828 sq ft lot
- Garage
- Built 1936
Neighborhood map
What this means for you Summary
Snapshot
- This is a 3-bed/2.0-bath multifamily listed at $182k.
Deal economics
- At list price, monthly cash flow is $527 ($6k/yr) — positive.
- The deal already cash-flows at list — no discount required.
- Meets the 1% rule at list price ($2k rent vs $182k).
- Recommended offer: $179k (1.5% below list) — sets the bar for market timing.
- Cap rate 9.8% vs local median 5.0% in Independence — top-decile yield for the area; either an underpriced asset or a hidden risk that comps aren't pricing in. Stress-test before assuming the spread holds.
Location & tenants
- Location reads 82/100 on livability (#10 in MO, #1,296 nationally) — a professional / high-income tenant draw. Strengths: amenities A+, commute A+, cost of living A+; Watch: employment D+, crime F.
- Independence 30 (suburban): math 26% / reading 38% proficiency, ranked #252 of 324 in MO (top 78%) — families likely to look elsewhere, expect single-tenant / working-renter base with shorter leases.
- Zoned schools: Procter Elem. (math 32% / reading 37%, grade F, #676 of 1,115 statewide, top 66%, 208 students, 82% FRL); Bridger Middle (math 32% / reading 38%, grade F, #240 of 391 statewide, top 62%, 770 students, 65% FRL); William Chrisman High (math 21% / reading 45%, grade F, #351 of 521 statewide, top 68%, 1,406 students, 66% FRL).
- Market conditions: Rents rising fast (+5.4%/yr); 135 active listings in the ZIP; 16 comparable units currently listed for rent nearby; rentals at typical pace (median 18d on market — plan ~3-4 weeks tenant-placement turnaround); 4,002 units permitted in Jackson County in 2024 (2,271 in 5+ unit buildings).
- This rent runs 42% of the median local income ($59k/yr) — at the standard rent-burdened threshold; future hikes will face affordability resistance.
Forward outlook
- Local home prices are declining (-3.0%/yr); year-one equity from $1k of loan paydown is wiped out by about $5k of value loss. Plan a longer hold.
- Jackson County population projected at +4% by 2050 — modest demand growth; plan on rents tracking national, not racing it.
- At projected returns (-3.0% appreciation + 5.4% rent growth), your $51k cash investment doubles in ~8 years — after that, you're playing with house money.
Negotiation context
- It's been on market 27 days — a 2% lower offer ($179k) is reasonable based on typical stale-listing flexibility.
- 3 sale attempts since 4y ago with the ask held roughly flat each time — persistent listings suggest the price (not the market) is what's stuck; bring a comps-based counter.
Risks & watch-outs
- Watch-outs: built in 1936 — expect roof / HVAC / electrical / plumbing capex.
Questions for the listing agent
- Built in 1936 — when were the roof, HVAC, electrical panel, plumbing, and water heater last replaced?
- Is there a deadline driving the sale (1031 exchange, divorce, estate, relocation)? That informs how much negotiation room exists.
- Crime grade is F in this area — have there been break-ins, vandalism, or insurance claims at this property in the last 3 years? What carrier currently insures it and at what premium?
- What's the average days-on-market for RENTAL listings here right now (not sales)? A rising rental-DOM trend means longer vacancies and softer asking-rent achievability than the comps imply.
- What's the recent tenant-quality profile in this submarket — average credit score on applications, eviction rate, late-payment / NSF rate, and stable-employment percentage? A property-management company in the area should have these aggregated.
- How much new apartment / multifamily construction is in the pipeline within 1–3 miles? Heavy new supply (>2% of stock underway) typically softens rents 12–24 months out; light construction supports rent growth.
Investment metrics
- 1% rule
- 1.14% ✓
- Cap rate
- 9.77%
- Cash-on-cash
- 12.40%
- DSCR
- 1.55
- GRM
- 7.3
CMA / ARV
- ARV (on-the-fly)
- $214,420
- Comps found
- 5
Show comp detail 5 sales within ~0.75 mi
| Address | Dist | Beds/Ba | Sqft | Sold | Price | $/sf | Match |
|---|---|---|---|---|---|---|---|
| 11122 E 20th St | 0.29mi | 4/2.0 (+1) | 1,392 (-8%) | 1mo | $199,995 | $144 | 68 |
| 2443 S Sterling Ave | 0.54mi | 4/— (+1) | 1,500 (-1%) | 4mo | $185,000 | $123 | 65 |
| 11300 & 11302 E 15th St S | 0.62mi | 4/2.0 (+1) | 1,496 (-1%) | 12mo | $199,950 | $134 | 54 |
| 11501 E 24th St S | 0.36mi | 4/2.0 (+1) | 1,728 (+14%) | 1mo | $245,000 | $142 | 54 |
| 11505 E 24th St S | 0.36mi | 4/2.0 (+1) | 1,728 (+14%) | 1mo | $245,000 | $142 | 54 |
Match score weights: distance 35% · size 25% · config 20% · recency 20%. Top-matched comps best support the ARV.
Projected returns pro-forma
-3.0% appreciation · 5.43% rent growth · sell at horizon
- IRR
- 4.5%
- Equity multiple
- 1.18×
- Total profit
- $9,180
- Equity at exit
- $27,137
- IRR
- 16.0%
- Equity multiple
- 2.44×
- Total profit
- $73,333
- Equity at exit
- $15,736
Cash invested: $50,960 (down + closing). Projections, not guarantees.
Landlord ↔ Tenant lean methodology
- Overall (STATE)
- 81 Strongly Landlord-Friendly
- State Missouri
- 81 Strongly Landlord-Friendly · R+10
- County
- — inherits STATE
- City
- — inherits STATE
ZIP-level market 64052
- Home prices YoY
- -34.6%
- Rents YoY
- 5.4%
- Active inventory
- 135
- Price-to-rent
- 14.0×
Monthly cashflow live
- Estimated rent
- $2,073 high interval (Pro) →
- Mortgage (P&I)
- −$954
- Tax from tax record
- −$81 /mo · $970/yr
- Insurance
- −$76
- HOA
- −$0
- Vacancy / Maint / Mgmt
- −$435
- Net cashflow
- $527
Break-even live
Sensitivity live
| Price | -10% $630 | -5% $578 | +0% $527 | +5% $475 | +10% $424 |
|---|---|---|---|---|---|
| Rent | -10% $363 | -5% $445 | +0% $527 | +5% $608 | +10% $690 |
| Rate | -1.0pp $618 | -0.5pp $573 | base $527 | +0.5pp $479 | +1.0pp $431 |
2-unit breakdown (identical units grouped — click to expand)
| Units | Beds | Baths | Est. rent |
|---|---|---|---|
| 1× unit | 2 | 1 | $1,082 |
| 1× unit | 1 | 1 | $990 |
| Total (2 units) | $2,073 | ||
UW: 25.0% down · 7.5% · 30yr · 1.5% tax · 5.0% vac · 8.0% maint · 8.0% mgmt
Financing live
Cash to close
- Down payment
- $45,500
- Closing costs
- $5,460
- Reserves months
- —
- Total cash needed
- —
Loan-product check · same deal, 3 products live
Conventional
25% down · 7.5% · 30yr
- Down + closing
- —
- Monthly P&I
- —
- Monthly cashflow
- —
- DSCR
- —
- Eligible?
- —
Personal DTI + credit; lowest rate.
DSCR
20% down · 8.5% · 30yr
- Down + closing
- —
- Monthly P&I
- —
- Monthly cashflow
- —
- DSCR
- —
- Eligible?
- —
No personal income docs; deal must DSCR.
Hard money
10% down · 12.0% · 12mo
- Down + closing
- —
- Monthly P&I
- —
- Monthly cashflow
- —
- DSCR
- —
- Eligible?
- —
Short-term bridge; refi at stabilization.
Rent comps 16 comps
| Address | Beds | Baths | Sqft | Rent | $/sqft | DOM | Units | Dist |
|---|---|---|---|---|---|---|---|---|
| 11709 E Winner Rd Independence, MO | 3.0 | 1.5 | 1300 | $1,195 | $0.92 | 18d | 1 | 0.29mi |
| 2110 S Sterling Ave Independence, MO | 3.0 | 2.0 | 1722 | $1,849 | $1.07 | 18d | 1 | 0.29mi |
| 2256 S Sterling Ave Independence, MO | 3.0 | 1.5 | 1284 | $1,399 | $1.09 | 18d | 1 | 0.32mi |
| 10817 E 19th Ter S Independence, MO | 3.0 | 1.0 | 1428 | $1,801 | $1.26 | 18d | 1 | 0.46mi |
| 2356 S Crysler Ave Independence, MO | 3.0 | 2.0 | 1881 | $1,653 | $0.88 | 25d | 1 | 0.58mi |
| 11418 E 13th St S Independence, MO | 2.0 | 1.0 | 1760 | $1,100 | $0.62 | 45d | 1 | 0.70mi |
| 1425 S Northern Blvd Independence, MO | 3.0 | 1.5 | 1275 | $1,200 | $0.94 | 9d | 1 | 0.78mi |
| 10604 E 26th St S Independence, MO | 3.0 | 1.0 | 1068 | $1,610 | $1.51 | 9d | 1 | 0.83mi |
| 2920 S Harvard Ave Unit A Independence, MO | 4.0 | 2.5 | 1200 | $1,650 | $1.38 | 45d | 1 | 1.06mi |
| 1109 S Appleton Ave Independence, MO | 3.0 | 2.0 | 1200 | $1,195 | $1.00 | 18d | 1 | 1.06mi |
| 1502 S Pleasant St Independence, MO | 3.0 | 2.0 | 1200 | $1,399 | $1.17 | 45d | 1 | 1.16mi |
| 3013 Mason Ave Independence, MO | 4.0 | 2.0 | 1166 | $1,900 | $1.63 | 9d | 1 | 1.21mi |
| 1404 S Osage St Independence, MO | 4.0 | 2.0 | 1300 | $1,750 | $1.35 | 16d | 1 | 1.24mi |
| 9613 E 25th Ter S Independence, MO | 3.0 | 1.0 | 1214 | $1,545 | $1.27 | 25d | 1 | 1.37mi |
| 10104 E Golf Ave Independence, MO | 3.0 | 2.0 | 1205 | $1,395 | $1.16 | 16d | 1 | 1.47mi |
| 2815 Collin St Independence, MO | 4.0 | 2.0 | 1860 | $1,800 | $0.97 | 45d | 1 | 1.49mi |
Listing history 8 events
-
2026-04-27status Pending
-
2026-03-31$182,000 Active
-
2022-11-04soldstatus Closed 516-char remark
Show marketing remark (516 chars)
Great Duplex. !st Contract flipped no fault of seller, buyer funding fell through) inspection reports in supplements. .. 1 bed and 2 bed unit. seperate gas and electric as well as hvac systems. 1 water meter. detached garage and car port, off street parking. newer hotwaterheaters. Brick home, with concrete floors, even second floor is concrete floor. Solid well built home. half basement with outside entrance. detached garage and off street parking, mostly fenced back yard. No appliances stay, they are tenants.
-
2022-11-04soldstatus
Show marketing remark (516 chars)
Great Duplex. !st Contract flipped no fault of seller, buyer funding fell through) inspection reports in supplements. .. 1 bed and 2 bed unit. seperate gas and electric as well as hvac systems. 1 water meter. detached garage and car port, off street parking. newer hotwaterheaters. Brick home, with concrete floors, even second floor is concrete floor. Solid well built home. half basement with outside entrance. detached garage and off street parking, mostly fenced back yard. No appliances stay, they are tenants.
-
2022-10-26status Pending 516-char remark
Show marketing remark (516 chars)
Great Duplex. !st Contract flipped no fault of seller, buyer funding fell through) inspection reports in supplements. .. 1 bed and 2 bed unit. seperate gas and electric as well as hvac systems. 1 water meter. detached garage and car port, off street parking. newer hotwaterheaters. Brick home, with concrete floors, even second floor is concrete floor. Solid well built home. half basement with outside entrance. detached garage and off street parking, mostly fenced back yard. No appliances stay, they are tenants.
-
2022-10-22status Active 516-char remark
Show marketing remark (516 chars)
Great Duplex. !st Contract flipped no fault of seller, buyer funding fell through) inspection reports in supplements. .. 1 bed and 2 bed unit. seperate gas and electric as well as hvac systems. 1 water meter. detached garage and car port, off street parking. newer hotwaterheaters. Brick home, with concrete floors, even second floor is concrete floor. Solid well built home. half basement with outside entrance. detached garage and off street parking, mostly fenced back yard. No appliances stay, they are tenants.
-
2022-09-29status Pending 516-char remark
Show marketing remark (516 chars)
Great Duplex. !st Contract flipped no fault of seller, buyer funding fell through) inspection reports in supplements. .. 1 bed and 2 bed unit. seperate gas and electric as well as hvac systems. 1 water meter. detached garage and car port, off street parking. newer hotwaterheaters. Brick home, with concrete floors, even second floor is concrete floor. Solid well built home. half basement with outside entrance. detached garage and off street parking, mostly fenced back yard. No appliances stay, they are tenants.
-
2022-09-23$119,000 Active 516-char remark
Show marketing remark (516 chars)
Great Duplex. !st Contract flipped no fault of seller, buyer funding fell through) inspection reports in supplements. .. 1 bed and 2 bed unit. seperate gas and electric as well as hvac systems. 1 water meter. detached garage and car port, off street parking. newer hotwaterheaters. Brick home, with concrete floors, even second floor is concrete floor. Solid well built home. half basement with outside entrance. detached garage and off street parking, mostly fenced back yard. No appliances stay, they are tenants.
ⓘ Source: listings_history table (triggers on properties + properties_extension) + one-shot
backfill from property_details.listing_events for pre-trigger history.
Tax reassessment forecast MO · Resets to sale price
- Current annual tax
- $970 · $81/mo
- Projected year-2 tax
- $1,765 · $147/mo
- Expected delta
- +$796/yr (+$66/mo · 82.1%)
ⓘ Screening estimate from a state-policy table — verify with the county assessor before closing.
Climate risk First Street
- Flood 1/10 Low FEMA zone X (unshaded) · 0% chance over 30 yrs
- Wildfire 1/10 Low
- Heat 4/10 Moderate 7 d/yr ≥106°F today · 17 d/yr by 30 yrs out
- Wind 2/10 Low
- Air quality 3/10 Moderate 3 unhealthy d/yr today · 3 by 30 yrs out
Nearby sold comps map
Loading sold comps map…
Walkable amenities ~0.75 mi
Loading nearby amenities…
Taxation est. · year 1
- Rental income
- $24,876
- − Mortgage interest
- −$10,195
- − Property taxes
- −$970
- − Insurance
- −$910
- − Repairs & maintenance
- −$1,990
- − Management
- −$1,990
- − Depreciation
- −$5,295
- Taxable income
- $3,527
- Est. tax owed @ 24.0%
- −$846
- After-tax cash flow
- $5,473/yr
For passive investors: Depreciation is non-cash, so a rental often shows a tax loss while cash-flowing — sheltering income. Rental losses are passive: they offset passive income freely, and up to $25,000/yr can offset ordinary (W-2) income if you actively participate and your MAGI is under $100k (phasing out to $0 by $150k); unused losses carry forward. On sale, claimed depreciation is recaptured at up to 25%, and gains may owe capital-gains tax (a 1031 exchange can defer both). Figures are a year-1 estimate at your 24.0% rate — not tax advice; consult a CPA.
Schools (NCES district)
- District
- Independence 30
- NCES district ID
- 2915480
- Math proficiency
- 26% ▼ -8.00%
- Reading proficiency
- 38% ▼ -5.00%
- Median HH income
- $41,843
- Composite
- 27.04/100
- National rank
- #7054
- State rank
- #252 of 324 in MO
Livability — Independence
- Score
- 82/100
- State rank
- #10
- US rank
- #1296
Category grades
Schools grade is shown separately in the Schools card above.
Census & demographics
- Census place
- Independence, MO
- County
- Jackson County · 687,798 people
- City population
- 117,675
- Metro
- Kansas City, MO-KS
- Population (ZIP)
- 22,138
- Household income
- $59,007
- Rent vs Own
- Severe rent burden
- 965.0
Population outlook (Jackson County) Hauer SSP2
- Today (2025)
- 719,589 people
- By 2030
- 731,456 · +1.6%
- By 2040
- 746,689 · +3.8%
- By 2050
- 749,289 · +4.1%
- By 2075
- 736,227 · +2.3%
- By 2100
- 668,210 · -7.1%
Race, ethnicity, and origin ACS 2023
- Neighborhood character
- Diverse neighborhood (Simpson 0.56)
- Race & ethnicity
- White 62% Hispanic / Latino 23% Two or more races 15% Black 7% Asian 2%
- Hispanic origin (detail)
- Mexican 15%
- Common ancestry
- Italian 12% Slovak 2% Lithuanian 2%
- Foreign-born
- 11% · Canada, China
- Languages at home
- 85% English-only · Spanish 13% Other Asian/Pacific 1%
Political lean MEDSL · Jackson
- 2024 margin
- D (+19.3) · D 58.9% · R 39.5% · Other 1.6%
- 2008→2024 swing
- -6.1pp toward R · 2008: 25.4pp · 2024: 19.3pp
- All cycles
- 2024: D+19.3 2020: D+22.0 2016: D+16.6 2012: D+19.0 2008: D+25.4
Not yet ingested
- Civics
- —
Market trends
- HPI YoY
- ▼ -160.06%
- Current HPI
- 302.1124
- Rent YoY
- ▲ 5.43%
- Metro
- Kansas City, MO-KS
- State GDP YoY
- ▲ 1.84%
- F500 in state
- 20
Industry mix (Fortune 500 HQ in MO)
| Industry | F500 HQs | Revenue |
|---|---|---|
| Healthcare | 1 | $163B |
|
||
| Insurance | 1 | $21B |
|
||
| Industrial Technology | 1 | $17B |
|
||
| Retail | 1 | $16B |
|
||
| Industrial Distribution | 1 | $10B |
|
||
| Utilities | 1 | $9B |
|
||
Price history
+52.9% since first listed8 events — show timeline
- 2026-04-27 Pending — Heartland MLS as Distributed by MLS Grid
- 2026-03-31 Listed $182,000 Heartland MLS as Distributed by MLS Grid
- 2022-11-04 Sold (Public Records) — Public Records
- 2022-11-04 Sold (MLS) — Heartland MLS as Distributed by MLS Grid
- 2022-10-26 Pending — Heartland MLS as Distributed by MLS Grid
- 2022-10-22 Relisted — Heartland MLS as Distributed by MLS Grid
- 2022-09-29 Pending — Heartland MLS as Distributed by MLS Grid
- 2022-09-23 Listed $119,000 Heartland MLS as Distributed by MLS Grid
Property tax history
+4.7%/yrLatest (2025): $970 · -21.8% YoY. Source: county tax records.
Cash-flow waterfall
monthlySold comps — $/sqft
last 12 mo · ≤1 miLoading sold comps…