 Duplex
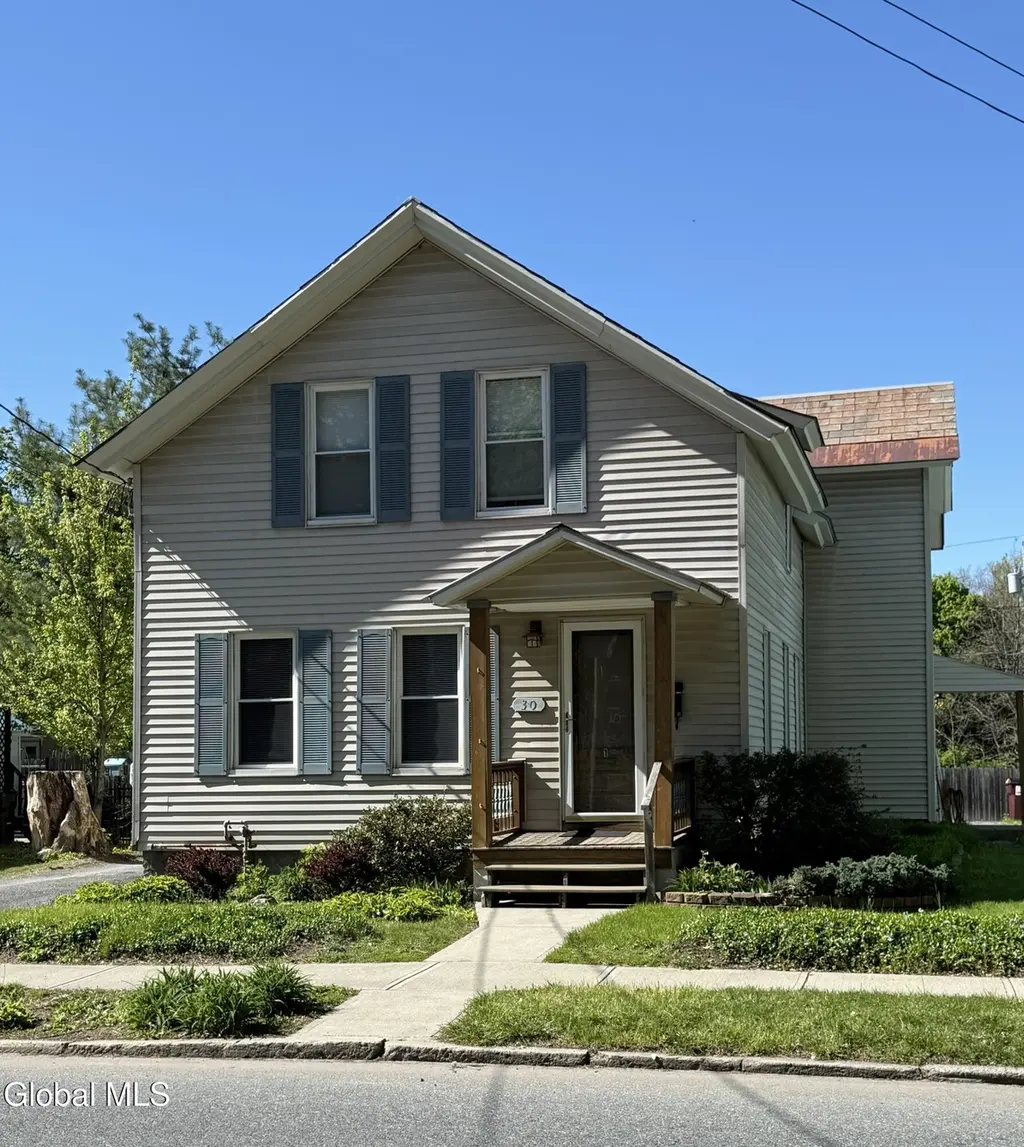
30 Lexington Ave · Glens Falls, NY
Flood risk 1/10 · Minimal
- FEMA flood zone
- X
- Chance of flooding over 30 yrs
- 0.0%
- Est. flood insurance / yr
- $473 – $860
Fire risk 1/10 · Minimal
- Est. fire insurance / yr
- $691 – $1,283
Heat risk 3/10 · Minor
- Hot days now (above 95°F)
- 7 days/yr
- Hot days in 30 yrs
- 16 days/yr
Wind risk 2/10 · Minimal
- Chance of severe wind over 30 yrs
- 3.0%
Air-quality risk 1/10 · Minimal
- Unhealthy air days now
- 0 days/yr
- Unhealthy air days in 30 yrs
- 0 days/yr
Risk factors via First Street. Map © Google.
Why this score? — see what drove the B grade
The composite is a weighted blend of 9 inputs, each scored 0–100. Each bar is that input's sub-score; the figure is the points it added to the 100-point composite (weight × sub-score).
- Cash flow +26.6/30.0
- ARV discount +15.0/15.0
- DSCR +9.1/10.0
- 1% rule +7.6/10.0
- Livability +4.2/5.0
- Schools +4.1/10.0
- Rent growth +2.5/5.0
- Condition / age +2.5/5.0
- Appreciation +0.0/10.0
$270,000
🖨 Deal sheet (PDF) 📄 Offer letter ✓ Due diligence
Multi-family units
County records classify this as Multi-Family (2-4 Unit). Listing-text estimate: 2 units. confirmed
Listing remarks
Well-maintained 2 unit, both with 3 bedrooms. Both units feature large eat-in kitchens, spacious baths and laundry hookups in each unit. Freshly painted throughout with new carpeting. Lower unit has new gas furnace. Upper unit has electric heat. Enclosed back porches make the perfect mudroom, offering easy access from the off-street parking area that accommodates 4 cars. Owner pays for trash removal, lawn care, and snow removal. Tenants are responsible for utilities. Upper unit is rented, lower unit is vacant to accomodate showings.
Key facts
- Spacious baths
- Laundry hookups
- New gas furnace
Tags
Property features AI
Finance
- Financial info: Two-unit multi-family property; Tenants are responsible for hot water, internet, cable TV, electricity and gas; Owner is responsible for trash collection, snow removal and grounds care
Exterior
- Parking: Driveway parking for 4 vehicles
- Utilities: Public water; Public sewer; Cable available
- Home design: Duplex; Living area approximately 1,773 (combined)
- Construction: Vinyl siding; Stone foundation; Slate and metal roof
- Exterior features: Front porch; Rear enclosed porch; Rear porch; Level lot
Interior
- Kitchen: Each unit includes a kitchen
- Bedrooms: Two units each with 3 bedrooms (Unit 1 — bedrooms on 1st floor; Unit 2 — bedrooms on 2nd floor)
- Flooring: Vinyl flooring; Carpet flooring
- Bathrooms: Two full bathrooms total (Unit 1 has 1 full bath on 1st floor; Unit 2 has 1 full bath on 2nd floor)
- Heating & cooling: Forced air heating; Electric heating; Natural gas heating
- Interior features: Vinyl and carpet flooring; Unfinished basement with exterior entry
- Laundry & utility: Washer hookup; Electric dryer hookup
Neighborhood map
What this means for you Summary
Snapshot
- This is a 2 × 3-bed/1.0-bath units multifamily listed at $270k.
Deal economics
- At list price, monthly cash flow is $726 ($9k/yr) — positive. Per door: $363/mo.
- The deal already cash-flows at list — no discount required.
- Meets the 1% rule at list price ($3k rent vs $270k).
- Cap rate 9.5% vs local median 4.8% in Glens Falls — top-decile yield for the area; either an underpriced asset or a hidden risk that comps aren't pricing in. Stress-test before assuming the spread holds.
Location & tenants
- Location reads 83/100 on livability (#60 in NY, #894 nationally) — a professional / high-income tenant draw. Strengths: crime A+, amenities A+, housing A+.
- Glens Falls City School District (urban): math 44% / reading 53% proficiency, ranked #416 of 590 in NY (top 70%) — families likely to look elsewhere, expect single-tenant / working-renter base with shorter leases.
- Zoned schools: Jackson Heights School (math 42% / reading 57%, grade D, #1,085 of 2,108 statewide, top 56%, 251 students, 65% FRL); Glens Falls Middle School (math 25% / reading 46%, grade F, #473 of 729 statewide, top 66%, 588 students, 46% FRL); Glens Falls Senior High School (math 98% / reading 64%, grade A, #485 of 1,100 statewide, top 45%, 601 students, 41% FRL) — zoned schools average 50% FRL vs 35% district-wide (16 pts higher); higher-poverty schools than district average — tighter screening recommended.
- Market conditions: 58 active listings in the ZIP; 180 units permitted in Warren County in 2024 (40 in 5+ unit buildings).
- At $3,395/mo this rent would consume 60% of the median local household income ($68k/yr) (locally 866% of renters already pay >50% of income on rent) — very limited rent-growth headroom before tenants either downsize or default.
Forward outlook
- Local home prices are declining (-3.0%/yr); year-one equity from $2k of loan paydown is wiped out by about $8k of value loss. Plan a longer hold.
- Warren County population projected at -19% by 2050 — secular population decline; favor cash flow + early exit over multi-decade hold.
- At projected returns (-3.0% appreciation + 3.0% rent growth), your $76k cash investment doubles in ~10 years — after that, you're playing with house money.
Negotiation context
- Only 12 days on market — expect competitive offers; lowballing is unlikely to land.
- 3 sale attempts with the ask held roughly flat each time — persistent listings suggest the price (not the market) is what's stuck; bring a comps-based counter.
Risks & watch-outs
- Watch-outs: built in 1920 — expect roof / HVAC / electrical / plumbing capex.
Questions for the listing agent
- Can we see the unit-by-unit rent roll, current vacancy, and any below-market leases? What's the average tenancy length?
- What capital expenditures (roof, boiler, parking lot, exteriors) have been made in the last 5 years, and what's planned in the next 2?
- Built in 1920 — when were the roof, HVAC, electrical panel, plumbing, and water heater last replaced?
- Is there a deadline driving the sale (1031 exchange, divorce, estate, relocation)? That informs how much negotiation room exists.
- What's the average days-on-market for RENTAL listings here right now (not sales)? A rising rental-DOM trend means longer vacancies and softer asking-rent achievability than the comps imply.
- What's the recent tenant-quality profile in this submarket — average credit score on applications, eviction rate, late-payment / NSF rate, and stable-employment percentage? A property-management company in the area should have these aggregated.
- How much new apartment / multifamily construction is in the pipeline within 1–3 miles? Heavy new supply (>2% of stock underway) typically softens rents 12–24 months out; light construction supports rent growth.
Investment metrics
- 1% rule
- 1.26% ✓
- Cap rate
- 9.52%
- Cash-on-cash
- 11.53%
- DSCR
- 1.51
- GRM
- 6.6
CMA / ARV
- ARV (median comp)
- $392,651
- List price
- $270,000
- Delta
- -31.24%
- Verdict
- UNDERPRICED
- Comps
- 20 within 1.0 mi
Show comp detail 5 sales within ~0.75 mi
| Address | Dist | Beds/Ba | Sqft | Sold | Price | $/sf | Match |
|---|---|---|---|---|---|---|---|
| 14 John St | 0.22mi | 5/3.0 (-1) | 1,764 (-0%) | 3mo | $250,000 | $142 | 78 |
| 10 Auburn Pl | 0.57mi | 5/2.0 (-1) | 1,770 (-0%) | 18mo | $240,000 | $136 | 53 |
| 21 William St | 0.42mi | 5/2.0 (-1) | 1,947 (+10%) | 8mo | $171,000 | $88 | 52 |
| 11 William St | 0.43mi | 5/2.0 (-1) | 1,940 (+9%) | 16mo | $250,000 | $129 | 46 |
| 36 N Pearl St | 0.74mi | 6/3.0 | 1,968 (+11%) | 4mo | $315,000 | $160 | 39 |
Match score weights: distance 35% · size 25% · config 20% · recency 20%. Top-matched comps best support the ARV.
Projected returns pro-forma
-3.0% appreciation · 3.0% rent growth · sell at horizon
- IRR
- 0.9%
- Equity multiple
- 1.03×
- Total profit
- $2,624
- Equity at exit
- $40,258
- IRR
- 10.6%
- Equity multiple
- 1.82×
- Total profit
- $62,297
- Equity at exit
- $23,345
Cash invested: $75,600 (down + closing). Projections, not guarantees.
Landlord ↔ Tenant lean methodology
- Overall (STATE)
- 15 Strongly Tenant-Friendly
- State New York
- 15 Strongly Tenant-Friendly · D+10
- County
- — inherits STATE
- City
- — inherits STATE
ZIP-level market 12801
- Home prices YoY
- -13.7%
- Active inventory
- 58
- Price-to-rent
- 13.3×
Monthly cashflow live
- Estimated rent
- $3,395 medium interval (Pro) →
- Mortgage (P&I)
- −$1,416
- Tax from tax record
- −$427 /mo · $5,126/yr
- Insurance
- −$112
- HOA
- −$0
- Vacancy / Maint / Mgmt
- −$713
- Net cashflow
- $726
Break-even live
Sensitivity live
| Price | -10% $879 | -5% $803 | +0% $726 | +5% $650 | +10% $574 |
|---|---|---|---|---|---|
| Rent | -10% $458 | -5% $592 | +0% $726 | +5% $861 | +10% $995 |
| Rate | -1.0pp $862 | -0.5pp $795 | base $726 | +0.5pp $657 | +1.0pp $585 |
2-unit breakdown (identical units grouped — click to expand)
| Units | Beds | Baths | Est. rent |
|---|---|---|---|
| 2× units | 3 | 1 | $3,394 |
| #1 | 3 | 1 | $1,697 |
| #2 | 3 | 1 | $1,697 |
| Total (2 units) | $3,395 | ||
UW: 25.0% down · 7.5% · 30yr · 1.5% tax · 5.0% vac · 8.0% maint · 8.0% mgmt
Financing live
Cash to close
- Down payment
- $67,500
- Closing costs
- $8,100
- Reserves months
- —
- Total cash needed
- —
Loan-product check · same deal, 3 products live
Conventional
25% down · 7.5% · 30yr
- Down + closing
- —
- Monthly P&I
- —
- Monthly cashflow
- —
- DSCR
- —
- Eligible?
- —
Personal DTI + credit; lowest rate.
DSCR
20% down · 8.5% · 30yr
- Down + closing
- —
- Monthly P&I
- —
- Monthly cashflow
- —
- DSCR
- —
- Eligible?
- —
No personal income docs; deal must DSCR.
Hard money
10% down · 12.0% · 12mo
- Down + closing
- —
- Monthly P&I
- —
- Monthly cashflow
- —
- DSCR
- —
- Eligible?
- —
Short-term bridge; refi at stabilization.
Listing history 8 events
-
2026-05-12$270,000 Active 550-char remark
-
2026-03-11historical $1,500
-
2026-03-05$1,500
-
2025-11-26historical $1,600
-
2025-11-14$1,600
-
2025-11-13soldstatus $235,000
-
1999-12-10soldstatus $72,000
-
1998-11-13soldstatus $95,660
ⓘ Source: listings_history table (triggers on properties + properties_extension) + one-shot
backfill from property_details.listing_events for pre-trigger history.
Tax reassessment forecast NY · Partial reset (capped growth)
- Current annual tax
- $5,126 · $427/mo
- Projected year-2 tax
- $5,126 · $427/mo
- Expected delta
- $0/yr ($0/mo · 0.0%)
ⓘ Screening estimate from a state-policy table — verify with the county assessor before closing.
Climate risk First Street
- Flood 1/10 Low FEMA zone X · 0% chance over 30 yrs
- Wildfire 1/10 Low
- Heat 3/10 Moderate 7 d/yr ≥95°F today · 16 d/yr by 30 yrs out
- Wind 2/10 Low 3% chance of damaging wind over 30 yrs
- Air quality 1/10 Low 0 unhealthy d/yr today · 0 by 30 yrs out
Nearby sold comps map
Loading sold comps map…
Walkable amenities ~0.75 mi
Loading nearby amenities…
Taxation est. · year 1
- Rental income
- $40,740
- − Mortgage interest
- −$15,124
- − Property taxes
- −$5,126
- − Insurance
- −$1,350
- − Repairs & maintenance
- −$3,259
- − Management
- −$3,259
- − Depreciation
- −$7,855
- Taxable income
- $4,767
- Est. tax owed @ 24.0%
- −$1,144
- After-tax cash flow
- $7,574/yr
For passive investors: Depreciation is non-cash, so a rental often shows a tax loss while cash-flowing — sheltering income. Rental losses are passive: they offset passive income freely, and up to $25,000/yr can offset ordinary (W-2) income if you actively participate and your MAGI is under $100k (phasing out to $0 by $150k); unused losses carry forward. On sale, claimed depreciation is recaptured at up to 25%, and gains may owe capital-gains tax (a 1031 exchange can defer both). Figures are a year-1 estimate at your 24.0% rate — not tax advice; consult a CPA.
Schools (NCES district)
- District
- Glens Falls City School District
- NCES district ID
- 3612240
- Math proficiency
- 44% ▼ -8.00%
- Reading proficiency
- 53% ▲ 6.00%
- Median HH income
- $48,216
- Composite
- 41.34/100
- National rank
- #3499
- State rank
- #416 of 590 in NY
Livability — Glens Falls
- Score
- 83/100
- State rank
- #60
- US rank
- #894
Category grades
Schools grade is shown separately in the Schools card above.
Census & demographics
- Census place
- Glens Falls, NY
- County
- Warren County · 14,628 people
- City population
- 14,628
- Metro
- Glens Falls, NY
- Population (ZIP)
- 14,628
- Household income
- $67,577
- Rent vs Own
- Severe rent burden
- 866.0
Population outlook (Warren County) Hauer SSP2
- Today (2025)
- 62,372 people
- By 2030
- 60,491 · -3.0%
- By 2040
- 55,616 · -10.8%
- By 2050
- 50,437 · -19.1%
- By 2075
- 40,843 · -34.5%
- By 2100
- 31,159 · -50.0%
Race, ethnicity, and origin ACS 2023
- Neighborhood character
- Predominantly White (90%)
- Race & ethnicity
- White 90% Two or more races 6% Hispanic / Latino 3% Black 2%
- Common ancestry
- Lithuanian 9% Romanian 5% Slovak 5%
- Foreign-born
- 3% · Canada, Dominican Republic
- Languages at home
- 97% English-only · Spanish 1% German/W. Germanic 1%
Political lean MEDSL · Warren
- 2024 margin
- Toss-up / Even · D 47.9% · R 52.1%
- 2008→2024 swing
- -6.9pp toward R · 2008: 2.6pp · 2024: -4.2pp
- All cycles
- 2024: R+4.2 2020: R+0.2 2016: R+10.6 2012: D+2.1 2008: D+2.6
Not yet ingested
- Civics
- —
Market trends
- HPI YoY
- ▼ -52.28%
- Current HPI
- 330.581
- Rent YoY
- —
- Metro
- Glens Falls, NY
- State GDP YoY
- ▲ 2.60%
- F500 in state
- 92
Industry mix (Fortune 500 HQ in NY)
| Industry | F500 HQs | Revenue |
|---|---|---|
| Financial Services | 10 | $950B |
|
||
| Consumer Goods | 9 | $162B |
|
||
| Insurance | 4 | $225B |
|
||
| Telecommunications | 2 | $144B |
|
||
| Pharmaceuticals | 2 | $112B |
|
||
| Media / Entertainment | 2 | $69B |
|
||
Price history
+182.2% since first listed9 events — show timeline
- 2026-05-24 Pending — Global MLS
- 2026-05-12 Listed $270,000 Global MLS
- 2026-03-11 Rental Removed $1,500 GLOBALMLS
- 2026-03-05 Listed for Rent $1,500 GLOBALMLS
- 2025-11-26 Rental Removed $1,600 GLOBALMLS
- 2025-11-14 Listed for Rent $1,600 GLOBALMLS
- 2025-11-13 Sold (Public Records) $235,000 Public Records
- 1999-12-10 Sold (Public Records) $72,000 Public Records
- 1998-11-13 Sold (Public Records) $95,660 Public Records
Property tax history
+6.9%/yrLatest (2025): $5,126 · +1.0% YoY. Source: county tax records.
Cash-flow waterfall
monthlySold comps — $/sqft
last 12 mo · ≤1 miLoading sold comps…