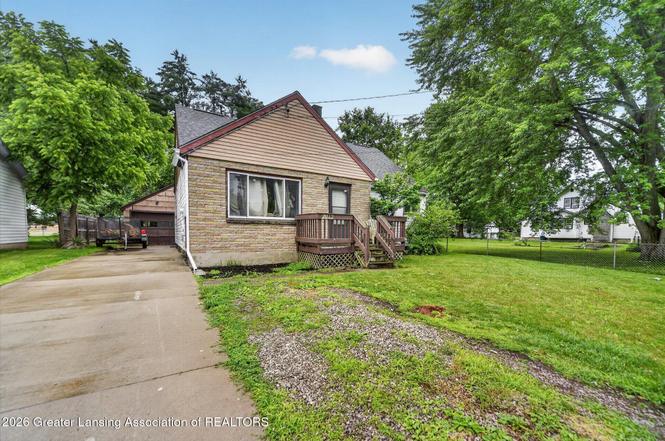
2212 Auburn Ave · Delhi, MI
Flood risk 1/10 · Minimal
- FEMA flood zone
- X (unshaded)
- Chance of flooding over 30 yrs
- 0.0%
- Est. flood insurance / yr
- $507 – $1,088
Fire risk 1/10 · Minimal
- Est. fire insurance / yr
- $784 – $1,456
Heat risk 2/10 · Minimal
- Hot days now (above 96°F)
- 7 days/yr
- Hot days in 30 yrs
- 16 days/yr
Wind risk 2/10 · Minimal
- Chance of severe wind over 30 yrs
- —
Air-quality risk 2/10 · Minimal
- Unhealthy air days now
- 1 days/yr
- Unhealthy air days in 30 yrs
- 2 days/yr
Risk factors via First Street. Map © Google.
Why this score? — see what drove the C- grade
The composite is a weighted blend of 9 inputs, each scored 0–100. Each bar is that input's sub-score; the figure is the points it added to the 100-point composite (weight × sub-score).
- Cash flow +16.9/30.0
- ARV discount +10.0/15.0
- 1% rule +5.3/10.0
- DSCR +5.3/10.0
- Rent growth +4.5/5.0
- Schools +3.3/10.0
- Livability +2.5/5.0
- Condition / age +2.5/5.0
- Appreciation +0.0/10.0
$209,000
🖨 Deal sheet (PDF) 📄 Offer letter ✓ Due diligence
Listing remarks MLS
Welcome to this 4-bedroom home in the heart of Holt! Offering plenty of room for comfortable living, this home features a functional floor plan with generous living spaces, spacious bedrooms, and abundant natural light throughout. The garage provides convenient parking and additional storage space. Situated in a desirable location close to schools, parks, shopping, dining, and major highways, this property offers the perfect blend of comfort and convenience. Whether you're looking for extra space for a growing household, a home office, or entertaining guests, this home has the flexibility to fit your needs. Don't miss the opportunity to make this Holt home your own.
Key facts
- 8,799 sq ft lot
- Garage
- Built 1955
Property features AI
Finance
- Other: Lot about 0.2 acre (approx. 62 x 142)
Exterior
- Parking: Driveway; Garage (detached status not specified)
- Utilities: Public sewer
- Home design: Brick construction; One-and-one-half story; Built in 1955
- Construction: Brick exterior; Built in 1955
- Exterior features: Back yard fencing
Interior
- Kitchen: Kitchen (combo) approximately 17 x 8; Range; Refrigerator
- Bedrooms: 4 bedrooms (primary bedroom approx. 16 x 9.6; other bedrooms approx. 12 x 9 and 12 x 11)
- Bathrooms: 1 full bathroom; 1 half bathroom
- Heating & cooling: Forced air heating; No cooling
- Interior features: Full basement; Range; Refrigerator
- Laundry & utility: Laundry in basement
Neighborhood map
What this means for you Summary
Snapshot
- This is a 4-bed/2.0-bath single-family listed at $209k.
Deal economics
- At list price, monthly cash flow is $137 ($2k/yr) — positive.
- The deal already cash-flows at list — no discount required.
- Meets the 1% rule at list price ($2k rent vs $209k).
Location & tenants
- Location reads: area grade C — affects rentability + tenant quality, not the cash-flow math above.
- Holt Public Schools (suburban): math 28% / reading 46% proficiency, ranked #236 of 540 in MI (top 44%) — families likely to look elsewhere, expect single-tenant / working-renter base with shorter leases.
- Zoned schools: Holt Senior High School (math 47% / reading 77%, grade B-, #58 of 713 statewide, top 9%, 1,626 students, 45% FRL).
- Zoned-school proficiency averages 62% at this address vs 37% district-wide (+25 pts) — the actual schools serving this property are materially stronger than the Holt Public Schools average implies; a family-tenant draw the district grade alone would hide.
- Market conditions: Rents rising fast (+8.0%/yr); 79 active listings in the ZIP; 1 comparable units currently listed for rent nearby; solid renter incomes; 350 units permitted in Ingham County in 2024 (186 in 5+ unit buildings).
Forward outlook
- Local home prices are declining (-3.0%/yr); year-one equity from $1k of loan paydown is wiped out by about $6k of value loss. Plan a longer hold.
- Ingham County population projected at +11% by 2050 — modest demand growth; plan on rents tracking national, not racing it.
- At projected returns (-3.0% appreciation + 8.0% rent growth), your $59k cash investment doubles in ~10 years — after that, you're playing with house money.
Negotiation context
- Only 3 days on market — expect competitive offers; lowballing is unlikely to land.
- 3 sale attempts since 15y ago with the ask held roughly flat each time — persistent listings suggest the price (not the market) is what's stuck; bring a comps-based counter.
- Current owner paid $37k; list at $209k implies a 465% gain — meaningful room to come down on a strong offer.
Risks & watch-outs
- Watch-outs: built in 1955 — expect roof / HVAC / electrical / plumbing capex.
Questions for the listing agent
- Built in 1955 — when were the roof, HVAC, electrical panel, plumbing, and water heater last replaced?
- Is there a deadline driving the sale (1031 exchange, divorce, estate, relocation)? That informs how much negotiation room exists.
- What's the average days-on-market for RENTAL listings here right now (not sales)? A rising rental-DOM trend means longer vacancies and softer asking-rent achievability than the comps imply.
- What's the recent tenant-quality profile in this submarket — average credit score on applications, eviction rate, late-payment / NSF rate, and stable-employment percentage? A property-management company in the area should have these aggregated.
- How much new for-sale + rental construction is in the pipeline within 1–3 miles? Heavy new supply typically softens prices + rents 12–24 months out; constrained supply supports both.
Investment metrics
- 1% rule
- 1.03% ✓
- Cap rate
- 7.08%
- Cash-on-cash
- 2.82%
- DSCR
- 1.13
- GRM
- 8.1
CMA / ARV
- ARV (on-the-fly)
- $221,132
- Comps found
- 12
Show comp detail 12 sales within ~0.75 mi
| Address | Dist | Beds/Ba | Sqft | Sold | Price | $/sf | Match |
|---|---|---|---|---|---|---|---|
| 4641 Tolland Ave | 0.11mi | 3/1.0 (-1) | 1,864 (-0%) | 3mo | $172,500 | $93 | 83 |
| 2152 Auburn Ave | 0.12mi | 4/2.0 | 2,000 (+7%) | 9mo | $235,000 | $118 | 76 |
| 4694 Tolland Ave | 0.19mi | 3/2.0 (-1) | 1,988 (+6%) | 14mo | $245,500 | $123 | 65 |
| 2245 Main St | 0.26mi | 4/2.0 | 2,140 (+14%) | 1mo | $195,000 | $91 | 64 |
| 2189 N Aurelius Rd | 0.26mi | 3/1.0 (-1) | 1,702 (-9%) | 7mo | $215,000 | $126 | 58 |
| 4401 Keller Rd | 0.47mi | 4/2.0 | 2,032 (+8%) | 15mo | $208,000 | $102 | 52 |
| 2122 Cedar St | 0.52mi | 3/1.5 (-1) | 2,060 (+10%) | 2mo | $212,000 | $103 | 50 |
| 2111 Cedar St | 0.52mi | 4/1.5 | 1,690 (-10%) | 9mo | $130,000 | $77 | 50 |
| 1968 Dean Ave | 0.49mi | 3/2.0 (-1) | 1,656 (-12%) | 6mo | $222,500 | $134 | 48 |
| 2164 Bertha St | 0.52mi | 3/1.5 (-1) | 2,026 (+8%) | 13mo | $245,000 | $121 | 45 |
| 2090 Coolridge Rd | 0.72mi | 4/2.0 | 2,017 (+8%) | 14mo | $232,500 | $115 | 42 |
| 4314 Ringneck Ln | 0.73mi | 3/2.5 (-1) | 1,755 (-6%) | 7mo | $339,900 | $194 | 42 |
Match score weights: distance 35% · size 25% · config 20% · recency 20%. Top-matched comps best support the ARV.
Projected returns pro-forma
-3.0% appreciation · 8.0% rent growth · sell at horizon
- IRR
- -5.9%
- Equity multiple
- 0.77×
- Total profit
- $-13,601
- Equity at exit
- $31,163
- IRR
- 9.3%
- Equity multiple
- 1.88×
- Total profit
- $51,788
- Equity at exit
- $18,071
Cash invested: $58,520 (down + closing). Projections, not guarantees.
Landlord ↔ Tenant lean methodology
- Overall (STATE)
- 62 Landlord-Friendly
- State Michigan
- 62 Landlord-Friendly · EVEN
- County
- — inherits STATE
- City
- — inherits STATE
ZIP-level market 48842
- Rents YoY
- 8.0%
- Active inventory
- 79
- Price-to-rent
- 8.1×
Monthly cashflow live
- Estimated rent
- $2,159 medium interval (Pro) →
- Mortgage (P&I)
- −$1,096
- Tax from tax record
- −$385 /mo · $4,619/yr
- Insurance
- −$87
- HOA
- −$0
- Vacancy / Maint / Mgmt
- −$453
- Net cashflow
- $137
Break-even live
Sensitivity live
| Price | -10% $256 | -5% $197 | +0% $137 | +5% $78 | +10% $19 |
|---|---|---|---|---|---|
| Rent | -10% $-33 | -5% $52 | +0% $137 | +5% $223 | +10% $308 |
| Rate | -1.0pp $243 | -0.5pp $191 | base $137 | +0.5pp $83 | +1.0pp $28 |
UW: 25.0% down · 7.5% · 30yr · 1.5% tax · 5.0% vac · 8.0% maint · 8.0% mgmt
Financing live
Cash to close
- Down payment
- $52,250
- Closing costs
- $6,270
- Reserves months
- —
- Total cash needed
- —
Loan-product check · same deal, 3 products live
Conventional
25% down · 7.5% · 30yr
- Down + closing
- —
- Monthly P&I
- —
- Monthly cashflow
- —
- DSCR
- —
- Eligible?
- —
Personal DTI + credit; lowest rate.
DSCR
20% down · 8.5% · 30yr
- Down + closing
- —
- Monthly P&I
- —
- Monthly cashflow
- —
- DSCR
- —
- Eligible?
- —
No personal income docs; deal must DSCR.
Hard money
10% down · 12.0% · 12mo
- Down + closing
- —
- Monthly P&I
- —
- Monthly cashflow
- —
- DSCR
- —
- Eligible?
- —
Short-term bridge; refi at stabilization.
Rent comps 1 comps
| Address | Beds | Baths | Sqft | Rent | $/sqft | DOM | Units | Dist |
|---|---|---|---|---|---|---|---|---|
| 900 Long Blvd Lansing, MI | 1.0–3.0 | 1.0–1.5 | 1013 | $1,495 | $1.48 | 15d | 21 | 1.07mi |
Listing history 3 events
-
2026-06-22days on market $209,000 Active 3 DOM
-
2026-06-18remarks 674-char remark
Show marketing remark (674 chars)
Welcome to this 4-bedroom home in the heart of Holt! Offering plenty of room for comfortable living, this home features a functional floor plan with generous living spaces, spacious bedrooms, and abundant natural light throughout. The garage provides convenient parking and additional storage space. Situated in a desirable location close to schools, parks, shopping, dining, and major highways, this property offers the perfect blend of comfort and convenience. Whether you're looking for extra space for a growing household, a home office, or entertaining guests, this home has the flexibility to fit your needs. Don't miss the opportunity to make this Holt home your own.
-
2026-06-18$209,000 Active 1 DOM
Show marketing remark (674 chars)
Welcome to this 4-bedroom home in the heart of Holt! Offering plenty of room for comfortable living, this home features a functional floor plan with generous living spaces, spacious bedrooms, and abundant natural light throughout. The garage provides convenient parking and additional storage space. Situated in a desirable location close to schools, parks, shopping, dining, and major highways, this property offers the perfect blend of comfort and convenience. Whether you're looking for extra space for a growing household, a home office, or entertaining guests, this home has the flexibility to fit your needs. Don't miss the opportunity to make this Holt home your own.
ⓘ Source: listings_history table (triggers on properties + properties_extension) + one-shot
backfill from property_details.listing_events for pre-trigger history.
Tax reassessment forecast MI · Partial reset (capped growth)
- Current annual tax
- $4,619 · $385/mo
- Projected year-2 tax
- $4,619 · $385/mo
- Expected delta
- $0/yr ($0/mo · 0.0%)
ⓘ Screening estimate from a state-policy table — verify with the county assessor before closing.
Climate risk First Street
- Flood 1/10 Low FEMA zone X (unshaded) · 0% chance over 30 yrs
- Wildfire 1/10 Low
- Heat 2/10 Low 7 d/yr ≥96°F today · 16 d/yr by 30 yrs out
- Wind 2/10 Low
- Air quality 2/10 Low 1 unhealthy d/yr today · 2 by 30 yrs out
Nearby sold comps map
Loading sold comps map…
Walkable amenities ~0.75 mi
Loading nearby amenities…
Taxation est. · year 1
- Rental income
- $25,905
- − Mortgage interest
- −$11,707
- − Property taxes
- −$4,619
- − Insurance
- −$1,045
- − Repairs & maintenance
- −$2,072
- − Management
- −$2,072
- − Depreciation
- −$6,080
- Taxable loss
- −$1,691
- Est. tax savings @ 24.0%
- +$406
- After-tax cash flow
- $2,054/yr
For passive investors: Depreciation is non-cash, so a rental often shows a tax loss while cash-flowing — sheltering income. Rental losses are passive: they offset passive income freely, and up to $25,000/yr can offset ordinary (W-2) income if you actively participate and your MAGI is under $100k (phasing out to $0 by $150k); unused losses carry forward. On sale, claimed depreciation is recaptured at up to 25%, and gains may owe capital-gains tax (a 1031 exchange can defer both). Figures are a year-1 estimate at your 24.0% rate — not tax advice; consult a CPA.
Schools (NCES district)
- District
- Holt Public Schools
- NCES district ID
- 2618480
- Math proficiency
- 28% ▼ -10.00%
- Reading proficiency
- 46% ▼ -5.00%
- Median HH income
- $57,705
- Composite
- 32.68/100
- National rank
- #5653
- State rank
- #236 of 540 in MI
Livability — Delhi
No livability data for this city. (Only ~50 U.S. cities are tracked.)
Census & demographics
- Census place
- Holt, MI
- County
- Ingham County · 237,052 people
- Metro
- Lansing-East Lansing, MI
- Population (ZIP)
- 21,945
- Household income
- $88,340
- Rent vs Own
- Severe rent burden
- 545.0
Population outlook (Ingham County) Hauer SSP2
- Today (2025)
- 300,362 people
- By 2030
- 307,808 · +2.5%
- By 2040
- 320,492 · +6.7%
- By 2050
- 333,223 · +10.9%
- By 2075
- 373,693 · +24.4%
- By 2100
- 392,021 · +30.5%
Race, ethnicity, and origin ACS 2023
- Neighborhood character
- Predominantly White (76%)
- Race & ethnicity
- White 76% Two or more races 9% Hispanic / Latino 7% Black 6% Asian 5%
- Hispanic origin (detail)
- Mexican 6% Cuban 1%
- Common ancestry
- Romanian 7% Lithuanian 3% Iranian 2%
- Foreign-born
- 6% · Vietnam, Canada, China
- Languages at home
- 94% English-only · Other Indo-European 2% Vietnamese 1% Spanish 1%
Political lean MEDSL · Ingham
- 2024 margin
- Strong D (+29.7) · D 63.9% · R 34.2% · Other 2.0%
- 2008→2024 swing
- -3.6pp toward R · 2008: 33.3pp · 2024: 29.7pp
- All cycles
- 2024: D+29.7 2020: D+32.2 2016: D+27.6 2012: D+27.9 2008: D+33.3
Not yet ingested
- Civics
- —
Market trends
- HPI YoY
- ▼ -184.41%
- Current HPI
- 208.5101
- Rent YoY
- ▲ 8.03%
- Metro
- Lansing-East Lansing, MI
- State GDP YoY
- ▲ 1.37%
- F500 in state
- 28
Industry mix (Fortune 500 HQ in MI)
| Industry | F500 HQs | Revenue |
|---|---|---|
| Automotive Parts | 3 | $48B |
|
||
| Automotive | 2 | $372B |
|
||
| Chemicals | 1 | $45B |
|
||
| Automotive Retail | 1 | $29B |
|
||
| Healthcare / Medical Devices | 1 | $23B |
|
||
| Automotive Technology | 1 | $20B |
|
||
Price history
+109.2% since first listed5 events — show timeline
- 2026-06-18 Listed $209,000 REALCOMP
- 2026-06-18 Listed $209,000 Greater Lansing AoR
- 2012-01-31 Sold (MLS) $37,000 Greater Lansing AoR
- 2011-11-30 Listed $49,500 Greater Lansing AoR
- 1999-11-08 Sold (Public Records) $99,900 Public Records
Property tax history
+2.5%/yrLatest (2025): $4,619 · +3.2% YoY. Source: county tax records.
Cash-flow waterfall
monthlySold comps — $/sqft
last 12 mo · ≤1 miLoading sold comps…