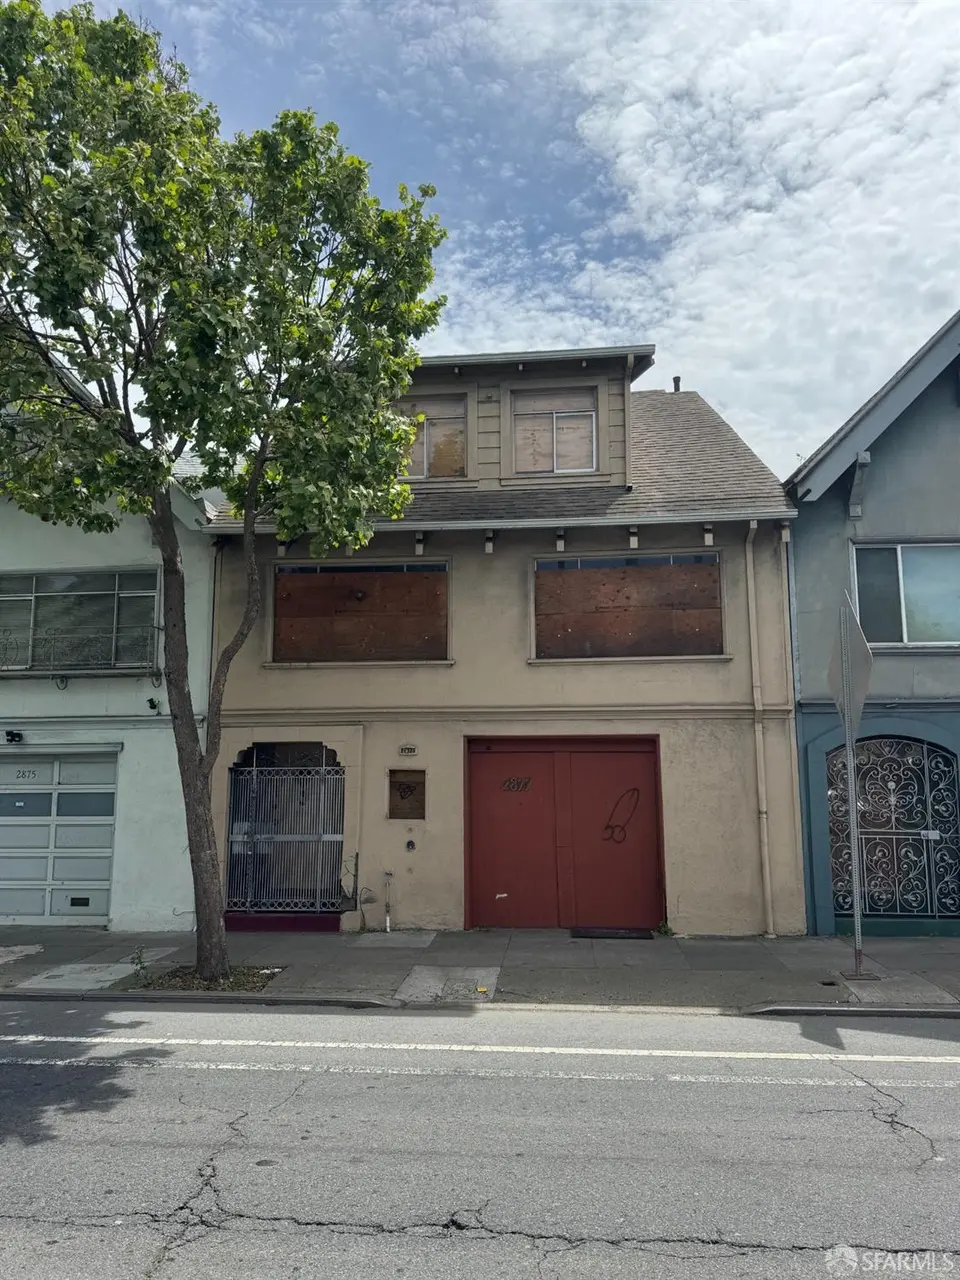
2877 Cesar Chavez St · San Francisco, CA
Flood risk 8/10 · Major
- FEMA flood zone
- X (unshaded)
- Chance of flooding over 30 yrs
- 0.78%
- Est. flood insurance / yr
- $507 – $1,088
Fire risk 1/10 · Minimal
- Est. fire insurance / yr
- $659 – $1,223
Heat risk 2/10 · Minimal
- Hot days now (above 78°F)
- 8 days/yr
- Hot days in 30 yrs
- 18 days/yr
Wind risk 1/10 · Minimal
- Chance of severe wind over 30 yrs
- —
Air-quality risk 7/10 · Major
- Unhealthy air days now
- 13 days/yr
- Unhealthy air days in 30 yrs
- 13 days/yr
Risk factors via First Street. Map © Google.
Why this score? — see what drove the D+ grade
The composite is a weighted blend of 9 inputs, each scored 0–100. Each bar is that input's sub-score; the figure is the points it added to the 100-point composite (weight × sub-score).
- ARV discount +15.0/15.0
- Cash flow +9.0/30.0
- Rent growth +5.0/5.0
- Schools +5.0/10.0
- Livability +3.8/5.0
- DSCR +2.5/10.0
- Condition / age +2.5/5.0
- 1% rule +2.4/10.0
- Appreciation +0.0/10.0
$899,000
🖨 Deal sheet (PDF) 📄 Offer letter ✓ Due diligence
Listing remarks
Discover a compelling opportunity at 2877 Cesar Chavez St in the Precita Valley on the north slope of Bernal Heights! This residential property presents a significant prospect for investors and developers seeking a strategic investment or a project to transform. Imagine the expansion possibilities of RH-2 zoning creating multiple family homes and/or ADUs(up to 4 units/check city), with a deep zero lot line allowing multiple investment and income strategies to bring this amazing project to life! This property offers an exceptional chance to invest or live in a dynamic location in San Francisco! 97 walk score near parks and cafes, near transportation options and so many other amenities!
Key facts
- 2,504 sq ft lot
- Garage
- Built 1922
Property features AI
Finance
- HOA & community: No association
Exterior
- Parking: 1-car garage; Paved driveway and paved sidewalk; Street-level entrance to lower level
- Utilities: No on-site power production (no solar)
- Home design: Attached single family residence; Fixer condition; Built in 1922
- Construction: Year built 1922
- Exterior features: Partial fencing; No private pool or spa
Interior
- Kitchen: Free standing gas range; Free standing gas oven
- Bedrooms: 3 bedrooms
- Flooring: Wood flooring; Laminate flooring
- Bathrooms: 1 full bathroom
- Heating & cooling: Heating: Other; No cooling
- Interior features: Living room fireplace; Laminate counters in the kitchen; 6 total rooms
- Laundry & utility: No laundry hookups listed
Neighborhood map
What this means for you Summary
Snapshot
- This is a 3-bed/1.0-bath single-family listed at $899k.
Deal economics
- At list price, monthly cash flow is $-771 ($-9k/yr) — negative.
- To cash-flow at today's rent, offer at most $763k (15.1% below list).
- To meet the 1% rule (rent ≥ 1% of price), the offer needs to be $669k (25.6% below list).
- Recommended offer: $669k (25.6% below list) — sets the bar for 1% rule.
- Cap rate 5.4% vs local median 2.1% in San Francisco — top-decile yield for the area; either an underpriced asset or a hidden risk that comps aren't pricing in. Stress-test before assuming the spread holds.
Location & tenants
- Location reads 76/100 on livability (#90 in CA, #3,143 nationally) — a middle-class / working-renter tenant base. Strengths: amenities A+, commute A+, employment A+; Watch: crime F, cost of living F.
- San Francisco Unified (urban): math 50% / reading 56% proficiency, ranked #322 of 1,400 in CA (top 23%) — acceptable for families but not a draw, mixed tenant base, ~2y average lease.
- Zoned schools: Lilienthal (Claire) Elementary (669 students, 19% FRL); Giannini (A.P.) Middle (1,192 students, 34% FRL); Lowell High (2,632 students, 37% FRL) — zoned schools average 30% FRL vs 49% district-wide (19 pts lower); this property's tenant base skews higher-income than the district average.
- Market conditions: Rents rising fast (+14.5%/yr); 162 active listings in the ZIP; 40 comparable units currently listed for rent nearby; rentals at typical pace (median 26d on market — plan ~3-4 weeks tenant-placement turnaround); high-income renter base; 750 units permitted in San Francisco County in 2024 (688 in 5+ unit buildings).
- At $6,687/mo this rent would consume 51% of the median local household income ($158k/yr) (locally 2732% of renters already pay >50% of income on rent) — very limited rent-growth headroom before tenants either downsize or default.
Forward outlook
- Local home prices are declining (-3.0%/yr); year-one equity from $6k of loan paydown is wiped out by about $27k of value loss. Plan a longer hold.
- San Francisco County population projected at +39% by 2050 — long-run rental-demand tailwind backs the buy-and-hold thesis.
Negotiation context
- It's been on market 53 days — a 3% lower offer ($872k) is reasonable based on typical stale-listing flexibility.
Risks & watch-outs
- Watch-outs: flood insurance adds $66/mo; built in 1922 — expect roof / HVAC / electrical / plumbing capex.
- Climate carrying-cost: severe flood risk — expect insurance premiums to compound above CPI over the hold.
Questions for the listing agent
- What do current leases actually rent for vs. the listed asking? Can we see a recent rent roll and the last 12 months of T-12 income?
- It's been on market 53 days. Have you received any prior offers? Is the seller open to a 26% concession, seller financing, or rate buy-down credit?
- Built in 1922 — when were the roof, HVAC, electrical panel, plumbing, and water heater last replaced?
- What's the actual annual flood-insurance premium (NFIP or private), and is the property in a SFHA with mandatory coverage?
- Is there a deadline driving the sale (1031 exchange, divorce, estate, relocation)? That informs how much negotiation room exists.
- Schools are B-rated — typically a magnet for longer-tenancy family renters. What's the average tenant stay here, and is there a school-zone premium baked into asking?
- Crime grade is F in this area — have there been break-ins, vandalism, or insurance claims at this property in the last 3 years? What carrier currently insures it and at what premium?
- The area grade is low — what's the realistic commute time and amenity access for the typical tenant pool here? Any planned neighborhood developments (good or bad) we should know about?
- What's the average days-on-market for RENTAL listings here right now (not sales)? A rising rental-DOM trend means longer vacancies and softer asking-rent achievability than the comps imply.
- What's the recent tenant-quality profile in this submarket — average credit score on applications, eviction rate, late-payment / NSF rate, and stable-employment percentage? A property-management company in the area should have these aggregated.
- How much new for-sale + rental construction is in the pipeline within 1–3 miles? Heavy new supply typically softens prices + rents 12–24 months out; constrained supply supports both.
Investment metrics
- 1% rule
- 0.74% ✗
- Cap rate
- 5.35%
- Cash-on-cash
- -3.36%
- DSCR
- 0.85
- GRM
- 11.2
CMA / ARV
- ARV (median comp)
- $1,448,097
- List price
- $899,000
- Delta
- -37.92%
- Verdict
- UNDERPRICED
- Comps
- 20 within 1.0 mi
Show comp detail 12 sales within ~0.75 mi
| Address | Dist | Beds/Ba | Sqft | Sold | Price | $/sf | Match |
|---|---|---|---|---|---|---|---|
| 1634 York St | 0.10mi | 3/2.0 | 1,430 (+2%) | 1mo | $1,400,000 | $979 | 87 |
| 50 Manchester St | 0.41mi | 3/2.0 | 1,435 (+2%) | 1mo | $1,600,000 | $1,115 | 72 |
| 97 Banks St | 0.54mi | 2/1.5 (-1) | 1,400 (0%) | 2mo | $2,270,000 | $1,621 | 66 |
| 121 Bradford St | 0.52mi | 3/2.0 | 1,456 (+4%) | 2mo | $1,850,000 | $1,271 | 63 |
| 54 Bradford St | 0.44mi | 2/2.0 (-1) | 1,445 (+3%) | 3mo | $2,305,000 | $1,595 | 63 |
| 149 Anderson St | 0.66mi | 3/2.0 | 1,351 (-4%) | 1mo | $1,910,000 | $1,414 | 59 |
| 215 Bradford St | 0.63mi | 3/2.0 | 1,334 (-5%) | 1mo | $1,950,000 | $1,462 | 58 |
| 3810 Folsom St | 0.75mi | 3/2.0 | 1,452 (+4%) | 4mo | $1,935,000 | $1,333 | 51 |
| 51 Ellsworth St | 0.57mi | 3/2.0 | 1,550 (+11%) | 0mo | $2,650,000 | $1,710 | 51 |
| 913 Florida St | 0.61mi | 2/1.0 (-1) | 1,553 (+11%) | 2mo | $1,767,000 | $1,138 | 47 |
| 1028 Rhode Island St | 0.64mi | 2/2.0 (-1) | 1,300 (-7%) | 4mo | $1,650,000 | $1,269 | 46 |
| 709 Eugenia Ave | 0.75mi | 2/1.0 (-1) | 1,200 (-14%) | 2mo | $1,750,000 | $1,458 | 35 |
Match score weights: distance 35% · size 25% · config 20% · recency 20%. Top-matched comps best support the ARV.
Projected returns pro-forma
-3.0% appreciation · 8.0% rent growth · sell at horizon
- IRR
- -17.2%
- Equity multiple
- 0.37×
- Total profit
- $-159,407
- Equity at exit
- $134,044
- IRR
- -2.0%
- Equity multiple
- 0.84×
- Total profit
- $-41,137
- Equity at exit
- $77,729
Cash invested: $251,720 (down + closing). Projections, not guarantees.
Landlord ↔ Tenant lean methodology
- Overall (CITY)
- 0 Strongly Tenant-Friendly
- State California
- 18 Strongly Tenant-Friendly · D+13
- County
- — inherits STATE
- City San Francisco
- 0 Strongly Tenant-Friendly · D+57
ZIP-level market 94110
- Rents YoY
- 14.5%
- Active inventory
- 162
- Price-to-rent
- 11.2×
Monthly cashflow live
- Estimated rent
- $6,687 high interval (Pro) →
- Mortgage (P&I)
- −$4,714
- Tax from tax record
- −$898 /mo · $10,776/yr
- Insurance
- −$375
- Flood insurance flood zone
- −$66 /mo · $798/yr
- HOA
- −$0
- Vacancy / Maint / Mgmt
- −$1,404
- Net cashflow
- $-771
Break-even live
Sensitivity live
| Price | -10% $-262 | -5% $-516 | +0% $-771 | +5% $-1,025 | +10% $-1,279 |
|---|---|---|---|---|---|
| Rent | -10% $-1,299 | -5% $-1,035 | +0% $-771 | +5% $-506 | +10% $-242 |
| Rate | -1.0pp $-318 | -0.5pp $-542 | base $-771 | +0.5pp $-1,003 | +1.0pp $-1,240 |
UW: 25.0% down · 7.5% · 30yr · 1.5% tax · 5.0% vac · 8.0% maint · 8.0% mgmt
Financing live
Cash to close
- Down payment
- $224,750
- Closing costs
- $26,970
- Reserves months
- —
- Total cash needed
- —
Loan-product check · same deal, 3 products live
Conventional
25% down · 7.5% · 30yr
- Down + closing
- —
- Monthly P&I
- —
- Monthly cashflow
- —
- DSCR
- —
- Eligible?
- —
Personal DTI + credit; lowest rate.
DSCR
20% down · 8.5% · 30yr
- Down + closing
- —
- Monthly P&I
- —
- Monthly cashflow
- —
- DSCR
- —
- Eligible?
- —
No personal income docs; deal must DSCR.
Hard money
10% down · 12.0% · 12mo
- Down + closing
- —
- Monthly P&I
- —
- Monthly cashflow
- —
- DSCR
- —
- Eligible?
- —
Short-term bridge; refi at stabilization.
Rent comps 40 comps
| Address | Beds | Baths | Sqft | Rent | $/sqft | DOM | Units | Dist |
|---|---|---|---|---|---|---|---|---|
| 454 Holladay Ave San Francisco, CA | 4.0 | 2.0 | 1500 | $8,500 | $5.67 | 20d | 1 | 0.38mi |
| 2830 22nd St Unit 2830 San Francisco, CA | 2.0 | 2.0 | 1090 | $5,200 | $4.77 | 18d | 1 | 0.60mi |
| 2115-2117 22nd St Unit 2117 San Francisco, CA | 2.0 | 1.0 | 1000 | $4,600 | $4.60 | 23d | 1 | 0.67mi |
| 858 Capp St Unit 1794 San Francisco, CA | 2.0 | 2.5 | 1818 | $17,050 | $9.38 | 25d | 1 | 0.68mi |
| 79 Coleridge St San Francisco, CA | 3.0 | 2.0 | 1850 | $9,750 | $5.27 | 26d | 1 | 0.70mi |
| 725 Capp St San Francisco, CA | 4.0 | 2.0 | 1350 | $5,490 | $4.07 | 45d | 1 | 0.73mi |
| 830 Alabama St San Francisco, CA | 3.0 | 2.0 | 1465 | $9,500 | $6.48 | 45d | 1 | 0.75mi |
| 2018 Oakdale Ave San Francisco, CA | 3.0 | 2.0 | 1300 | $4,995 | $3.84 | 45d | 1 | 0.76mi |
| 3645 25th St San Francisco, CA | 3.0 | 2.0 | 1100 | $7,000 | $6.36 | 45d | 1 | 0.85mi |
| 569-571 Capp St San Francisco, CA | 3.0 | 1.0 | 1600 | $6,995 | $4.37 | 4d | 1 | 0.88mi |
| 696 De Haro St #1611 San Francisco, CA | 3.0 | 2.0 | 1515 | $6,580 | $4.34 | 9d | 1 | 0.95mi |
| 224 27th St San Francisco, CA | 2.0 | 1.0 | 1200 | $6,195 | $5.16 | 0d | 1 | 1.03mi |
| 2333 Mission St #2 San Francisco, CA | 2.0 | 2.0 | 1010 | $4,900 | $4.85 | 9d | 1 | 1.04mi |
| 1043 Dolores St San Francisco, CA | 2.0 | 2.0 | 1012 | $7,500 | $7.41 | 4d | 1 | 1.04mi |
| 351-353 Richland Ave Unit 351 San Francisco, CA | 2.0 | 2.0 | 1147 | $5,950 | $5.19 | 25d | 1 | 1.04mi |
| 922 Valencia St San Francisco, CA | 3.0 | 3.0 | 1100 | $8,450 | $7.68 | 45d | 1 | 1.06mi |
| 922 Valencia St Apt C San Francisco, CA | 3.0 | 2.5 | 1300 | $7,950 | $6.12 | 45d | 1 | 1.06mi |
| 922 Valencia St Unit A San Francisco, CA | 3.0 | 2.5 | 1250 | $8,450 | $6.76 | 45d | 1 | 1.06mi |
| 1772 Dolores St #1 San Francisco, CA | 2.0 | 1.0 | 900 | $3,995 | $4.44 | 26d | 1 | 1.07mi |
| 3436 19th St Unit A San Francisco, CA | 3.0 | 2.0 | 1250 | $7,225 | $5.78 | 21d | 1 | 1.12mi |
| 2 Fair Oaks St #4 San Francisco, CA | 3.0 | 1.0 | 1513 | $9,900 | $6.54 | 20d | 1 | 1.13mi |
| 454 Pennsylvania Ave San Francisco, CA | 3.0 | 2.5 | 1388 | $8,950 | $6.45 | 26d | 1 | 1.14mi |
| 2660 3rd St San Francisco, CA | 2.0 | 1.0–2.0 | 708 | $7,264 | $10.25 | 0d | 6 | 1.15mi |
| 800 Indiana St San Francisco, CA | 3.0 | 1.0–2.5 | 952 | $7,241 | $7.61 | 0d | 1 | 1.15mi |
| 783 Guerrero St #779 San Francisco, CA | 2.0 | 1.0 | 1008 | $4,500 | $4.46 | 9d | 1 | 1.16mi |
| 1121 Tennessee St #5 San Francisco, CA | 2.0 | 2.0 | 1284 | $6,500 | $5.06 | 45d | 1 | 1.18mi |
| 4343 3rd St #205 San Francisco, CA | 3.0 | 2.0 | 1117 | $5,500 | $4.92 | 45d | 1 | 1.19mi |
| 600 S Van Ness Ave San Francisco, CA | 2.0 | 2.0 | 1200 | $6,500 | $5.42 | 4d | 1 | 1.21mi |
| 1394-1396 Sanchez St Unit 1394 San Francisco, CA | 2.0 | 1.0 | 1130 | $4,500 | $3.98 | 45d | 1 | 1.23mi |
| 66 Bayview St San Francisco, CA | 3.0 | 1.0 | 1440 | $4,995 | $3.47 | 20d | 1 | 1.28mi |
| 1566 Newcomb Ave San Francisco, CA | 3.0 | 2.0 | 1196 | $4,290 | $3.59 | 23d | 1 | 1.33mi |
| 1010 16th St San Francisco, CA | 2.0 | 1.0–2.0 | 956 | $4,767 | $4.98 | 0d | 8 | 1.37mi |
| 1626 Noe St San Francisco, CA | 3.0 | 2.0 | 1870 | $12,000 | $6.42 | 26d | 1 | 1.38mi |
| 542 Valencia St Unit A San Francisco, CA | 2.0 | 1.0 | 1600 | $5,000 | $3.12 | 26d | 1 | 1.39mi |
| 290 Holyoke St San Francisco, CA | 3.0 | 2.0 | 1652 | $6,250 | $3.78 | 7d | 1 | 1.41mi |
| 996 Noe St San Francisco, CA | 2.0 | 1.5 | 972 | $7,500 | $7.72 | 45d | 1 | 1.43mi |
| 2121 3rd St San Francisco, CA | 1.0–2.0 | 1.0–2.0 | 774 | $6,934 | $8.96 | 0d | 4 | 1.43mi |
| 2724-2726 San Bruno Ave San Francisco, CA | 3.0 | 2.0 | 1500 | $4,100 | $2.73 | 45d | 1 | 1.45mi |
| 2726 San Bruno Ave Unit 2724 San Francisco, CA | 3.0 | 2.0 | 1500 | $4,100 | $2.73 | 45d | 1 | 1.45mi |
| 603 Tennessee St Unit 305 San Francisco, CA | 3.0 | 3.5 | 1230 | $8,000 | $6.50 | 26d | 1 | 1.46mi |
Listing history 12 events
-
2026-06-21days on market $899,000 Active 53 DOM
-
2026-06-18days on market $899,000 Active 50 DOM
-
2026-06-17days on market $899,000 Active 49 DOM
-
2026-06-16days on market $899,000 Active 48 DOM
-
2026-06-15days on market $899,000 Active 47 DOM
-
2026-06-13days on market $899,000 Active 45 DOM
-
2026-06-13days on market $899,000 Active 44 DOM
-
2026-06-09days on market $899,000 Active 41 DOM
-
2026-06-08days on market $899,000 Active 40 DOM
-
2026-06-07days on market $899,000 Active 39 DOM
-
2026-06-04remarks 696-char remark
-
2026-06-04statusdays on market $899,000 Active 36 DOM
ⓘ Source: listings_history table (triggers on properties + properties_extension) + one-shot
backfill from property_details.listing_events for pre-trigger history.
Tax reassessment forecast CA · Resets to sale price
- Current annual tax
- $10,776 · $898/mo
- Projected year-2 tax
- $10,776 · $898/mo
- Expected delta
- $0/yr ($0/mo · 0.0%)
ⓘ Screening estimate from a state-policy table — verify with the county assessor before closing.
Climate risk First Street
- Flood 8/10 Severe FEMA zone X (unshaded) · 78% chance over 30 yrs
- Wildfire 1/10 Low
- Heat 2/10 Low 8 d/yr ≥78°F today · 18 d/yr by 30 yrs out
- Wind 1/10 Low
- Air quality 7/10 Severe 13 unhealthy d/yr today · 13 by 30 yrs out
Nearby sold comps map
Loading sold comps map…
Walkable amenities ~0.75 mi
Loading nearby amenities…
Taxation est. · year 1
- Rental income
- $80,248
- − Mortgage interest
- −$50,358
- − Property taxes
- −$10,776
- − Insurance
- −$5,292
- − Repairs & maintenance
- −$6,420
- − Management
- −$6,420
- − Depreciation
- −$26,153
- Taxable loss
- −$25,171
- Est. tax savings @ 24.0%
- +$6,041
- After-tax cash flow
- $-3,205/yr
For passive investors: Depreciation is non-cash, so a rental often shows a tax loss while cash-flowing — sheltering income. Rental losses are passive: they offset passive income freely, and up to $25,000/yr can offset ordinary (W-2) income if you actively participate and your MAGI is under $100k (phasing out to $0 by $150k); unused losses carry forward. On sale, claimed depreciation is recaptured at up to 25%, and gains may owe capital-gains tax (a 1031 exchange can defer both). Figures are a year-1 estimate at your 24.0% rate — not tax advice; consult a CPA.
Schools (NCES district)
- District
- San Francisco Unified
- NCES district ID
- 0634410
- Math proficiency
- 50% ▬ 0.00%
- Reading proficiency
- 56% ▲ 1.00%
- Median HH income
- $81,249
- Composite
- 50.14/100
- National rank
- #4088
- State rank
- #322 of 1400 in CA
Livability — San Francisco
- Score
- 76/100
- State rank
- #90
- US rank
- #3143
Category grades
Schools grade is shown separately in the Schools card above.
Census & demographics
- Census place
- San Francisco, CA
- County
- San Francisco County · 827,552 people
- City population
- 827,552
- Metro
- San Francisco-Oakland-Berkeley, CA
- Population (ZIP)
- 66,865
- Household income
- $158,351
- Rent vs Own
- Severe rent burden
- 2732.0
Population outlook (San Francisco County) Hauer SSP2
- Today (2025)
- 1,030,936 people
- By 2030
- 1,110,409 · +7.7%
- By 2040
- 1,270,010 · +23.2%
- By 2050
- 1,435,001 · +39.2%
- By 2075
- 1,779,074 · +72.6%
- By 2100
- 1,966,767 · +90.8%
Race, ethnicity, and origin ACS 2023
- Neighborhood character
- Highly diverse neighborhood (Simpson 0.70)
- Race & ethnicity
- White 41% Hispanic / Latino 32% Asian 16% Two or more races 15% Black 4% Native American 1%
- Hispanic origin (detail)
- Mexican 16% Puerto Rican 1%
- Common ancestry
- Lithuanian 3% Italian 2% Romanian 2%
- Foreign-born
- 28% · Canada, China, Vietnam
- Languages at home
- 58% English-only · Spanish 27% Chinese 5% Other Indo-European 2%
Political lean MEDSL · San Francisco
- 2024 margin
- Solid D (+64.8) · D 80.3% · R 15.5% · Other 4.1%
- 2008→2024 swing
- -5.7pp toward R · 2008: 70.5pp · 2024: 64.8pp
- All cycles
- 2024: D+64.8 2020: D+72.5 2016: D+76.1 2012: D+70.2 2008: D+70.5
Not yet ingested
- Civics
- —
Market trends
- HPI YoY
- ▼ -1385.62%
- Current HPI
- 267.2424
- Rent YoY
- ▲ 14.54%
- Metro
- San Francisco-Oakland-Berkeley, CA
- State GDP YoY
- ▲ 3.21%
- F500 in state
- 116
Industry mix (Fortune 500 HQ in CA)
| Industry | F500 HQs | Revenue |
|---|---|---|
| Technology | 27 | $1,492B |
|
||
| Financial Services | 3 | $174B |
|
||
| Retail | 3 | $44B |
|
||
| Insurance | 3 | $26B |
|
||
| Media / Entertainment | 2 | $115B |
|
||
| Pharmaceuticals / Biotech | 2 | $62B |
|
||
Property tax history
+14.3%/yrLatest (2025): $10,776 · +2.9% YoY. Source: county tax records.
Cash-flow waterfall
monthlySold comps — $/sqft
last 12 mo · ≤1 miLoading sold comps…