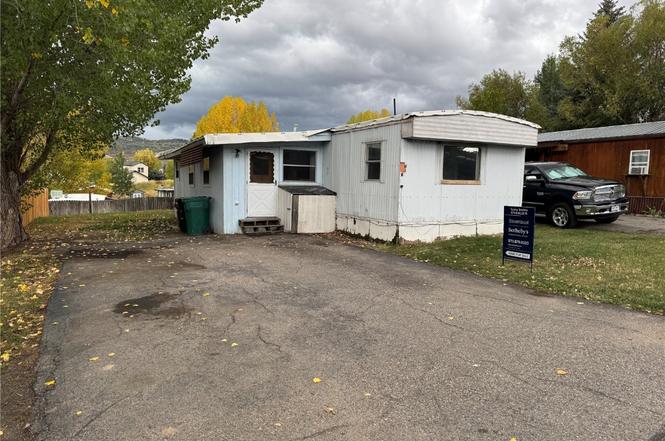
2900 W Acres Dr Unit 83B · Steamboat Springs, CO
Flood risk 5/10 · Moderate
- FEMA flood zone
- X (unshaded)
- Chance of flooding over 30 yrs
- 0.67%
- Est. flood insurance / yr
- $507 – $1,088
Fire risk 5/10 · Moderate
- Est. fire insurance / yr
- $939 – $1,743
Heat risk 2/10 · Minimal
- Hot days now (above 85°F)
- 9 days/yr
- Hot days in 30 yrs
- 24 days/yr
Wind risk 1/10 · Minimal
- Chance of severe wind over 30 yrs
- —
Air-quality risk 2/10 · Minimal
- Unhealthy air days now
- 2 days/yr
- Unhealthy air days in 30 yrs
- 2 days/yr
Risk factors via First Street. Map © Google.
Why this score? — see what drove the C grade
The composite is a weighted blend of 9 inputs, each scored 0–100. Each bar is that input's sub-score; the figure is the points it added to the 100-point composite (weight × sub-score).
- Cash flow +15.0/30.0
- ARV discount +15.0/15.0
- Schools +5.3/10.0
- 1% rule +5.0/10.0
- DSCR +5.0/10.0
- Rent growth +5.0/5.0
- Livability +3.7/5.0
- Condition / age +2.5/5.0
- Appreciation +0.0/10.0
$65,000
🖨 Deal sheet 📄 Offer letter ✓ Due diligence
Listing remarks
Affordable home in West Acres Mobile home park in Steamboat Springs! The home features 3 bedrooms, 2 baths and a large living/kitchen space, parking/storage area, enclosed front entry, fencing, and a private backyard. Additional room could be used as a 4th bedroom or as an office. This home is conveniently located near shopping, skiing, and the downtown area. West Acres requires that the home be owner occupied, no rentals allowed. All buyers must complete the park application and be approved prior to closing. Seller would consider owner financing for the portion of the sale proceeds.
Key facts
- Private backyard
- Enclosed front entry
- Built 1979
Tags
Property features AI
Finance
- Other: Subdivision: WEST ACRES PARK SUBD; Directions available
- HOA & community: Homeowners association present; Annual association fee (listed annually)
Exterior
- Parking: Asphalt parking
- Utilities: Public water; Public sewer; Electricity available; Cable available; Water available; Sewer available
- Home design: Residential mobile home
- Construction: Mobile home construction
- Exterior features: Metal roof; City lot; Near public transit; Alley paved; Private maintained road; Has a view
Interior
- Kitchen: Dishwasher; Range
- Bedrooms: Total of 10 rooms (bedroom count not specified)
- Flooring: Carpet; Tile; Vinyl
- Bathrooms: 1 full bathroom; 1 half bathroom
- Heating & cooling: Forced air heating; Heating present
- Interior features: See remarks (additional interior details available in listing remarks); Unfurnished
- Laundry & utility: In-unit laundry; Washer; Dryer
Neighborhood map
What this means for you Summary
Snapshot
- This is a 3-bed/1.0-bath manufactured listed at $65k.
Deal economics
- At list price, monthly cash flow is $497 ($6k/yr) — positive.
- The deal already cash-flows at list — no discount required.
- Meets the 1% rule at list price ($3k rent vs $65k).
- Recommended offer: $57k (12.0% below list) — sets the bar for market timing.
- Cap rate 15.5% vs local median 0.1% in Steamboat Springs — top-decile yield for the area; either an underpriced asset or a hidden risk that comps aren't pricing in. Stress-test before assuming the spread holds.
Location & tenants
- Location reads 74/100 on livability (#41 in CO, #4,975 nationally) — a middle-class / working-renter tenant base. Strengths: commute A+, employment A+; Watch: health & safety C-, amenities D, cost of living F.
- Steamboat Springs School District No. RE-2 (town): math 49% / reading 72% proficiency, ranked #4 of 86 in CO (top 5%) — acceptable for families but not a draw, mixed tenant base, ~2y average lease; only 12% free/reduced lunch — higher-income household profile.
- Zoned schools: Sleeping Giant School (400 students, 17% FRL); Steamboat Springs High School (math 52% / reading 77%, grade B-, #32 of 381 statewide, top 9%, 842 students, 8% FRL) — zoned schools at 12% FRL track the district average.
- Market conditions: Rents rising fast (+10.6%/yr); 555 active listings in the ZIP; solid renter incomes; 597 units permitted in Routt County in 2024 (418 in 5+ unit buildings).
- This rent runs 34% of the median local income ($110k/yr) — at the standard rent-burdened threshold; future hikes will face affordability resistance.
Forward outlook
- Local home prices are declining (-3.0%/yr); year-one equity from $449 of loan paydown is wiped out by about $2k of value loss. Plan a longer hold.
- Routt County population projected at +18% by 2050 — long-run rental-demand tailwind backs the buy-and-hold thesis.
- At projected returns (-3.0% appreciation + 8.0% rent growth), your $18k cash investment doubles in ~3 years — after that, you're playing with house money.
Negotiation context
- It's been on market 270 days — a 12% lower offer ($57k) is reasonable based on typical stale-listing flexibility.
- Current owner paid $38k; list at $65k implies a 69% gain — meaningful room to come down on a strong offer.
Risks & watch-outs
- Watch-outs: HOA is 49% of rent.
- Climate carrying-cost: moderate flood risk; moderate wildfire risk — expect insurance premiums to compound above CPI over the hold.
Questions for the listing agent
- It's been on market 270 days. Have you received any prior offers? Is the seller open to a 12% concession, seller financing, or rate buy-down credit?
- Built in 1979 — when were the roof, HVAC, electrical panel, plumbing, and water heater last replaced?
- What does the HOA fee cover, when was the last increase, and are there any pending special assessments or reserve-fund shortfalls?
- Why hasn't it sold? Are there any deal-killer items the seller is aware of (foundation, flood, title, zoning, code violations)?
- Is there a deadline driving the sale (1031 exchange, divorce, estate, relocation)? That informs how much negotiation room exists.
- Schools are B-rated — typically a magnet for longer-tenancy family renters. What's the average tenant stay here, and is there a school-zone premium baked into asking?
- What's the average days-on-market for RENTAL listings here right now (not sales)? A rising rental-DOM trend means longer vacancies and softer asking-rent achievability than the comps imply.
- What's the recent tenant-quality profile in this submarket — average credit score on applications, eviction rate, late-payment / NSF rate, and stable-employment percentage? A property-management company in the area should have these aggregated.
- How much new for-sale + rental construction is in the pipeline within 1–3 miles? Heavy new supply typically softens prices + rents 12–24 months out; constrained supply supports both.
Investment metrics
- 1% rule
- 4.84% ✓
- Cap rate
- 15.47%
- Cash-on-cash
- 32.79%
- DSCR
- 2.46
- GRM
- 1.7
CMA / ARV
- ARV (on-the-fly)
- $128,436
- Comps found
- 4
Show comp detail 4 sales within ~0.75 mi
| Address | Dist | Beds/Ba | Sqft | Sold | Price | $/sf | Match |
|---|---|---|---|---|---|---|---|
| 2900 West Acres Dr #84 | 0.00mi | 2/2.0 (-1) | 938 (+2%) | 3mo | $130,000 | $139 | 86 |
| 2900 W Acres Dr #20 | 0.00mi | 2/2.0 (-1) | 1,024 (+11%) | 3mo | $75,000 | $73 | 71 |
| 2900 W Acres Dr | 0.00mi | 3/2.0 | 882 (-4%) | 22mo | $134,000 | $152 | 70 |
| 2900 W Acres Dr #42 | 0.00mi | 3/2.0 | 1,036 (+12%) | 14mo | $66,000 | $64 | 64 |
Match score weights: distance 35% · size 25% · config 20% · recency 20%. Top-matched comps best support the ARV.
Projected returns pro-forma
-3.0% appreciation · 8.0% rent growth · sell at horizon
- IRR
- 42.0%
- Equity multiple
- 3.13×
- Total profit
- $38,768
- Equity at exit
- $9,692
- IRR
- 53.1%
- Equity multiple
- 9.48×
- Total profit
- $154,286
- Equity at exit
- $5,620
Cash invested: $18,200 (down + closing). Projections, not guarantees.
Landlord ↔ Tenant lean methodology
- Overall (STATE)
- 38 Tenant-Leaning
- State Colorado
- 38 Tenant-Leaning · D+4
- County
- — inherits STATE
- City
- — inherits STATE
ZIP-level market 80487
- Rents YoY
- 10.6%
- Active inventory
- 555
- Price-to-rent
- 1.7×
Monthly cashflow live
- Estimated rent
- $3,147 medium interval (Pro) →
- Mortgage (P&I)
- −$341
- Tax est. 1.5%
- −$81 /mo · $975/yr
- Insurance
- −$27
- HOA
- −$1,540
- Vacancy / Maint / Mgmt
- −$661
- Net cashflow
- $497
Break-even live
UW: 25.0% down · 7.5% · 30yr · 1.5% tax · 5.0% vac · 8.0% maint · 8.0% mgmt
Financing live
Cash to close
- Down payment
- $16,250
- Closing costs
- $1,950
- Reserves months
- —
- Total cash needed
- —
Loan-product check · same deal, 3 products live
Conventional
25% down · 7.5% · 30yr
- Down + closing
- —
- Monthly P&I
- —
- Monthly cashflow
- —
- DSCR
- —
- Eligible?
- —
Personal DTI + credit; lowest rate.
DSCR
20% down · 8.5% · 30yr
- Down + closing
- —
- Monthly P&I
- —
- Monthly cashflow
- —
- DSCR
- —
- Eligible?
- —
No personal income docs; deal must DSCR.
Hard money
10% down · 12.0% · 12mo
- Down + closing
- —
- Monthly P&I
- —
- Monthly cashflow
- —
- DSCR
- —
- Eligible?
- —
Short-term bridge; refi at stabilization.
HOA detail
- Monthly dues
- $1,540 · $18,480/yr
Listing history 20 events
-
2026-06-19days on market $65,000 Active 270 DOM
-
2026-06-18days on market $65,000 Active 269 DOM
-
2026-06-17days on market $65,000 Active 268 DOM
-
2026-06-16days on market $65,000 Active 267 DOM
-
2026-06-15days on market $65,000 Active 266 DOM
-
2026-06-14days on market $65,000 Active 264 DOM
-
2026-06-12days on market $65,000 Active 263 DOM
-
2026-06-09days on market $65,000 Active 260 DOM
-
2026-06-08days on market $65,000 Active 259 DOM
-
2026-06-07days on market $65,000 Active 258 DOM
-
2026-06-07days on market $65,000 Active 257 DOM
-
2026-06-04days on market $65,000 Active 254 DOM
-
2026-06-02days on market $65,000 Active 253 DOM
-
2026-06-01days on market $65,000 Active 252 DOM
-
2026-05-31days on market $65,000 Active 251 DOM
-
2026-05-31days on market $65,000 Active 250 DOM
-
2026-03-13price $65,000
-
2025-09-23$70,000 Active
-
1999-12-15soldstatus $38,500
-
1999-12-15soldstatus $38,000
ⓘ Source: listings_history table (triggers on properties + properties_extension) + one-shot
backfill from property_details.listing_events for pre-trigger history.
Climate risk First Street
- Flood 5/10 Major FEMA zone X (unshaded) · 67% chance over 30 yrs
- Wildfire 5/10 Major
- Heat 2/10 Low 9 d/yr ≥85°F today · 24 d/yr by 30 yrs out
- Wind 1/10 Low
- Air quality 2/10 Low 2 unhealthy d/yr today · 2 by 30 yrs out
Nearby sold comps map
Loading sold comps map…
Walkable amenities ~0.75 mi
Loading nearby amenities…
Taxation est. · year 1
- Rental income
- $37,770
- − Mortgage interest
- −$3,641
- − Property taxes
- −$975
- − Insurance
- −$325
- − Repairs & maintenance
- −$3,022
- − Management
- −$3,022
- − HOA
- −$18,480
- − Depreciation
- −$1,891
- Taxable income
- $6,414
- Est. tax owed @ 24.0%
- −$1,539
- After-tax cash flow
- $4,428/yr
For passive investors: Depreciation is non-cash, so a rental often shows a tax loss while cash-flowing — sheltering income. Rental losses are passive: they offset passive income freely, and up to $25,000/yr can offset ordinary (W-2) income if you actively participate and your MAGI is under $100k (phasing out to $0 by $150k); unused losses carry forward. On sale, claimed depreciation is recaptured at up to 25%, and gains may owe capital-gains tax (a 1031 exchange can defer both). Figures are a year-1 estimate at your 24.0% rate — not tax advice; consult a CPA.
Schools (NCES district)
- District
- Steamboat Springs School District No. RE-2
- NCES district ID
- 0806660
- Math proficiency
- 49% ▼ -9.00%
- Reading proficiency
- 72% ▲ 1.00%
- Median HH income
- $67,833
- Composite
- 53.1/100
- National rank
- #1513
- State rank
- #4 of 86 in CO
Livability — Steamboat Springs
- Score
- 74/100
- State rank
- #41
- US rank
- #4975
Category grades
Schools grade is shown separately in the Schools card above.
Census & demographics
- Census place
- Steamboat Springs, CO
- County
- Routt County · 18,525 people
- City population
- 18,525
- Metro
- Steamboat Springs, CO
- Population (ZIP)
- 18,525
- Household income
- $109,659
- Rent vs Own
- Severe rent burden
- 644.0
Population outlook (Routt County) Hauer SSP2
- Today (2025)
- 27,283 people
- By 2030
- 28,555 · +4.7%
- By 2040
- 30,578 · +12.1%
- By 2050
- 32,328 · +18.5%
- By 2075
- 36,897 · +35.2%
- By 2100
- 38,794 · +42.2%
Race, ethnicity, and origin ACS 2023
- Neighborhood character
- Predominantly White (80%)
- Race & ethnicity
- White 80% Two or more races 12% Hispanic / Latino 9%
- Hispanic origin (detail)
- Mexican 6%
- Common ancestry
- Romanian 5% Slovak 3% Lithuanian 3%
- Foreign-born
- 7% · Canada
- Languages at home
- 92% English-only · Spanish 6% Other Indo-European 1% French/Haitian/Cajun 1%
Political lean MEDSL · Routt
- 2024 margin
- Strong D (+27.7) · D 62.5% · R 34.8% · Other 2.8%
- 2008→2024 swing
- +0.9pp no change · 2008: 26.9pp · 2024: 27.7pp
- All cycles
- 2024: D+27.7 2020: D+27.6 2016: D+17.0 2012: D+15.6 2008: D+26.9
Not yet ingested
- Civics
- —
Market trends
- HPI YoY
- ▼ -342.73%
- Current HPI
- 471.8844
- Rent YoY
- ▲ 10.61%
- Metro
- Steamboat Springs, CO
- State GDP YoY
- ▲ 1.95%
- F500 in state
- 14
Industry mix (Fortune 500 HQ in CO)
| Industry | F500 HQs | Revenue |
|---|---|---|
| Technology Distribution | 1 | $31B |
|
||
| Food / Agriculture | 1 | $18B |
|
||
| Packaging | 1 | $14B |
|
||
| Healthcare | 1 | $13B |
|
||
| Energy | 1 | $10B |
|
||
| Technology | 1 | $4B |
|
||
Price history
+68.8% since first listed4 events — show timeline
- 2026-03-13 Price Changed $65,000 SAR
- 2025-09-23 Listed $70,000 SAR
- 1999-12-15 Sold (Public Records) $38,000 Public Records
- 1999-12-15 Sold (Public Records) $38,500 Public Records
Property tax history
-0.1%/yrLatest (2025): $77 · +84.0% YoY. Source: county tax records.
Cash-flow waterfall
monthlySold comps — $/sqft
last 12 mo · ≤1 miLoading sold comps…