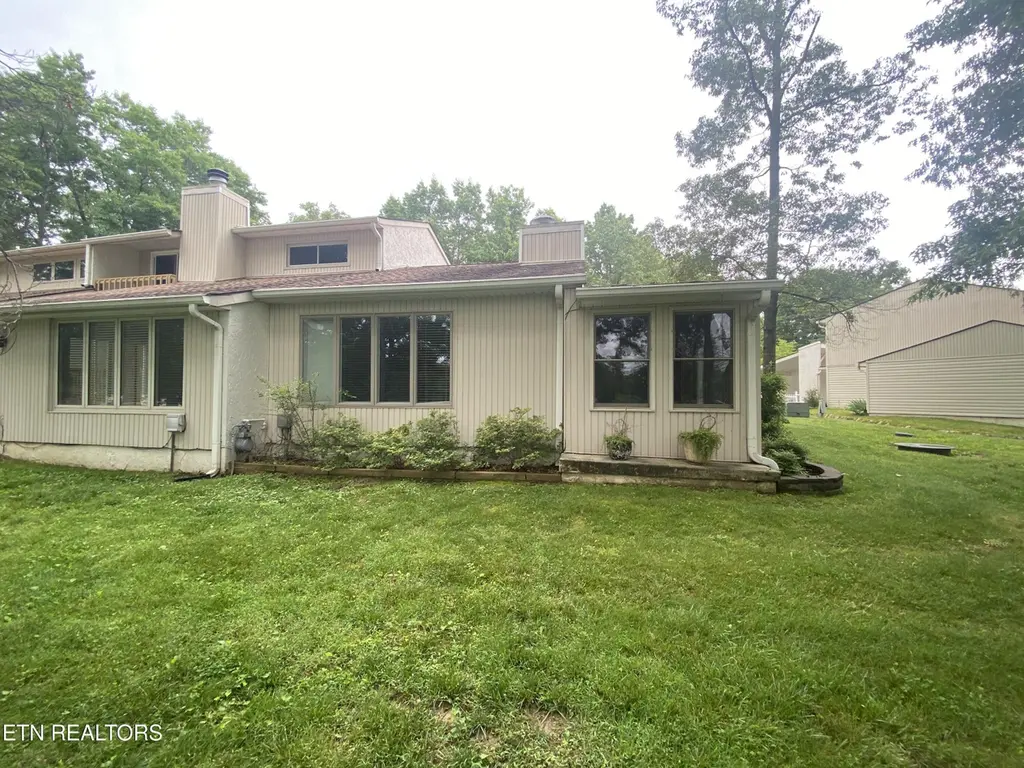
7000 Big Horn Dr Unit A4 · Lake Tansi, TN
Flood risk 1/10 · Minimal
- FEMA flood zone
- X (unshaded)
- Chance of flooding over 30 yrs
- 0.0%
- Est. flood insurance / yr
- $507 – $1,088
Fire risk 3/10 · Minor
- Est. fire insurance / yr
- $949 – $1,763
Heat risk 4/10 · Minor
- Hot days now (above 98°F)
- 7 days/yr
- Hot days in 30 yrs
- 20 days/yr
Wind risk 4/10 · Minor
- Chance of severe wind over 30 yrs
- 10.0%
Air-quality risk 3/10 · Minor
- Unhealthy air days now
- 2 days/yr
- Unhealthy air days in 30 yrs
- 3 days/yr
Risk factors via First Street. Map © Google.
Why this score? — see what drove the D grade
The composite is a weighted blend of 9 inputs, each scored 0–100. Each bar is that input's sub-score; the figure is the points it added to the 100-point composite (weight × sub-score).
- Appreciation +10.0/10.0
- Cash flow +9.5/30.0
- ARV discount +7.5/15.0
- Livability +3.1/5.0
- 1% rule +3.0/10.0
- DSCR +2.7/10.0
- Schools +2.6/10.0
- Rent growth +2.5/5.0
- Condition / age +2.5/5.0
$175,000
🖨 Deal sheet 📄 Offer letter ✓ Due diligence
Listing remarks MLS
Adorable one bedroom condo with New Tiled walk in shower and remodeled bathroom, See through fire place in master to Livingroom, Pantry and Laundry Room, Laminate, tile and carpet flooring , New Stove, Washer and Dryer, & Dishwasher, tile floor in Sunroom, Tile Countertops, New Landscaping, New Exterior Doors and new door on Utility room, one car Carport, Utility room with/for extra storage, Monthly HOA $137, plus $35 +/- when sewer is installed,Lake Tansi Village is additional HOA of $256 Annually, City sewer to be in place in Early 2021. Seller has paid the initial Assessment Fee.
Key facts
- Tiled walk-in shower
- Off street parking
- Double closets
Tags
Property features AI
Finance
- HOA & community: Monthly HOA fee of $206; HOA covers building exterior, association insurance, trash, security, some amenities, and grounds maintenance; Community amenities include golf course, playground, and recreation facilities
Exterior
- Parking: Off-street parking; Carport (1 space); Common parking
- Security: Community security
- Utilities: Public sewer
- Home design: Condominium; Attached unit
- Construction: Stucco and vinyl siding over frame construction; Slab foundation
- Exterior features: Located on a level lot; Golf course front view; Golf community
Interior
- Kitchen: Dishwasher; Refrigerator; Self-cleaning oven
- Flooring: Laminate floors; Carpet
- Bathrooms: One full bathroom
- Heating & cooling: Central heating (electric); Central cooling
- Interior features: Cathedral ceilings; Eat-in kitchen; Five total rooms
Neighborhood map
What this means for you Summary
Snapshot
- This is a 1-bed/1.0-bath condo listed at $175k.
Deal economics
- At list price, monthly cash flow is $-121 ($-1k/yr) — negative.
- To cash-flow at today's rent, offer at most $154k (12.2% below list).
- To meet the 1% rule (rent ≥ 1% of price), the offer needs to be $140k (20.0% below list).
- Recommended offer: $140k (20.0% below list) — sets the bar for 1% rule.
Location & tenants
- Location reads 61/100 on livability (#245 in TN) — a middle-class / working-renter tenant base. Strengths: cost of living A+, housing A+; Watch: employment C-, amenities F, commute F.
- Cumberland County (rural): math 30% / reading 31% proficiency, ranked #59 of 139 in TN (top 42%) — families likely to look elsewhere, expect single-tenant / working-renter base with shorter leases.
- Zoned schools: Frank P. Brown Elementary (math 33% / reading 32%, grade F, #365 of 952 statewide, top 39%, 615 students, 0% FRL); Cumberland County High School (math 28% / reading 41%, grade F, #41 of 332 statewide, top 15%, 985 students, 0% FRL) — zoned schools average 0% FRL vs 56% district-wide (56 pts lower); this property's tenant base skews higher-income than the district average.
- Market conditions: 447 active listings in the ZIP; 114 units permitted in Cumberland County in 2024 (0 in 5+ unit buildings).
Forward outlook
- In year one you build about $19k of equity ($1k loan paydown + $18k appreciation (10.0% local appreciation)).
- Cumberland County population projected at +7% by 2050 — modest demand growth; plan on rents tracking national, not racing it.
- By year 2, paydown + projected appreciation supports a ~$30k cash-out refi (75% LTV) — recoverable capital for the next deal without selling this one.
Negotiation context
- It's been on market 17 days — a 2% lower offer ($172k) is reasonable based on typical stale-listing flexibility.
- 3 sale attempts since 6y ago with the ask held roughly flat each time — persistent listings suggest the price (not the market) is what's stuck; bring a comps-based counter.
Questions for the listing agent
- What do current leases actually rent for vs. the listed asking? Can we see a recent rent roll and the last 12 months of T-12 income?
- Built in 1978 — when were the roof, HVAC, electrical panel, plumbing, and water heater last replaced?
- What does the HOA fee cover, when was the last increase, and are there any pending special assessments or reserve-fund shortfalls?
- Any open or pending special assessments — roof, HVAC, plumbing, elevator, façade? What's the per-unit balance and payoff schedule, and is the seller paying it off at close or rolling it to the buyer?
- Is there a deadline driving the sale (1031 exchange, divorce, estate, relocation)? That informs how much negotiation room exists.
- Schools are F-rated, which usually means shorter tenancies and higher turnover. Who's the typical renter profile here, and what's been the actual vacancy rate?
- The area grade is low — what's the realistic commute time and amenity access for the typical tenant pool here? Any planned neighborhood developments (good or bad) we should know about?
- What's the average days-on-market for RENTAL listings here right now (not sales)? A rising rental-DOM trend means longer vacancies and softer asking-rent achievability than the comps imply.
- What's the recent tenant-quality profile in this submarket — average credit score on applications, eviction rate, late-payment / NSF rate, and stable-employment percentage? A property-management company in the area should have these aggregated.
- How much new apartment / multifamily construction is in the pipeline within 1–3 miles? Heavy new supply (>2% of stock underway) typically softens rents 12–24 months out; light construction supports rent growth.
Investment metrics
- 1% rule
- 0.80% ✗
- Cap rate
- 5.46%
- Cash-on-cash
- -2.97%
- DSCR
- 0.87
- GRM
- 10.4
CMA / ARV
No comps found within radius.
Projected returns pro-forma
10.0% appreciation · 3.0% rent growth · sell at horizon
- IRR
- 22.2%
- Equity multiple
- 2.79×
- Total profit
- $87,630
- Equity at exit
- $157,654
- IRR
- 19.9%
- Equity multiple
- 6.39×
- Total profit
- $264,182
- Equity at exit
- $339,987
Cash invested: $49,000 (down + closing). Projections, not guarantees.
Landlord ↔ Tenant lean methodology
- Overall (STATE)
- 87 Strongly Landlord-Friendly
- State Tennessee
- 87 Strongly Landlord-Friendly · R+13
- County
- — inherits STATE
- City
- — inherits STATE
ZIP-level market 38572
- Home prices YoY
- 10.4%
- Active inventory
- 447
- Price-to-rent
- 10.4×
Monthly cashflow live
- Estimated rent
- $1,399 medium interval (Pro) →
- Mortgage (P&I)
- −$918
- Tax from tax record
- −$30 /mo · $358/yr
- Insurance
- −$73
- HOA
- −$206
- Vacancy / Maint / Mgmt
- −$294
- Net cashflow
- $-121
Break-even live
UW: 25.0% down · 7.5% · 30yr · 1.5% tax · 5.0% vac · 8.0% maint · 8.0% mgmt
Financing live
Cash to close
- Down payment
- $43,750
- Closing costs
- $5,250
- Reserves months
- —
- Total cash needed
- —
Loan-product check · same deal, 3 products live
Conventional
25% down · 7.5% · 30yr
- Down + closing
- —
- Monthly P&I
- —
- Monthly cashflow
- —
- DSCR
- —
- Eligible?
- —
Personal DTI + credit; lowest rate.
DSCR
20% down · 8.5% · 30yr
- Down + closing
- —
- Monthly P&I
- —
- Monthly cashflow
- —
- DSCR
- —
- Eligible?
- —
No personal income docs; deal must DSCR.
Hard money
10% down · 12.0% · 12mo
- Down + closing
- —
- Monthly P&I
- —
- Monthly cashflow
- —
- DSCR
- —
- Eligible?
- —
Short-term bridge; refi at stabilization.
HOA detail condo
- Monthly dues
- $206 · $2,472/yr
- Likely covers
- sewerlandscaping
- Assessments
- None detected in remarks — confirm with the listing agent.
Listing history 13 events
-
2026-06-18days on market $175,000 Active 17 DOM
-
2026-06-17days on market $175,000 Active 16 DOM
-
2026-06-16days on market $175,000 Active 15 DOM
-
2026-06-15days on market $175,000 Active 14 DOM
-
2026-06-13days on market $175,000 Active 12 DOM
-
2026-06-12days on market $175,000 Active 11 DOM
-
2026-06-09days on market $175,000 Active 8 DOM
-
2026-06-08days on market $175,000 Active 7 DOM
-
2026-06-08days on market $175,000 Active 6 DOM
-
2026-06-07days on market $175,000 Active 5 DOM
-
2026-06-03days on market $175,000 Active 2 DOM
-
2026-06-02remarks 699-char remark
-
2026-06-02$175,000 Active 1 DOM
ⓘ Source: listings_history table (triggers on properties + properties_extension) + one-shot
backfill from property_details.listing_events for pre-trigger history.
Tax reassessment forecast TN · Resets to sale price
- Current annual tax
- $358 · $30/mo
- Projected year-2 tax
- $1,242 · $104/mo
- Expected delta
- +$884/yr (+$74/mo · 247.1%)
ⓘ Screening estimate from a state-policy table — verify with the county assessor before closing.
Climate risk First Street
- Flood 1/10 Low FEMA zone X (unshaded) · 0% chance over 30 yrs
- Wildfire 3/10 Moderate
- Heat 4/10 Moderate 7 d/yr ≥98°F today · 20 d/yr by 30 yrs out
- Wind 4/10 Moderate 10% chance of damaging wind over 30 yrs
- Air quality 3/10 Moderate 2 unhealthy d/yr today · 3 by 30 yrs out
Nearby sold comps map
Loading sold comps map…
Walkable amenities ~0.75 mi
Loading nearby amenities…
Taxation est. · year 1
- Rental income
- $16,791
- − Mortgage interest
- −$9,803
- − Property taxes
- −$358
- − Insurance
- −$875
- − Repairs & maintenance
- −$1,343
- − Management
- −$1,343
- − HOA
- −$2,472
- − Depreciation
- −$5,091
- Taxable loss
- −$4,494
- Est. tax savings @ 24.0%
- +$1,079
- After-tax cash flow
- $-374/yr
For passive investors: Depreciation is non-cash, so a rental often shows a tax loss while cash-flowing — sheltering income. Rental losses are passive: they offset passive income freely, and up to $25,000/yr can offset ordinary (W-2) income if you actively participate and your MAGI is under $100k (phasing out to $0 by $150k); unused losses carry forward. On sale, claimed depreciation is recaptured at up to 25%, and gains may owe capital-gains tax (a 1031 exchange can defer both). Figures are a year-1 estimate at your 24.0% rate — not tax advice; consult a CPA.
Schools (NCES district)
- District
- Cumberland County
- NCES district ID
- 4700900
- Math proficiency
- 30% ▼ -10.00%
- Reading proficiency
- 31% ▼ -7.00%
- Median HH income
- $38,510
- Composite
- 25.52/100
- National rank
- #7438
- State rank
- #59 of 139 in TN
Livability — Lake Tansi
- Score
- 61/100
- State rank
- #245
- US rank
- #17630
Category grades
Schools grade is shown separately in the Schools card above.
Census & demographics
- Census place
- Lake Tansi, TN
- Population (ZIP)
- 12,030
Population outlook (Cumberland County) Hauer SSP2
- Today (2025)
- 61,344 people
- By 2030
- 62,611 · +2.1%
- By 2040
- 64,547 · +5.2%
- By 2050
- 65,462 · +6.7%
- By 2075
- 66,839 · +9.0%
- By 2100
- 63,855 · +4.1%
Race, ethnicity, and origin ACS 2023
- Neighborhood character
- Predominantly White (95%)
- Race & ethnicity
- White 95% Hispanic / Latino 3% Two or more races 2%
- Common ancestry
- Romanian 3% Iranian 2% Italian 2%
- Foreign-born
- 1% · Canada
Political lean MEDSL · Cumberland
- 2024 margin
- Solid R (+58.9) · D 20.2% · R 79.1%
- 2008→2024 swing
- -21.8pp toward R · 2008: -37.1pp · 2024: -58.9pp
- All cycles
- 2024: R+58.9 2020: R+57.1 2016: R+57.8 2012: R+49.1 2008: R+37.1
Not yet ingested
- Civics
- —
Market trends
- HPI YoY
- ▲ 34.68%
- Current HPI
- 367.3069
- Rent YoY
- —
- Metro
- —
- State GDP YoY
- ▲ 2.78%
- F500 in state
- 22
Industry mix (Fortune 500 HQ in TN)
| Industry | F500 HQs | Revenue |
|---|---|---|
| Healthcare | 3 | $91B |
|
||
| Retail | 3 | $72B |
|
||
| Transportation / Logistics | 1 | $88B |
|
||
| Paper / Packaging | 1 | $19B |
|
||
| Insurance | 1 | $13B |
|
||
| Energy | 1 | $12B |
|
||
Price history
+207.0% since first listed11 events — show timeline
- 2026-06-01 Listed $175,000 Knoxville MLS
- 2022-09-09 Sold (Public Records) $174,000 Public Records
- 2021-01-04 Sold (Public Records) $123,900 Public Records
- 2021-01-04 Sold (MLS) $123,500 Knoxville MLS
- 2020-12-04 Contingent — Knoxville MLS
- 2020-11-05 Relisted — Knoxville MLS
- 2020-10-29 Listed $123,900 Knoxville MLS
- 2020-03-11 Sold (Public Records) $88,000 Public Records
- 2014-08-11 Sold (Public Records) $78,400 Public Records
- 2013-09-26 Sold (Public Records) $72,000 Public Records
- 1998-11-20 Sold (Public Records) $57,000 Public Records
Property tax history
+1.9%/yrLatest (2025): $358 · +0.0% YoY. Source: county tax records.
Cash-flow waterfall
monthlySold comps — $/sqft
last 12 mo · ≤1 miLoading sold comps…