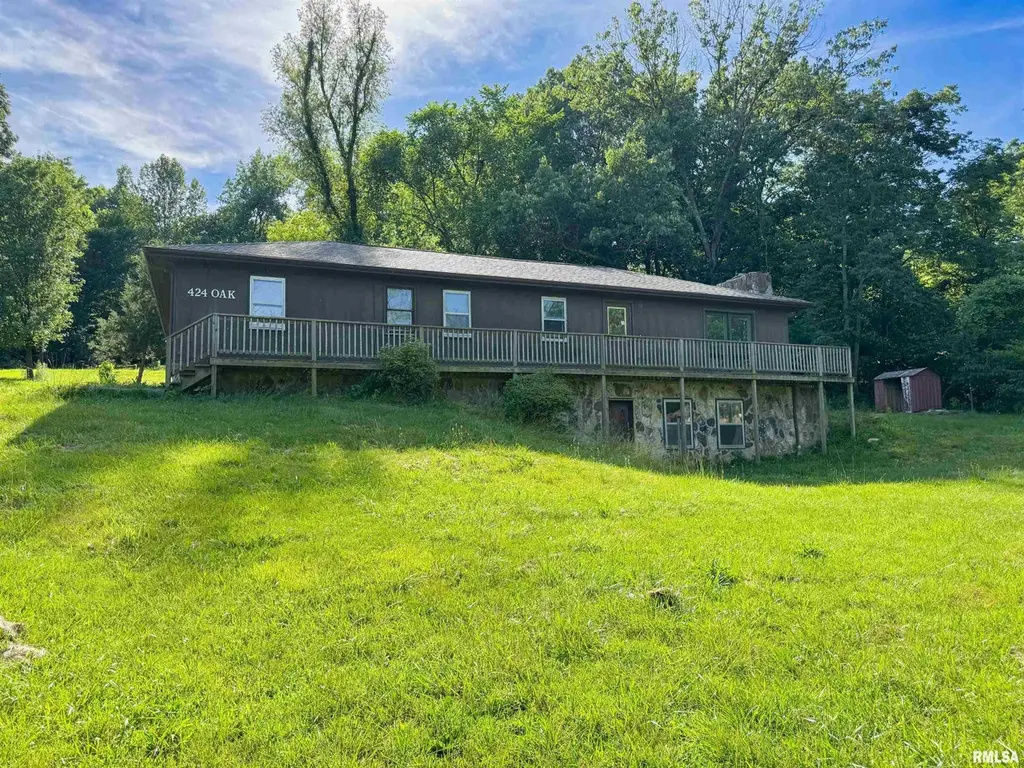
424 Oak St · Cobden, IL
Flood risk 8/10 · Major
- FEMA flood zone
- X (unshaded)
- Chance of flooding over 30 yrs
- 0.99%
- Est. flood insurance / yr
- $473 – $860
Fire risk 1/10 · Minimal
- Est. fire insurance / yr
- $804 – $1,492
Heat risk 4/10 · Minor
- Hot days now (above 107°F)
- 7 days/yr
- Hot days in 30 yrs
- 21 days/yr
Wind risk 2/10 · Minimal
- Chance of severe wind over 30 yrs
- 3.0%
Air-quality risk 1/10 · Minimal
- Unhealthy air days now
- 0 days/yr
- Unhealthy air days in 30 yrs
- 0 days/yr
Risk factors via First Street. Map © Google.
Why this score? — see what drove the B- grade
The composite is a weighted blend of 9 inputs, each scored 0–100. Each bar is that input's sub-score; the figure is the points it added to the 100-point composite (weight × sub-score).
- Cash flow +28.8/30.0
- DSCR +10.0/10.0
- 1% rule +8.3/10.0
- ARV discount +7.5/15.0
- Livability +3.2/5.0
- Schools +3.0/10.0
- Rent growth +2.5/5.0
- Condition / age +2.5/5.0
- Appreciation +0.0/10.0
$84,900
🖨 Deal sheet (PDF) 📄 Offer letter ✓ Due diligence
Listing remarks MLS
This Mobile Home as additions equaling the original square footage. With great curb appeal and a spacious kitchen. The walk out basement would make for a perfect family room featuring and full Stone wall wood fireplace. Basement is also equipped with a lifetime warranted Heli-tech flooding solution. Tucked back off the road, this home offers two large storage buildings with the potential for electric in both and a Geothermal Heating system in the flooring of one. Give us a call today for a showing!
Key facts
- Acreage
- 2-car carport
- Partial basement
Tags
Property features AI
Exterior
- Parking: Carport (no enclosed garage spaces)
- Utilities: Public water
- Home design: Single Family Residence (single wide/mobile body type); Parkwood model/make; Built in 1969; Single-story/mobile layout noted with multiple levels including main, upper, lower, basement and additional level
- Construction: Shingle roof; Walk-out basement (foundation detail)
- Exterior features: Shed(s); Sloped lot
Interior
- Kitchen: Kitchen (approx. 16 x 11.2)
- Bedrooms: 3 bedrooms (bedroom sizes: approx. 14 x 13.8; 13.8 x 10; 12 x 11.5)
- Flooring: Laminate flooring in two bedrooms; Vinyl flooring in kitchen; Other/unknown flooring in living room and one bedroom
- Bathrooms: 1 full bathroom
- Heating & cooling: Electric heating
- Interior features: One fireplace; Walk-out basement
- Laundry & utility: Laundry room (approx. 7.2 x 6.3)
Neighborhood map
What this means for you Summary
Snapshot
- This is a 3-bed/2.0-bath single-family listed at $85k.
Deal economics
- At list price, monthly cash flow is $230 ($3k/yr) — positive.
- The deal already cash-flows at list — no discount required.
- Meets the 1% rule at list price ($1k rent vs $85k).
Location & tenants
- Location reads 63/100 on livability (#734 in IL) — a middle-class / working-renter tenant base. Strengths: crime A+, cost of living A+, housing A+; Watch: employment D, amenities F, commute F.
- Cobden SUD 17 (rural): math 29% / reading 35% proficiency, ranked #462 of 919 in IL (top 50%) — families likely to look elsewhere, expect single-tenant / working-renter base with shorter leases.
- Zoned schools: Cobden Elem School (math 22% / reading 17%, grade F, #1,054 of 2,056 statewide, top 54%, 211 students, 0% FRL); Cobden Jr High School (math 12% / reading 22%, grade F, #460 of 665 statewide, top 72%, 93 students, 0% FRL); Cobden High School (math 24% / reading 24%, grade F, #256 of 693 statewide, top 44%, 161 students, 0% FRL) — zoned schools average 0% FRL vs 55% district-wide (55 pts lower); this property's tenant base skews higher-income than the district average.
- Market conditions: 14 active listings in the ZIP; 10 units permitted in Union County in 2024 (0 in 5+ unit buildings).
Forward outlook
- Local home prices are declining (-3.0%/yr); year-one equity from $587 of loan paydown is wiped out by about $3k of value loss. Plan a longer hold.
- Union County population projected at -18% by 2050 — secular population decline; favor cash flow + early exit over multi-decade hold.
- At projected returns (-3.0% appreciation + 3.0% rent growth), your $24k cash investment doubles in ~10 years — after that, you're playing with house money.
Negotiation context
- Only 10 days on market — expect competitive offers; lowballing is unlikely to land.
- 3 sale attempts since 7y ago with the ask held roughly flat each time — persistent listings suggest the price (not the market) is what's stuck; bring a comps-based counter.
Risks & watch-outs
- Watch-outs: flood insurance adds $56/mo.
- Climate carrying-cost: severe flood risk — expect insurance premiums to compound above CPI over the hold.
Questions for the listing agent
- Built in 1969 — when were the roof, HVAC, electrical panel, plumbing, and water heater last replaced?
- What's the actual annual flood-insurance premium (NFIP or private), and is the property in a SFHA with mandatory coverage?
- Is there a deadline driving the sale (1031 exchange, divorce, estate, relocation)? That informs how much negotiation room exists.
- Schools are F-rated, which usually means shorter tenancies and higher turnover. Who's the typical renter profile here, and what's been the actual vacancy rate?
- What's the average days-on-market for RENTAL listings here right now (not sales)? A rising rental-DOM trend means longer vacancies and softer asking-rent achievability than the comps imply.
- What's the recent tenant-quality profile in this submarket — average credit score on applications, eviction rate, late-payment / NSF rate, and stable-employment percentage? A property-management company in the area should have these aggregated.
- How much new for-sale + rental construction is in the pipeline within 1–3 miles? Heavy new supply typically softens prices + rents 12–24 months out; constrained supply supports both.
Investment metrics
- 1% rule
- 1.33% ✓
- Cap rate
- 10.33%
- Cash-on-cash
- 14.42%
- DSCR
- 1.64
- GRM
- 6.3
CMA / ARV
- ARV (on-the-fly)
- $259,200
- Comps found
- 2
Show comp detail 2 sales within ~0.75 mi
| Address | Dist | Beds/Ba | Sqft | Sold | Price | $/sf | Match |
|---|---|---|---|---|---|---|---|
| 2540 N Old Hwy 51 Hwy | 0.21mi | 3/2.0 | 1,920 (+7%) | 15mo | $241,000 | $126 | 66 |
| 415 Oak St | 0.12mi | 3/2.0 | 2,042 (+13%) | 11mo | $295,000 | $144 | 62 |
Match score weights: distance 35% · size 25% · config 20% · recency 20%. Top-matched comps best support the ARV.
Projected returns pro-forma
-3.0% appreciation · 3.0% rent growth · sell at horizon
- IRR
- 1.1%
- Equity multiple
- 1.04×
- Total profit
- $957
- Equity at exit
- $12,659
- IRR
- 10.7%
- Equity multiple
- 1.84×
- Total profit
- $19,957
- Equity at exit
- $7,341
Cash invested: $23,772 (down + closing). Projections, not guarantees.
Landlord ↔ Tenant lean methodology
- Overall (STATE)
- 43 Moderately Tenant-Leaning
- State Illinois
- 43 Moderately Tenant-Leaning · D+7
- County
- — inherits STATE
- City
- — inherits STATE
ZIP-level market 62920
- Home prices YoY
- -25.8%
- Active inventory
- 14
- Price-to-rent
- 6.3×
Monthly cashflow live
- Estimated rent
- $1,130 medium interval (Pro) →
- Mortgage (P&I)
- −$445
- Tax from tax record
- −$126 /mo · $1,514/yr
- Insurance
- −$35
- Flood insurance flood zone
- −$56 /mo · $666/yr
- HOA
- −$0
- Vacancy / Maint / Mgmt
- −$237
- Net cashflow
- $230
Break-even live
Sensitivity live
| Price | -10% $278 | -5% $254 | +0% $230 | +5% $206 | +10% $182 |
|---|---|---|---|---|---|
| Rent | -10% $141 | -5% $185 | +0% $230 | +5% $275 | +10% $319 |
| Rate | -1.0pp $273 | -0.5pp $252 | base $230 | +0.5pp $208 | +1.0pp $186 |
UW: 25.0% down · 7.5% · 30yr · 1.5% tax · 5.0% vac · 8.0% maint · 8.0% mgmt
Financing live
Cash to close
- Down payment
- $21,225
- Closing costs
- $2,547
- Reserves months
- —
- Total cash needed
- —
Loan-product check · same deal, 3 products live
Conventional
25% down · 7.5% · 30yr
- Down + closing
- —
- Monthly P&I
- —
- Monthly cashflow
- —
- DSCR
- —
- Eligible?
- —
Personal DTI + credit; lowest rate.
DSCR
20% down · 8.5% · 30yr
- Down + closing
- —
- Monthly P&I
- —
- Monthly cashflow
- —
- DSCR
- —
- Eligible?
- —
No personal income docs; deal must DSCR.
Hard money
10% down · 12.0% · 12mo
- Down + closing
- —
- Monthly P&I
- —
- Monthly cashflow
- —
- DSCR
- —
- Eligible?
- —
Short-term bridge; refi at stabilization.
Listing history 9 events
-
2026-06-22days on market $84,900 Under Contract 10 DOM
-
2026-06-21days on market $84,900 Under Contract 9 DOM
-
2026-06-21statusdays on market $84,900 Under Contract 8 DOM
-
2026-06-18days on market $84,900 Active 6 DOM
-
2026-06-17days on market $84,900 Active 5 DOM
-
2026-06-16days on market $84,900 Active 4 DOM
-
2026-06-15days on market $84,900 Active 3 DOM
-
2026-06-13remarks 693-char remark
-
2026-06-13$84,900 Active 1 DOM
ⓘ Source: listings_history table (triggers on properties + properties_extension) + one-shot
backfill from property_details.listing_events for pre-trigger history.
Tax reassessment forecast IL · Partial reset (capped growth)
- Current annual tax
- $1,514 · $126/mo
- Projected year-2 tax
- $1,721 · $143/mo
- Expected delta
- +$207/yr (+$17/mo · 13.7%)
ⓘ Screening estimate from a state-policy table — verify with the county assessor before closing.
Climate risk First Street
- Flood 8/10 Severe FEMA zone X (unshaded) · 99% chance over 30 yrs
- Wildfire 1/10 Low
- Heat 4/10 Moderate 7 d/yr ≥107°F today · 21 d/yr by 30 yrs out
- Wind 2/10 Low 3% chance of damaging wind over 30 yrs
- Air quality 1/10 Low 0 unhealthy d/yr today · 0 by 30 yrs out
Nearby sold comps map
Loading sold comps map…
Walkable amenities ~0.75 mi
Loading nearby amenities…
Taxation est. · year 1
- Rental income
- $13,554
- − Mortgage interest
- −$4,756
- − Property taxes
- −$1,514
- − Insurance
- −$1,091
- − Repairs & maintenance
- −$1,084
- − Management
- −$1,084
- − Depreciation
- −$2,470
- Taxable income
- $1,555
- Est. tax owed @ 24.0%
- −$373
- After-tax cash flow
- $2,387/yr
For passive investors: Depreciation is non-cash, so a rental often shows a tax loss while cash-flowing — sheltering income. Rental losses are passive: they offset passive income freely, and up to $25,000/yr can offset ordinary (W-2) income if you actively participate and your MAGI is under $100k (phasing out to $0 by $150k); unused losses carry forward. On sale, claimed depreciation is recaptured at up to 25%, and gains may owe capital-gains tax (a 1031 exchange can defer both). Figures are a year-1 estimate at your 24.0% rate — not tax advice; consult a CPA.
Schools (NCES district)
- District
- Cobden SUD 17
- NCES district ID
- 1710570
- Math proficiency
- 29% ▬ 0.00%
- Reading proficiency
- 35% ▲ 7.00%
- Median HH income
- $42,993
- Composite
- 29.93/100
- National rank
- #11665
- State rank
- #462 of 919 in IL
Livability — Cobden
- Score
- 63/100
- State rank
- #734
- US rank
- #14877
Category grades
Schools grade is shown separately in the Schools card above.
Census & demographics
- Census place
- Cobden, IL
- Population (ZIP)
- 2,872
Population outlook (Union County) Hauer SSP2
- Today (2025)
- 16,606 people
- By 2030
- 16,055 · -3.3%
- By 2040
- 14,875 · -10.4%
- By 2050
- 13,645 · -17.8%
- By 2075
- 10,704 · -35.5%
- By 2100
- 7,880 · -52.5%
Race, ethnicity, and origin ACS 2023
- Neighborhood character
- Predominantly White (81%)
- Race & ethnicity
- White 81% Two or more races 17% Hispanic / Latino 15%
- Hispanic origin (detail)
- Mexican 14%
- Common ancestry
- Lithuanian 3% Romanian 2% Slovak 2%
- Foreign-born
- 8% · Canada
- Languages at home
- 85% English-only · Spanish 15%
Political lean MEDSL · Union
- 2024 margin
- Solid R (+43.2) · D 27.8% · R 71.0% · Other 1.2%
- 2008→2024 swing
- -31.3pp toward R · 2008: -11.9pp · 2024: -43.2pp
- All cycles
- 2024: R+43.2 2020: R+40.2 2016: R+39.8 2012: R+21.9 2008: R+11.9
Not yet ingested
- Civics
- —
Market trends
- HPI YoY
- ▼ -49.03%
- Current HPI
- 140.9879
- Rent YoY
- —
- Metro
- —
- State GDP YoY
- ▲ 1.59%
- F500 in state
- 60
Industry mix (Fortune 500 HQ in IL)
| Industry | F500 HQs | Revenue |
|---|---|---|
| Insurance | 4 | $201B |
|
||
| Consumer Goods | 4 | $87B |
|
||
| Industrial Machinery | 3 | $64B |
|
||
| Healthcare | 2 | $55B |
|
||
| Retail / Pharmacy | 1 | $148B |
|
||
| Agriculture / Food | 1 | $86B |
|
||
Price history
-3.2% since first listed5 events — show timeline
- 2026-06-12 Listed $84,900 RMLSA as Distributed by MLS Grid
- 2020-08-29 Sold (MLS) $75,000 MRED as Distributed by MLS Grid
- 2020-08-29 Sold (MLS) $75,000 RMLSA as Distributed by MLS Grid
- 2019-12-02 Listed $87,700 MRED as Distributed by MLS Grid
- 2019-12-02 Listed $87,700 RMLSA as Distributed by MLS Grid
Property tax history
-1.1%/yrLatest (2024): $1,514 · +10.4% YoY. Source: county tax records.
Cash-flow waterfall
monthlySold comps — $/sqft
last 12 mo · ≤1 miLoading sold comps…