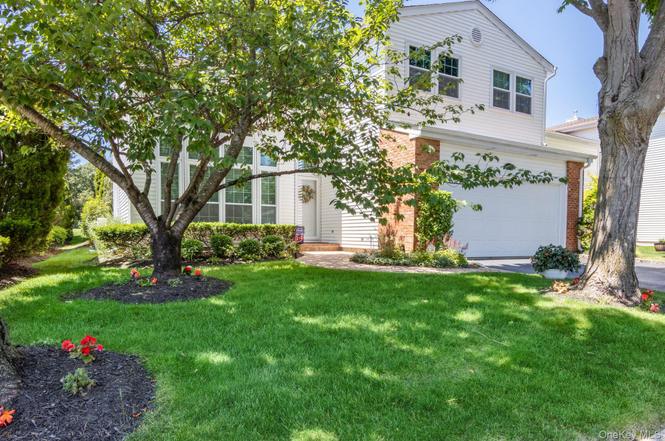
89 Hamlet Dr · Commack, NY
Flood risk 1/10 · Minimal
- FEMA flood zone
- X (unshaded)
- Chance of flooding over 30 yrs
- 0.0%
- Est. flood insurance / yr
- $473 – $860
Fire risk 1/10 · Minimal
- Est. fire insurance / yr
- $691 – $1,283
Heat risk 5/10 · Moderate
- Hot days now (above 98°F)
- 7 days/yr
- Hot days in 30 yrs
- 16 days/yr
Wind risk 6/10 · Moderate
- Chance of severe wind over 30 yrs
- 77.0%
Air-quality risk 4/10 · Minor
- Unhealthy air days now
- 4 days/yr
- Unhealthy air days in 30 yrs
- 6 days/yr
Risk factors via First Street. Map © Google.
Why this score? — see what drove the D+ grade
The composite is a weighted blend of 9 inputs, each scored 0–100. Each bar is that input's sub-score; the figure is the points it added to the 100-point composite (weight × sub-score).
- ARV discount +14.3/15.0
- Cash flow +10.9/30.0
- Schools +7.0/10.0
- 1% rule +3.8/10.0
- Livability +3.7/5.0
- DSCR +3.1/10.0
- Rent growth +2.5/5.0
- Condition / age +2.5/5.0
- Appreciation +0.0/10.0
$1,365,000
🖨 Deal sheet (PDF) 📄 Offer letter ✓ Due diligence
Listing remarks
YOU BELONG HERE! The beautiful, gated community of The Hamlet Golf and Country Club in Commack is a special lifestyle. A full social calendar for you to make memories and lifelong friends. Enjoy year round golf on the private, world class golf course and practice facility designed by Stephen Kay. Workout in the newly renovated, state of the art fitness center - they even offer multiple classes to join. The tennis and pickleball court complex with lights so you can play day and night. The facility has 8 tennis courts: 6 hard courts and 2 Har-Tru courts. It also has 6 pickleball courts. Resort style heated pool with expansive pool deck, cabana bar and snack bar. Take a culinary journey either
Key facts
- Wine cellar
- Gated golf community
- $504 HOA
Tags
Neighborhood map
What this means for you Summary
Snapshot
- This is a 4-bed/3.5-bath single-family listed at $1.36M.
Deal economics
- At list price, monthly cash flow is $-609 ($-7k/yr) — negative.
- To cash-flow at today's rent, offer at most $1.26M (7.9% below list).
- To meet the 1% rule (rent ≥ 1% of price), the offer needs to be $1.20M (12.1% below list).
- Recommended offer: $1.20M (12.1% below list) — sets the bar for 1% rule.
- Cap rate 5.8% vs local median 3.3% in Commack — top-decile yield for the area; either an underpriced asset or a hidden risk that comps aren't pricing in. Stress-test before assuming the spread holds.
Location & tenants
- Location reads 73/100 on livability (#319 in NY) — a middle-class / working-renter tenant base. Strengths: employment A+, housing A+, crime A; Watch: amenities D, cost of living F, health & safety F.
- Commack Union Free School District (suburban): math 70% / reading 79% proficiency, ranked #61 of 590 in NY (top 10%) — strong family-tenant draw, lease renewals of 3-5y typical; only 5% free/reduced lunch — higher-income household profile.
- Zoned schools: Rolling Hills School (229 students, 20% FRL); Commack Middle School (math 54% / reading 67%, grade B+, #153 of 729 statewide, top 21%, 1,322 students, 16% FRL); Commack High School (math 98% / reading 97%, grade A+, #19 of 1,100 statewide, top 4%, 1,861 students, 15% FRL).
- Market conditions: 102 active listings in the ZIP; 1 comparable units currently listed for rent nearby; 1,366 units permitted in Suffolk County in 2024 (216 in 5+ unit buildings).
Forward outlook
- Local home prices are declining (-3.0%/yr); year-one equity from $9k of loan paydown is wiped out by about $41k of value loss. Plan a longer hold.
- Suffolk County population projected to shrink 5% by 2050 — rents likely to lag national; underwrite the cash flow, not the appreciation.
Negotiation context
- It's been on market 102 days — a 9% lower offer ($1.24M) is reasonable based on typical stale-listing flexibility.
- 6 sale attempts since 7y ago with the ask held roughly flat each time — persistent listings suggest the price (not the market) is what's stuck; bring a comps-based counter.
- Current owner paid $670k; list at $1.36M implies a 104% gain — meaningful room to come down on a strong offer.
Risks & watch-outs
- Climate carrying-cost: major wind risk, 77% chance of damaging wind over 30y; extreme-heat days projected 7→16/yr by 2055 (HVAC capex compounding) — expect insurance premiums to compound above CPI over the hold.
Questions for the listing agent
- What do current leases actually rent for vs. the listed asking? Can we see a recent rent roll and the last 12 months of T-12 income?
- It's been on market 102 days. Have you received any prior offers? Is the seller open to a 12% concession, seller financing, or rate buy-down credit?
- What does the HOA fee cover, when was the last increase, and are there any pending special assessments or reserve-fund shortfalls?
- Why hasn't it sold? Are there any deal-killer items the seller is aware of (foundation, flood, title, zoning, code violations)?
- Is there a deadline driving the sale (1031 exchange, divorce, estate, relocation)? That informs how much negotiation room exists.
- Schools are A-rated — typically a magnet for longer-tenancy family renters. What's the average tenant stay here, and is there a school-zone premium baked into asking?
- The area grade is low — what's the realistic commute time and amenity access for the typical tenant pool here? Any planned neighborhood developments (good or bad) we should know about?
- What's the average days-on-market for RENTAL listings here right now (not sales)? A rising rental-DOM trend means longer vacancies and softer asking-rent achievability than the comps imply.
- What's the recent tenant-quality profile in this submarket — average credit score on applications, eviction rate, late-payment / NSF rate, and stable-employment percentage? A property-management company in the area should have these aggregated.
- How much new for-sale + rental construction is in the pipeline within 1–3 miles? Heavy new supply typically softens prices + rents 12–24 months out; constrained supply supports both.
Investment metrics
- 1% rule
- 0.88% ✗
- Cap rate
- 5.76%
- Cash-on-cash
- -1.91%
- DSCR
- 0.91
- GRM
- 9.5
CMA / ARV
- ARV (on-the-fly)
- $1,606,800
- Comps found
- 4
Show comp detail 4 sales within ~0.75 mi
| Address | Dist | Beds/Ba | Sqft | Sold | Price | $/sf | Match |
|---|---|---|---|---|---|---|---|
| 63 Hamlet Dr #63 | 0.13mi | 3/3.5 (-1) | 3,600 (-8%) | 11mo | $999,000 | $278 | 67 |
| 244 Daly Rd | 0.13mi | 5/4.0 (+1) | 4,086 (+5%) | 21mo | $1,275,000 | $312 | 62 |
| 19 Blacksmith Ln | 0.29mi | 5/3.5 (+1) | 3,317 (-15%) | 18mo | $1,375,000 | $415 | 42 |
| 20 Mclane Dr | 0.61mi | 5/4.0 (+1) | 3,400 (-13%) | 13mo | $1,400,000 | $412 | 32 |
Match score weights: distance 35% · size 25% · config 20% · recency 20%. Top-matched comps best support the ARV.
Projected returns pro-forma
-3.0% appreciation · 3.0% rent growth · sell at horizon
- IRR
- -19.4%
- Equity multiple
- 0.32×
- Total profit
- $-259,419
- Equity at exit
- $203,526
- IRR
- -12.0%
- Equity multiple
- 0.28×
- Total profit
- $-273,503
- Equity at exit
- $118,020
Cash invested: $382,200 (down + closing). Projections, not guarantees.
Landlord ↔ Tenant lean methodology
- Overall (STATE)
- 15 Strongly Tenant-Friendly
- State New York
- 15 Strongly Tenant-Friendly · D+10
- County
- — inherits STATE
- City
- — inherits STATE
ZIP-level market 11725
- Active inventory
- 102
- Price-to-rent
- 9.5×
Monthly cashflow live
- Estimated rent
- $12,000 medium interval (Pro) →
- Mortgage (P&I)
- −$7,158
- Tax from tax record
- −$1,858 /mo · $22,302/yr
- Insurance
- −$569
- HOA
- −$504
- Vacancy / Maint / Mgmt
- −$2,520
- Net cashflow
- $-609
Break-even live
Sensitivity live
| Price | -10% $163 | -5% $-223 | +0% $-609 | +5% $-996 | +10% $-1,382 |
|---|---|---|---|---|---|
| Rent | -10% $-1,557 | -5% $-1,083 | +0% $-609 | +5% $-135 | +10% $339 |
| Rate | -1.0pp $78 | -0.5pp $-262 | base $-609 | +0.5pp $-963 | +1.0pp $-1,323 |
UW: 25.0% down · 7.5% · 30yr · 1.5% tax · 5.0% vac · 8.0% maint · 8.0% mgmt
Financing live
Cash to close
- Down payment
- $341,250
- Closing costs
- $40,950
- Reserves months
- —
- Total cash needed
- —
Loan-product check · same deal, 3 products live
Conventional
25% down · 7.5% · 30yr
- Down + closing
- —
- Monthly P&I
- —
- Monthly cashflow
- —
- DSCR
- —
- Eligible?
- —
Personal DTI + credit; lowest rate.
DSCR
20% down · 8.5% · 30yr
- Down + closing
- —
- Monthly P&I
- —
- Monthly cashflow
- —
- DSCR
- —
- Eligible?
- —
No personal income docs; deal must DSCR.
Hard money
10% down · 12.0% · 12mo
- Down + closing
- —
- Monthly P&I
- —
- Monthly cashflow
- —
- DSCR
- —
- Eligible?
- —
Short-term bridge; refi at stabilization.
Rent comps 1 comps
| Address | Beds | Baths | Sqft | Rent | $/sqft | DOM | Units | Dist |
|---|---|---|---|---|---|---|---|---|
| 28 McCulloch Dr Dix Hills, NY | 4.0 | 3.5 | 3800 | $12,000 | $3.16 | 46d | 1 | 0.83mi |
HOA detail
- Monthly dues
- $504 · $6,048/yr
- Likely covers
- poolgymsecurity
Listing history 18 events
-
2026-02-02status Pending
-
2026-01-25status Active
-
2026-01-25historical
-
2025-12-10price $1,365,000
-
2025-10-24$1,375,000 Active
-
2025-10-24historical
-
2025-10-01price $1,375,000
-
2025-08-15$1,395,000 Active
-
2025-08-15historical
-
2025-08-14$1,395,000 Active
-
2025-08-14historical
-
2025-06-24$1,395,000 Active
-
2019-12-30soldstatus $670,000
-
2019-11-06soldstatus $670,000 Closed
-
2019-09-18status Under Contract
-
2019-07-24price $709,000
-
2019-03-05$749,000 New
-
2005-08-17soldstatus $850,000
ⓘ Source: listings_history table (triggers on properties + properties_extension) + one-shot
backfill from property_details.listing_events for pre-trigger history.
Tax reassessment forecast NY · Partial reset (capped growth)
- Current annual tax
- $22,302 · $1,858/mo
- Projected year-2 tax
- $22,685 · $1,890/mo
- Expected delta
- +$383/yr (+$32/mo · 1.7%)
ⓘ Screening estimate from a state-policy table — verify with the county assessor before closing.
Climate risk First Street
- Flood 1/10 Low FEMA zone X (unshaded) · 0% chance over 30 yrs
- Wildfire 1/10 Low
- Heat 5/10 Major 7 d/yr ≥98°F today · 16 d/yr by 30 yrs out
- Wind 6/10 Major 77% chance of damaging wind over 30 yrs
- Air quality 4/10 Moderate 4 unhealthy d/yr today · 6 by 30 yrs out
Nearby sold comps map
Loading sold comps map…
Walkable amenities ~0.75 mi
Loading nearby amenities…
Taxation est. · year 1
- Rental income
- $144,000
- − Mortgage interest
- −$76,461
- − Property taxes
- −$22,302
- − Insurance
- −$6,825
- − Repairs & maintenance
- −$11,520
- − Management
- −$11,520
- − HOA
- −$6,048
- − Depreciation
- −$39,709
- Taxable loss
- −$30,385
- Est. tax savings @ 24.0%
- +$7,292
- After-tax cash flow
- $-21/yr
For passive investors: Depreciation is non-cash, so a rental often shows a tax loss while cash-flowing — sheltering income. Rental losses are passive: they offset passive income freely, and up to $25,000/yr can offset ordinary (W-2) income if you actively participate and your MAGI is under $100k (phasing out to $0 by $150k); unused losses carry forward. On sale, claimed depreciation is recaptured at up to 25%, and gains may owe capital-gains tax (a 1031 exchange can defer both). Figures are a year-1 estimate at your 24.0% rate — not tax advice; consult a CPA.
Schools (NCES district)
- District
- Commack Union Free School District
- NCES district ID
- 3608130
- Math proficiency
- 70% ▼ -8.00%
- Reading proficiency
- 79% ▲ 4.00%
- Median HH income
- $117,583
- Composite
- 69.52/100
- National rank
- #306
- State rank
- #61 of 590 in NY
Livability — Commack
- Score
- 73/100
- State rank
- #319
- US rank
- #5296
Category grades
Schools grade is shown separately in the Schools card above.
Census & demographics
- Census place
- Commack, NY
- City population
- 58,941
- Population (ZIP)
- 29,050
Population outlook (Suffolk County) Hauer SSP2
- Today (2025)
- 1,505,262 people
- By 2030
- 1,498,318 · -0.5%
- By 2040
- 1,471,101 · -2.3%
- By 2050
- 1,424,848 · -5.3%
- By 2075
- 1,337,157 · -11.2%
- By 2100
- 1,217,720 · -19.1%
Race, ethnicity, and origin ACS 2023
- Neighborhood character
- Predominantly White (81%)
- Race & ethnicity
- White 81% Hispanic / Latino 10% Asian 6% Two or more races 5% Black 2%
- Hispanic origin (detail)
- Puerto Rican 4%
- Common ancestry
- Romanian 5% Scotch-Irish 5% Italian 2%
- Foreign-born
- 10% · Canada, China, Jamaica
- Languages at home
- 85% English-only · Other Indo-European 4% Spanish 3% Russian/Polish/Slavic 2%
Political lean MEDSL · Suffolk
- 2024 margin
- Lean R (+10.0) · D 45.0% · R 55.0%
- 2008→2024 swing
- -16.0pp toward R · 2008: 6.0pp · 2024: -10.0pp
- All cycles
- 2024: R+10.0 2020: R+0.0 2016: R+8.2 2012: D+2.9 2008: D+6.0
Not yet ingested
- Civics
- —
Market trends
- HPI YoY
- ▼ -795.52%
- Current HPI
- 262.3806
- Rent YoY
- —
- Metro
- —
- State GDP YoY
- ▲ 2.60%
- F500 in state
- 92
Industry mix (Fortune 500 HQ in NY)
| Industry | F500 HQs | Revenue |
|---|---|---|
| Financial Services | 10 | $950B |
|
||
| Consumer Goods | 9 | $162B |
|
||
| Insurance | 4 | $225B |
|
||
| Telecommunications | 2 | $144B |
|
||
| Pharmaceuticals | 2 | $112B |
|
||
| Media / Entertainment | 2 | $69B |
|
||
Price history
+60.6% since first listed18 events — show timeline
- 2026-02-02 Pending — OneKey® MLS as Distributed by MLS Grid
- 2026-01-25 Relisted — OneKey® MLS as Distributed by MLS Grid
- 2026-01-25 Listing Removed — OneKey® MLS as Distributed by MLS Grid
- 2025-12-10 Price Changed $1,365,000 OneKey® MLS as Distributed by MLS Grid
- 2025-10-24 Listed $1,375,000 OneKey® MLS as Distributed by MLS Grid
- 2025-10-24 Listing Removed — OneKey® MLS as Distributed by MLS Grid
- 2025-10-01 Price Changed $1,375,000 OneKey® MLS as Distributed by MLS Grid
- 2025-08-15 Listed $1,395,000 OneKey® MLS as Distributed by MLS Grid
- 2025-08-15 Coming Soon — OneKey® MLS as Distributed by MLS Grid
- 2025-08-14 Listing Removed — OneKey® MLS as Distributed by MLS Grid
- 2025-08-14 Listed $1,395,000 OneKey® MLS as Distributed by MLS Grid
- 2025-06-24 Listed $1,395,000 OneKey® MLS as Distributed by MLS Grid
- 2019-12-30 Sold (Public Records) $670,000 Public Records
- 2019-11-06 Sold (MLS) $670,000 OneKey® MLS as Distributed by MLS Grid
- 2019-09-18 Pending — OneKey® MLS as Distributed by MLS Grid
- 2019-07-24 Price Changed $709,000 OneKey® MLS as Distributed by MLS Grid
- 2019-03-05 Listed $749,000 OneKey® MLS as Distributed by MLS Grid
- 2005-08-17 Sold (Public Records) $850,000 Public Records
Property tax history
+3.0%/yrLatest (2025): $22,302 · +0.0% YoY. Source: county tax records.
Cash-flow waterfall
monthlySold comps — $/sqft
last 12 mo · ≤1 miLoading sold comps…