 Multi-family
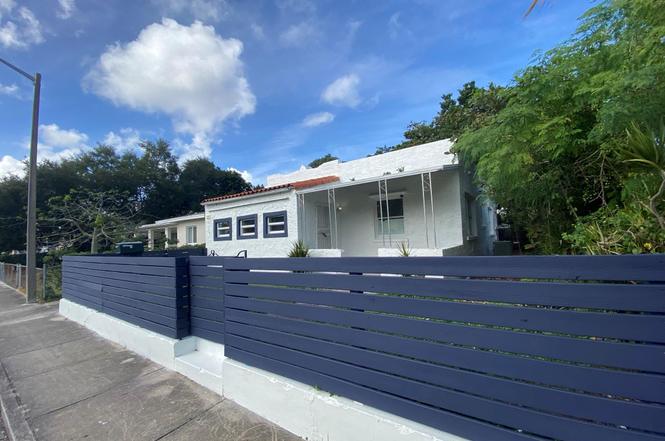
55 NW 47th St · Miami, FL
Flood risk 1/10 · Minimal
- FEMA flood zone
- X (unshaded)
- Chance of flooding over 30 yrs
- 0.0%
- Est. flood insurance / yr
- $507 – $1,088
Fire risk 1/10 · Minimal
- Est. fire insurance / yr
- $947 – $1,759
Heat risk 10/10 · Severe
- Hot days now (above 103°F)
- 7 days/yr
- Hot days in 30 yrs
- 29 days/yr
Wind risk 10/10 · Severe
- Chance of severe wind over 30 yrs
- 99.0%
Air-quality risk 2/10 · Minimal
- Unhealthy air days now
- 1 days/yr
- Unhealthy air days in 30 yrs
- 1 days/yr
Risk factors via First Street. Map © Google.
Why this score? — see what drove the F grade
The composite is a weighted blend of 9 inputs, each scored 0–100. Each bar is that input's sub-score; the figure is the points it added to the 100-point composite (weight × sub-score).
- ARV discount +7.5/15.0
- Schools +4.2/10.0
- Livability +3.9/5.0
- Rent growth +3.1/5.0
- Condition / age +2.5/5.0
- Cash flow +1.9/30.0
- 1% rule +0.0/10.0
- DSCR +0.0/10.0
- Appreciation +0.0/10.0
$1,050,000
🖨 Deal sheet 📄 Offer letter ✓ Due diligence
Multi-family units
County records classify this as Multi-Family (2-4 Unit). Listing-text estimate: 1 unit. estimate disagrees with records
Listing remarks
Excellent for Owner/Occupant or for income potential. Excellent opportunity for VACATION RENTAL TURN KEY OPERATION FULLY FURNISHED consisiting of a total of 6 bedrooms / 4 baths (4 Bedrooms and 2 bathrooms in main house, plus a rear guest house with 2 bedroom 2 baths that Owner can live in /or rent separately for extra income). Great location being just a couple blocks to the Miami Design District, Wynwood, Shopping Mall, all types of restaurants, plus main access roads including I-95. This property is in good condition. It has porcelain tile floors throughout plus many upgrades including a brand new roof in 2023. Impact windows and doors, great deal for the money in this quiet residential
Key facts
- Turn key operation
- Guest house
- Fully furnished
Tags
Property features AI
Finance
- Financial info: Two total units (property is a 2-unit duplex); 22 units in the community
- HOA & community: Association fees cover sewer and trash
Exterior
- Utilities: Public water; Public sewer; Cable available
- Home design: Duplex; Single-story
- Construction: CBS construction
- Exterior features: Porch; Not waterfront
Interior
- Flooring: Ceramic tile; Tile
- Heating & cooling: Central heating with separate meters; Central air conditioning; Ceiling fans; Wall/window units
- Interior features: Blinds; Double-hung metal windows
Neighborhood map
What this means for you Summary
Snapshot
- This is a 3-bed/1.0-bath multifamily listed at $1.05M.
Deal economics
- At list price, monthly cash flow is $-4k ($-47k/yr) — negative.
- To cash-flow at today's rent, offer at most $354k (66.3% below list).
- To meet the 1% rule (rent ≥ 1% of price), the offer needs to be $357k (66.0% below list).
- Recommended offer: $354k (66.3% below list) — sets the bar for cash-flow.
Location & tenants
- Location reads 78/100 on livability (#177 in FL, #2,724 nationally) — a middle-class / working-renter tenant base. Strengths: amenities A+, commute A+, health & safety A+; Watch: employment C-, crime F, cost of living F.
- Miami-Dade (suburban): math 45% / reading 54% proficiency, ranked #40 of 73 in FL (top 55%) — families likely to look elsewhere, expect single-tenant / working-renter base with shorter leases; 64% free/reduced lunch — lower-income household profile, screen leases tightly.
- Zoned schools: Shadowlawn Elementary School (math 42% / reading 37%, grade F, #1,513 of 2,144 statewide, top 73%, 129 students, 84% FRL); Jose De Diego Middle School (math 20% / reading 24%, grade F, #549 of 571 statewide, top 97%, 868 students, 68% FRL); Miami Edison Senior High School (math 19% / reading 15%, grade F, #597 of 667 statewide, top 90%, 623 students, 72% FRL).
- Zoned-school proficiency averages 26% at this address vs 50% district-wide (-23 pts) — the specific schools serving this property underperform the Miami-Dade average; the district grade overstates school quality for this exact location.
- Market conditions: Rents rising (+2.3%/yr); 295 active listings in the ZIP; 5 comparable units currently listed for rent nearby; rentals leasing fast (median 3d on market — plan ~1-2 weeks tenant-placement turnaround); lower-income renter base — watch delinquency; 10,051 units permitted in Miami-Dade County in 2024 (7,758 in 5+ unit buildings).
- At $3,566/mo this rent would consume 104% of the median local household income ($41k/yr) (locally 2523% of renters already pay >50% of income on rent) — very limited rent-growth headroom before tenants either downsize or default.
Forward outlook
- Local home prices are declining (-3.0%/yr); year-one equity from $7k of loan paydown is wiped out by about $32k of value loss. Plan a longer hold.
- Miami-Dade County population projected at +28% by 2050 — long-run rental-demand tailwind backs the buy-and-hold thesis.
Negotiation context
- It's been on market 99 days — a 9% lower offer ($956k) is reasonable based on typical stale-listing flexibility.
- 12 sale attempts since 5y ago; this cycle's ask is 56657% above the opening price — seller raised mid-cycle; expect resistance to lowballs.
- Current owner paid $95k; list at $1.05M implies a 1005% gain — meaningful room to come down on a strong offer.
Risks & watch-outs
- Watch-outs: built in 1926 — expect roof / HVAC / electrical / plumbing capex.
- Climate carrying-cost: severe wind risk, 99% chance of damaging wind over 30y; extreme-heat days projected 7→29/yr by 2055 (HVAC capex compounding) — expect insurance premiums to compound above CPI over the hold.
Questions for the listing agent
- What do current leases actually rent for vs. the listed asking? Can we see a recent rent roll and the last 12 months of T-12 income?
- It's been on market 99 days. Have you received any prior offers? Is the seller open to a 66% concession, seller financing, or rate buy-down credit?
- Built in 1926 — when were the roof, HVAC, electrical panel, plumbing, and water heater last replaced?
- Why hasn't it sold? Are there any deal-killer items the seller is aware of (foundation, flood, title, zoning, code violations)?
- Is there a deadline driving the sale (1031 exchange, divorce, estate, relocation)? That informs how much negotiation room exists.
- Schools are B-rated — typically a magnet for longer-tenancy family renters. What's the average tenant stay here, and is there a school-zone premium baked into asking?
- Crime grade is F in this area — have there been break-ins, vandalism, or insurance claims at this property in the last 3 years? What carrier currently insures it and at what premium?
- The area grade is low — what's the realistic commute time and amenity access for the typical tenant pool here? Any planned neighborhood developments (good or bad) we should know about?
- What's the average days-on-market for RENTAL listings here right now (not sales)? A rising rental-DOM trend means longer vacancies and softer asking-rent achievability than the comps imply.
- What's the recent tenant-quality profile in this submarket — average credit score on applications, eviction rate, late-payment / NSF rate, and stable-employment percentage? A property-management company in the area should have these aggregated.
- How much new apartment / multifamily construction is in the pipeline within 1–3 miles? Heavy new supply (>2% of stock underway) typically softens rents 12–24 months out; light construction supports rent growth.
Investment metrics
- 1% rule
- 0.34% ✗
- Cap rate
- 1.79%
- Cash-on-cash
- -16.08%
- DSCR
- 0.28
- GRM
- 24.5
CMA / ARV
No comps found within radius.
Projected returns pro-forma
-3.0% appreciation · 2.26% rent growth · sell at horizon
- IRR
- -48.4%
- Equity multiple
- -0.44×
- Total profit
- $-424,009
- Equity at exit
- $156,558
- IRR
- -98.1%
- Equity multiple
- -1.39×
- Total profit
- $-704,072
- Equity at exit
- $90,785
Cash invested: $294,000 (down + closing). Projections, not guarantees.
Landlord ↔ Tenant lean methodology
- Overall (STATE)
- 87 Strongly Landlord-Friendly
- State Florida
- 87 Strongly Landlord-Friendly · R+3
- County
- — inherits STATE
- City
- — inherits STATE
ZIP-level market 33127
- Home prices YoY
- -30.1%
- Rents YoY
- 2.3%
- Active inventory
- 295
- Price-to-rent
- 24.5×
Monthly cashflow live
- Estimated rent
- $3,566 medium interval (Pro) →
- Mortgage (P&I)
- −$5,506
- Tax from tax record
- −$814 /mo · $9,765/yr
- Insurance
- −$438
- HOA
- −$0
- Vacancy / Maint / Mgmt
- −$749
- Net cashflow
- $-3,941
Break-even live
UW: 25.0% down · 7.5% · 30yr · 1.5% tax · 5.0% vac · 8.0% maint · 8.0% mgmt
Financing live
Cash to close
- Down payment
- $262,500
- Closing costs
- $31,500
- Reserves months
- —
- Total cash needed
- —
Loan-product check · same deal, 3 products live
Conventional
25% down · 7.5% · 30yr
- Down + closing
- —
- Monthly P&I
- —
- Monthly cashflow
- —
- DSCR
- —
- Eligible?
- —
Personal DTI + credit; lowest rate.
DSCR
20% down · 8.5% · 30yr
- Down + closing
- —
- Monthly P&I
- —
- Monthly cashflow
- —
- DSCR
- —
- Eligible?
- —
No personal income docs; deal must DSCR.
Hard money
10% down · 12.0% · 12mo
- Down + closing
- —
- Monthly P&I
- —
- Monthly cashflow
- —
- DSCR
- —
- Eligible?
- —
Short-term bridge; refi at stabilization.
Rent comps 5 comps
| Address | Beds | Baths | Sqft | Rent | $/sqft | DOM | Units | Dist |
|---|---|---|---|---|---|---|---|---|
| 555 NE 34th St Miami, FL | 1.0–4.0 | 1.5–4.0 | 2653 | $13,753 | $5.18 | 1d | 19 | 0.94mi |
| 2900 Biscayne Blvd Miami, FL | 3.0 | 1.0–3.5 | 1260 | $18,500 | $14.68 | 1d | 13 | 1.10mi |
| 700 NE 26th Ter Unit 260 Miami, FL | 3.0 | 3.0 | 2141 | $20,000 | $9.34 | 24d | 1 | 1.35mi |
| 700 NE 26th Ter #2602 Miami, FL | 3.0 | 3.5 | 2141 | $18,000 | $8.41 | 2d | 1 | 1.35mi |
| 711 NE 23rd Ter Unit 607 Miami, FL | 4.0 | 5.5 | 2216 | $19,500 | $8.80 | 24d | 1 | 1.50mi |
Listing history 39 events
-
2026-06-18days on market $1,050,000 Active 99 DOM
-
2026-06-17days on market $1,050,000 Active 98 DOM
-
2026-06-16days on market $1,050,000 Active 97 DOM
-
2026-06-15days on market $1,050,000 Active 96 DOM
-
2026-06-13days on market $1,050,000 Active 94 DOM
-
2026-06-09days on market $1,050,000 Active 90 DOM
-
2026-06-08days on market $1,050,000 Active 89 DOM
-
2026-06-07days on market $1,050,000 Active 88 DOM
-
2026-06-04days on market $1,050,000 Active 85 DOM
-
2026-06-03days on market $1,050,000 Active 84 DOM
-
2026-06-02days on market $1,050,000 Active 83 DOM
-
2026-06-01days on market $1,050,000 Active 82 DOM
-
2026-05-31days on market $1,050,000 Active 81 DOM
-
2026-04-29$1,850
-
2026-03-26historical $1,850
-
2026-02-19$1,850
-
2026-01-01historical $8,500
-
2025-10-30historical
-
2025-10-29$1,090,000 Active
-
2025-07-14$1,095,000
-
2025-07-14historical
-
2025-05-10$8,500
-
2025-05-08$1,150,000
-
2025-05-08historical
-
2024-10-22$1,250,000
-
2024-06-30historical
-
2024-05-23historical $5,300
-
2024-03-19$5,300
-
2023-12-28$1,295,000
-
2022-08-08historical
-
2022-08-02price $4,600
-
2022-06-08historical
-
2022-05-24$895,000
-
2022-04-15$895,000
-
2022-04-15historical
-
2021-12-16$895,000
-
2003-03-14soldstatus $95,000
-
1993-01-11soldstatus $56,000
-
1992-12-01soldstatus $56,000
ⓘ Source: listings_history table (triggers on properties + properties_extension) + one-shot
backfill from property_details.listing_events for pre-trigger history.
Tax reassessment forecast FL · Resets to sale price
- Current annual tax
- $9,765 · $814/mo
- Projected year-2 tax
- $9,765 · $814/mo
- Expected delta
- $0/yr ($0/mo · 0.0%)
ⓘ Screening estimate from a state-policy table — verify with the county assessor before closing.
Climate risk First Street
- Flood 1/10 Low FEMA zone X (unshaded) · 0% chance over 30 yrs
- Wildfire 1/10 Low
- Heat 10/10 Extreme 7 d/yr ≥103°F today · 29 d/yr by 30 yrs out
- Wind 10/10 Extreme 99% chance of damaging wind over 30 yrs
- Air quality 2/10 Low 1 unhealthy d/yr today · 1 by 30 yrs out
Nearby sold comps map
Loading sold comps map…
Walkable amenities ~0.75 mi
Loading nearby amenities…
Taxation est. · year 1
- Rental income
- $42,790
- − Mortgage interest
- −$58,816
- − Property taxes
- −$9,765
- − Insurance
- −$5,250
- − Repairs & maintenance
- −$3,423
- − Management
- −$3,423
- − Depreciation
- −$30,545
- Taxable loss
- −$68,433
- Est. tax savings @ 24.0%
- +$16,424
- After-tax cash flow
- $-30,863/yr
For passive investors: Depreciation is non-cash, so a rental often shows a tax loss while cash-flowing — sheltering income. Rental losses are passive: they offset passive income freely, and up to $25,000/yr can offset ordinary (W-2) income if you actively participate and your MAGI is under $100k (phasing out to $0 by $150k); unused losses carry forward. On sale, claimed depreciation is recaptured at up to 25%, and gains may owe capital-gains tax (a 1031 exchange can defer both). Figures are a year-1 estimate at your 24.0% rate — not tax advice; consult a CPA.
Schools (NCES district)
- District
- Miami-Dade
- NCES district ID
- 1200390
- Math proficiency
- 45% ▼ -16.00%
- Reading proficiency
- 54% ▼ -5.00%
- Median HH income
- $43,928
- Composite
- 41.76/100
- National rank
- #3397
- State rank
- #40 of 73 in FL
Livability — Miami
- Score
- 78/100
- State rank
- #177
- US rank
- #2724
Category grades
Schools grade is shown separately in the Schools card above.
Census & demographics
- Census place
- Miami, FL
- County
- Miami-Dade County · 2,697,751 people
- City population
- 827,308
- Metro
- Miami-Fort Lauderdale-Pompano Beach, FL
- Population (ZIP)
- 26,786
- Household income
- $41,230
- Rent vs Own
- Severe rent burden
- 2523.0
Population outlook (Miami-Dade County) Hauer SSP2
- Today (2025)
- 3,126,439 people
- By 2030
- 3,325,765 · +6.4%
- By 2040
- 3,697,561 · +18.3%
- By 2050
- 4,012,134 · +28.3%
- By 2075
- 4,605,612 · +47.3%
- By 2100
- 4,866,598 · +55.7%
Race, ethnicity, and origin ACS 2023
- Neighborhood character
- Majority Hispanic (55%)
- Race & ethnicity
- Hispanic / Latino 55% Black 39% Two or more races 30% White 4%
- Hispanic origin (detail)
- Mexican 2% Puerto Rican 6% Cuban 9% Dominican 5%
- Common ancestry
- Hispanic 11%
- Foreign-born
- 43% · Canada, Jamaica, Dominican Republic
- Languages at home
- 34% English-only · Spanish 53% French/Haitian/Cajun 12%
Political lean MEDSL · Miami-Dade
- 2024 margin
- R (+11.4) · D 43.9% · R 55.4%
- 2008→2024 swing
- -27.6pp toward R · 2008: 16.1pp · 2024: -11.4pp
- All cycles
- 2024: R+11.4 2020: D+7.3 2016: D+29.6 2012: D+23.7 2008: D+16.1
Not yet ingested
- Civics
- —
Market trends
- HPI YoY
- ▼ -293.00%
- Current HPI
- 680.1845
- Rent YoY
- ▲ 2.26%
- Metro
- Miami-Fort Lauderdale-Pompano Beach, FL
- State GDP YoY
- ▲ 3.28%
- F500 in state
- 36
Industry mix (Fortune 500 HQ in FL)
| Industry | F500 HQs | Revenue |
|---|---|---|
| Industrial Technology | 2 | $29B |
|
||
| Insurance | 2 | $17B |
|
||
| Retail | 1 | $60B |
|
||
| Technology Distribution | 1 | $58B |
|
||
| Homebuilding | 1 | $35B |
|
||
| Technology Manufacturing | 1 | $35B |
|
||
Price history
-96.7% since first listed26 events — show timeline
- 2026-04-29 Listed for Rent $1,850 RMLSFL
- 2026-03-26 Rental Removed $1,850 GFLMLS
- 2026-02-19 Listed for Rent $1,850 GFLMLS
- 2026-01-01 Rental Removed $8,500 GFLMLS
- 2025-10-30 Listing Removed — Beaches MLS
- 2025-10-29 Listed $1,090,000 Beaches MLS
- 2025-07-14 Listing Removed — Beaches MLS
- 2025-07-14 Listed $1,095,000 Beaches MLS
- 2025-05-10 Listed for Rent $8,500 GFLMLS
- 2025-05-08 Listing Removed — Beaches MLS
- 2025-05-08 Listed $1,150,000 Beaches MLS
- 2024-10-22 Listed $1,250,000 Beaches MLS
- 2024-06-30 Listing Removed — Beaches MLS
- 2024-05-23 Rental Removed $5,300 GFLMLS
- 2024-03-19 Listed for Rent $5,300 GFLMLS
- 2023-12-28 Listed $1,295,000 Beaches MLS
- 2022-08-08 Listing Removed — Beaches MLS
- 2022-08-02 Price Changed $4,600 RENT.
- 2022-06-08 Listing Removed — Beaches MLS
- 2022-05-24 Listed $895,000 Beaches MLS
- 2022-04-15 Listing Removed — Beaches MLS
- 2022-04-15 Listed $895,000 Beaches MLS
- 2021-12-16 Listed $895,000 Beaches MLS
- 2003-03-14 Sold (Public Records) $95,000 Public Records
- 1993-01-11 Sold (Public Records) $56,000 Public Records
- 1992-12-01 Sold (Public Records) $56,000 Public Records
Property tax history
+9.2%/yrLatest (2025): $9,765 · +6.5% YoY. Source: county tax records.
Cash-flow waterfall
monthlySold comps — $/sqft
last 12 mo · ≤1 miLoading sold comps…