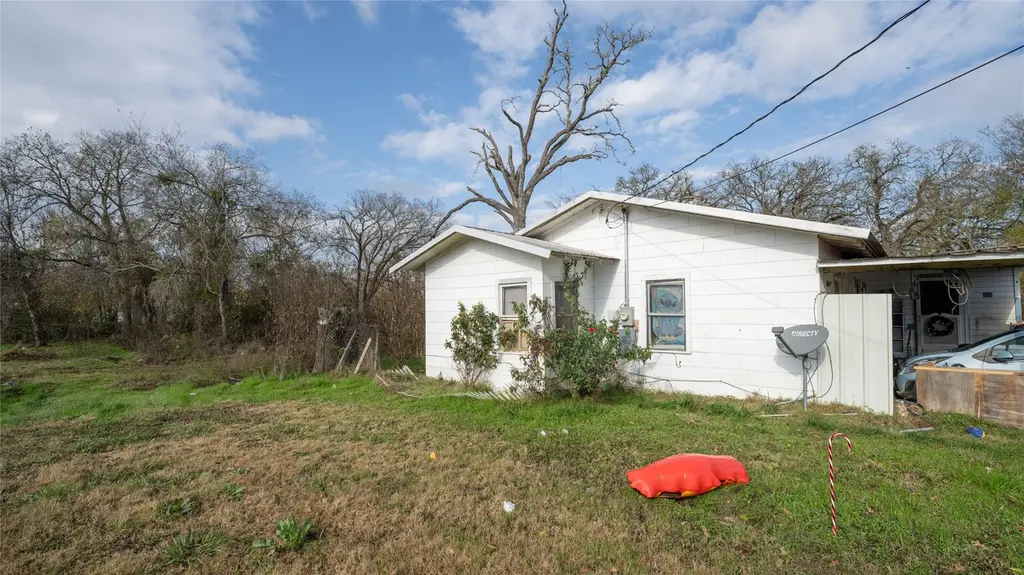
303 Yoakum St · Rockdale, TX
Flood risk No data
- FEMA flood zone
- —
- Chance of flooding over 30 yrs
- —
- Est. flood insurance / yr
- —
Fire risk No data
- Est. fire insurance / yr
- —
Heat risk No data
- Hot days now (above threshold)
- —
- Hot days in 30 yrs
- —
Wind risk No data
- Chance of severe wind over 30 yrs
- —
Air-quality risk No data
- Unhealthy air days now
- —
- Unhealthy air days in 30 yrs
- —
Risk factors via First Street. Map © Google.
Why this score? — see what drove the B- grade
The composite is a weighted blend of 9 inputs, each scored 0–100. Each bar is that input's sub-score; the figure is the points it added to the 100-point composite (weight × sub-score).
- Cash flow +30.0/30.0
- 1% rule +10.0/10.0
- DSCR +10.0/10.0
- ARV discount +7.5/15.0
- Schools +3.5/10.0
- Livability +3.0/5.0
- Rent growth +2.5/5.0
- Condition / age +1.0/5.0
- Appreciation +0.0/10.0
$85,000
🖨 Deal sheet 📄 Offer letter ✓ Due diligence
Listing remarks MLS
Calling investors and remodelers--this property is waiting for some TLV and vision to make it shine! This property is home to an 1128 sq ft home, built in 1951. It has 3 bedrooms and 1 bath with mostly original design. There is a attached carport as well. This could make for a great investment property as the property is currently being rented to tenants, so it's already income producing! This property has a massive . 68 acre lot, so there is ample room for more uses and improvements. The property has access via E Belton and Douthit St. Located under and hour from Austin, B/CS and Temple. Just minutes to the Sandow Lakes site and 30 minutes from Taylor/Samsung. Home is sold as-is.
Key facts
- Original design
- Income producing
- Massive lot
Tags
Neighborhood map
What this means for you Summary
Snapshot
- This is a 3-bed/1.0-bath single-family listed at $85k. Condition is rated poor.
Deal economics
- At list price, monthly cash flow is $429 ($5k/yr) — positive.
- The deal already cash-flows at list — no discount required.
- Meets the 1% rule at list price ($1k rent vs $85k).
- Recommended offer: $75k (12.0% below list) — sets the bar for market timing.
- Cap rate 12.3% vs local median 3.6% in Rockdale — top-decile yield for the area; either an underpriced asset or a hidden risk that comps aren't pricing in. Stress-test before assuming the spread holds.
Location & tenants
- Location reads 60/100 on livability (#1,040 in TX) — a middle-class / working-renter tenant base. Strengths: cost of living A+, housing A+; Watch: schools D, crime F, amenities F.
- Rockdale ISD (town): math 40% / reading 43% proficiency, ranked #395 of 826 in TX (top 48%) — families likely to look elsewhere, expect single-tenant / working-renter base with shorter leases; 63% free/reduced lunch — lower-income household profile, screen leases tightly.
- Market conditions: 161 active listings in the ZIP; 3 comparable units currently listed for rent nearby; rentals leasing fast (median 2d on market — plan ~1-2 weeks tenant-placement turnaround); 77 units permitted in Milam County in 2024 (0 in 5+ unit buildings).
Forward outlook
- Local home prices are declining (-3.0%/yr); year-one equity from $588 of loan paydown is wiped out by about $3k of value loss. Plan a longer hold.
- Milam County population projected to shrink 9% by 2050 — rents likely to lag national; underwrite the cash flow, not the appreciation.
- At projected returns (-3.0% appreciation + 3.0% rent growth), your $24k cash investment doubles in ~6 years — after that, you're playing with house money.
Negotiation context
- It's been on market 533 days — a 12% lower offer ($75k) is reasonable based on typical stale-listing flexibility.
- 2 sale attempts since 2y ago with the ask held roughly flat each time — persistent listings suggest the price (not the market) is what's stuck; bring a comps-based counter.
Risks & watch-outs
- Watch-outs: built in 1951 — expect roof / HVAC / electrical / plumbing capex.
Questions for the listing agent
- It's been on market 533 days. Have you received any prior offers? Is the seller open to a 12% concession, seller financing, or rate buy-down credit?
- Have any recent inspections been done? Can we get a copy of the seller's disclosures and any deferred-maintenance estimates?
- Built in 1951 — when were the roof, HVAC, electrical panel, plumbing, and water heater last replaced?
- Why hasn't it sold? Are there any deal-killer items the seller is aware of (foundation, flood, title, zoning, code violations)?
- Is there a deadline driving the sale (1031 exchange, divorce, estate, relocation)? That informs how much negotiation room exists.
- Schools are D-rated, which usually means shorter tenancies and higher turnover. Who's the typical renter profile here, and what's been the actual vacancy rate?
- Crime grade is F in this area — have there been break-ins, vandalism, or insurance claims at this property in the last 3 years? What carrier currently insures it and at what premium?
- What's the average days-on-market for RENTAL listings here right now (not sales)? A rising rental-DOM trend means longer vacancies and softer asking-rent achievability than the comps imply.
- What's the recent tenant-quality profile in this submarket — average credit score on applications, eviction rate, late-payment / NSF rate, and stable-employment percentage? A property-management company in the area should have these aggregated.
- How much new for-sale + rental construction is in the pipeline within 1–3 miles? Heavy new supply typically softens prices + rents 12–24 months out; constrained supply supports both.
Investment metrics
- 1% rule
- 1.51% ✓
- Cap rate
- 12.35%
- Cash-on-cash
- 21.62%
- DSCR
- 1.96
- GRM
- 5.5
CMA / ARV
- ARV (median comp)
- $185,577
- List price
- $85,000
- Delta
- -54.20%
- Verdict
- UNDERPRICED
- Comps
- 20 within 1.0 mi
Projected returns pro-forma
-3.0% appreciation · 3.0% rent growth · sell at horizon
- IRR
- 14.2%
- Equity multiple
- 1.57×
- Total profit
- $13,562
- Equity at exit
- $12,674
- IRR
- 23.0%
- Equity multiple
- 2.98×
- Total profit
- $47,063
- Equity at exit
- $7,349
Cash invested: $23,800 (down + closing). Projections, not guarantees.
Landlord ↔ Tenant lean methodology
- Overall (STATE)
- 87 Strongly Landlord-Friendly
- State Texas
- 87 Strongly Landlord-Friendly · R+5
- County
- — inherits STATE
- City
- — inherits STATE
ZIP-level market 76567
- Home prices YoY
- -12.9%
- Active inventory
- 161
- Price-to-rent
- 5.5×
Monthly cashflow live
- Estimated rent
- $1,286 medium interval (Pro) →
- Mortgage (P&I)
- −$446
- Tax est. 1.5%
- −$106 /mo · $1,275/yr
- Insurance
- −$35
- HOA
- −$0
- Vacancy / Maint / Mgmt
- −$270
- Net cashflow
- $429
Break-even live
UW: 25.0% down · 7.5% · 30yr · 1.5% tax · 5.0% vac · 8.0% maint · 8.0% mgmt
Financing live
Cash to close
- Down payment
- $21,250
- Closing costs
- $2,550
- Reserves months
- —
- Total cash needed
- —
Loan-product check · same deal, 3 products live
Conventional
25% down · 7.5% · 30yr
- Down + closing
- —
- Monthly P&I
- —
- Monthly cashflow
- —
- DSCR
- —
- Eligible?
- —
Personal DTI + credit; lowest rate.
DSCR
20% down · 8.5% · 30yr
- Down + closing
- —
- Monthly P&I
- —
- Monthly cashflow
- —
- DSCR
- —
- Eligible?
- —
No personal income docs; deal must DSCR.
Hard money
10% down · 12.0% · 12mo
- Down + closing
- —
- Monthly P&I
- —
- Monthly cashflow
- —
- DSCR
- —
- Eligible?
- —
Short-term bridge; refi at stabilization.
Rent comps 3 comps
| Address | Beds | Baths | Sqft | Rent | $/sqft | DOM | Units | Dist |
|---|---|---|---|---|---|---|---|---|
| 1116 E Cameron Ave Rockdale, TX | 2.0 | 1.0 | 872 | $1,275 | $1.46 | 1d | 1 | 0.11mi |
| 622 Scarbrough St Rockdale, TX | 2.0 | 1.0 | 904 | $1,050 | $1.16 | 1d | 1 | 0.96mi |
| 823 Hickory St Rockdale, TX | 3.0 | 2.0 | 1244 | $1,650 | $1.33 | 43d | 1 | 1.19mi |
Listing history 17 events
-
2026-06-18days on market $85,000 Active 533 DOM
-
2026-06-17days on market $85,000 Active 532 DOM
-
2026-06-16days on market $85,000 Active 531 DOM
-
2026-06-15days on market $85,000 Active 530 DOM
-
2026-06-15days on market $85,000 Active 529 DOM
-
2026-06-13days on market $85,000 Active 528 DOM
-
2026-06-12days on market $85,000 Active 527 DOM
-
2026-06-09days on market $85,000 Active 524 DOM
-
2026-06-08days on market $85,000 Active 523 DOM
-
2026-06-08days on market $85,000 Active 522 DOM
-
2026-06-07days on market $85,000 Active 521 DOM
-
2026-06-03days on market $85,000 Active 518 DOM
-
2026-06-02days on market $85,000 Active 517 DOM
-
2026-06-01days on market $85,000 Active 516 DOM
-
2026-05-31days on market $85,000 Active 515 DOM
-
2026-02-02status Active 692-char remark
Show marketing remark (692 chars)
Calling investors and remodelers--this property is waiting for some TLV and vision to make it shine! This property is home to an 1128 sq ft home, built in 1951. It has 3 bedrooms and 1 bath with mostly original design. There is a attached carport as well. This could make for a great investment property as the property is currently being rented to tenants, so it's already income producing! This property has a massive . 68 acre lot, so there is ample room for more uses and improvements. The property has access via E Belton and Douthit St. Located under and hour from Austin, B/CS and Temple. Just minutes to the Sandow Lakes site and 30 minutes from Taylor/Samsung. Home is sold as-is.
-
2024-12-30$85,000 Active 692-char remark
Show marketing remark (692 chars)
Calling investors and remodelers--this property is waiting for some TLV and vision to make it shine! This property is home to an 1128 sq ft home, built in 1951. It has 3 bedrooms and 1 bath with mostly original design. There is a attached carport as well. This could make for a great investment property as the property is currently being rented to tenants, so it's already income producing! This property has a massive . 68 acre lot, so there is ample room for more uses and improvements. The property has access via E Belton and Douthit St. Located under and hour from Austin, B/CS and Temple. Just minutes to the Sandow Lakes site and 30 minutes from Taylor/Samsung. Home is sold as-is.
ⓘ Source: listings_history table (triggers on properties + properties_extension) + one-shot
backfill from property_details.listing_events for pre-trigger history.
Nearby sold comps map
Loading sold comps map…
Walkable amenities ~0.75 mi
Loading nearby amenities…
Taxation est. · year 1
- Rental income
- $15,438
- − Mortgage interest
- −$4,761
- − Property taxes
- −$1,275
- − Insurance
- −$425
- − Repairs & maintenance
- −$1,235
- − Management
- −$1,235
- − Depreciation
- −$2,473
- Taxable income
- $4,034
- Est. tax owed @ 24.0%
- −$968
- After-tax cash flow
- $4,179/yr
For passive investors: Depreciation is non-cash, so a rental often shows a tax loss while cash-flowing — sheltering income. Rental losses are passive: they offset passive income freely, and up to $25,000/yr can offset ordinary (W-2) income if you actively participate and your MAGI is under $100k (phasing out to $0 by $150k); unused losses carry forward. On sale, claimed depreciation is recaptured at up to 25%, and gains may owe capital-gains tax (a 1031 exchange can defer both). Figures are a year-1 estimate at your 24.0% rate — not tax advice; consult a CPA.
Condition & rehab AI · 12 photos
This property requires extensive repairs and maintenance, including painting, landscaping, and flooring replacement. It has potential for significant value increase with proper renovations.
Repairs flagged
- Major Kitchen flooring — Severe wear and tear.
- Major Bathroom flooring — Severe wear and tear.
- Major Painting — Painted walls appear old and in need of fresh paint.
- Major Landscaping — Overgrown vegetation and debris in the yard and around the house.
Value-add opportunities
- Both Painting and repainting — Fresh paint can improve the home's appearance and value.
- Both Landscaping and yard maintenance — A well-maintained yard can improve curb appeal and property value.
- Both Kitchen and bathroom flooring replacement — New flooring can significantly improve the home's appearance and functionality.
- Rental HVAC system inspection and maintenance — A functional HVAC system is essential for tenant satisfaction and can improve rental value.
- Both General cleaning and organization — A clean and organized home can improve the overall impression and value of the property.
Renovation cost estimate screening
| Repair item | Severity | Est. cost |
|---|---|---|
| Kitchen flooring · Severe wear and tear. | Major | $15,000–50,000 |
| Bathroom flooring · Severe wear and tear. | Major | $15,000–50,000 |
| Painting · Painted walls appear old and in need of fresh paint. | Major | $15,000–50,000 |
| Landscaping · Overgrown vegetation and debris in the yard and around the house. | Major | $15,000–50,000 |
| Total estimated repair cost · 4 items | $60,000–200,000 |
Value-add ROI direction
- Both Painting and repainting — Fresh paint can improve the home's appearance and value. ↑
- Both Landscaping and yard maintenance — A well-maintained yard can improve curb appeal and property value. ↑
- Both Kitchen and bathroom flooring replacement — New flooring can significantly improve the home's appearance and functionality. ↑
- Rental HVAC system inspection and maintenance — A functional HVAC system is essential for tenant satisfaction and can improve rental value. ↑
- Both General cleaning and organization — A clean and organized home can improve the overall impression and value of the property. ↑
ⓘ Cost ranges are severity-bucket heuristics (US national rule-of-thumb). Get contractor quotes + a written scope before underwriting a rehab budget.
Schools (NCES district)
- District
- Rockdale ISD
- NCES district ID
- 4837590
- Math proficiency
- 40% ▼ -1.00%
- Reading proficiency
- 43% ▬ 0.00%
- Median HH income
- $38,586
- Composite
- 34.64/100
- National rank
- #5147
- State rank
- #395 of 826 in TX
Livability — Rockdale
- Score
- 60/100
- State rank
- #1040
- US rank
- #18508
Category grades
Schools grade is shown separately in the Schools card above.
Census & demographics
- Census place
- Rockdale, TX
- Population (ZIP)
- 8,457
Population outlook (Milam County) Hauer SSP2
- Today (2025)
- 24,051 people
- By 2030
- 23,613 · -1.8%
- By 2040
- 22,693 · -5.6%
- By 2050
- 21,879 · -9.0%
- By 2075
- 20,974 · -12.8%
- By 2100
- 19,414 · -19.3%
Race, ethnicity, and origin ACS 2023
- Neighborhood character
- Majority White (63%)
- Race & ethnicity
- White 63% Hispanic / Latino 30% Two or more races 11% Black 5%
- Hispanic origin (detail)
- Mexican 25% Puerto Rican 2%
- Common ancestry
- Slovak 2% Lithuanian 2% Serbian 1%
- Foreign-born
- 11% · Canada, Jamaica
- Languages at home
- 78% English-only · Spanish 21% Korean 1%
Political lean MEDSL · Milam
- 2024 margin
- Solid R (+57.3) · D 21.0% · R 78.3%
- 2008→2024 swing
- -31.3pp toward R · 2008: -26.0pp · 2024: -57.3pp
- All cycles
- 2024: R+57.3 2020: R+51.9 2016: R+49.9 2012: R+34.6 2008: R+26.0
Not yet ingested
- Civics
- —
Market trends
- HPI YoY
- ▼ -32.12%
- Current HPI
- 217.5536
- Rent YoY
- —
- Metro
- —
- State GDP YoY
- ▲ 3.95%
- F500 in state
- 110
Industry mix (Fortune 500 HQ in TX)
| Industry | F500 HQs | Revenue |
|---|---|---|
| Energy | 16 | $1,198B |
|
||
| Technology | 5 | $198B |
|
||
| Engineering / Construction | 4 | $72B |
|
||
| Energy Services | 3 | $60B |
|
||
| Utilities | 3 | $41B |
|
||
| Healthcare | 2 | $330B |
|
||
Price history
2 events — show timeline
- 2026-02-02 Relisted — Unlock MLS
- 2024-12-30 Listed $85,000 Unlock MLS
Cash-flow waterfall
monthlySold comps — $/sqft
last 12 mo · ≤1 miLoading sold comps…