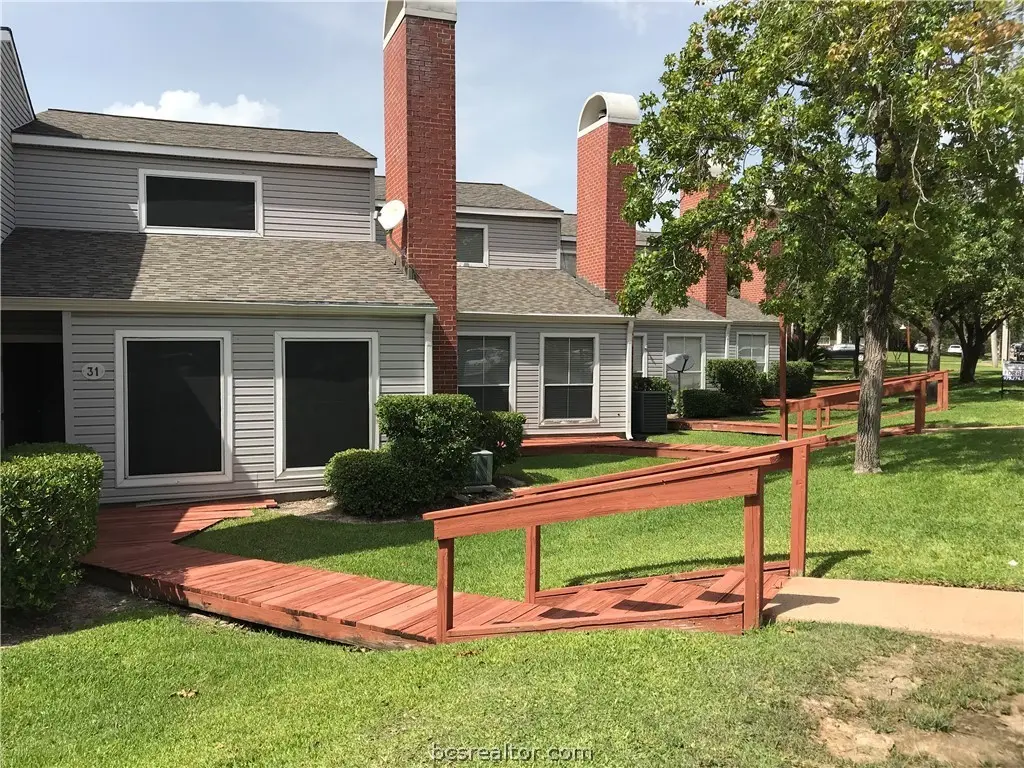
1500 Olympia Way #31 · College Station, TX
Flood risk No data
- FEMA flood zone
- —
- Chance of flooding over 30 yrs
- —
- Est. flood insurance / yr
- —
Fire risk No data
- Est. fire insurance / yr
- —
Heat risk No data
- Hot days now (above threshold)
- —
- Hot days in 30 yrs
- —
Wind risk No data
- Chance of severe wind over 30 yrs
- —
Air-quality risk No data
- Unhealthy air days now
- —
- Unhealthy air days in 30 yrs
- —
Risk factors via First Street. Map © Google.
Why this score? — see what drove the D grade
The composite is a weighted blend of 9 inputs, each scored 0–100. Each bar is that input's sub-score; the figure is the points it added to the 100-point composite (weight × sub-score).
- ARV discount +14.8/15.0
- 1% rule +6.1/10.0
- Cash flow +4.9/30.0
- Schools +4.7/10.0
- Livability +4.2/5.0
- Rent growth +4.1/5.0
- Condition / age +2.5/5.0
- DSCR +0.0/10.0
- Appreciation +0.0/10.0
$123,000
🖨 Deal sheet (PDF) 📄 Offer letter ✓ Due diligence
Listing remarks
Beautiful and cozy move-In Ready condo in the desirable Sutter’s Mill community, just steps from a TAMU bus stop! This well-maintained 2-bedroom, 1.5-bathroom condo thoughtfully designed floor plan offers a warm and inviting atmosphere, featuring a cozy fireplace and spacious living area. Soaring vaulted ceilings enhance the sense of openness, while durable vinyl flooring flows throughout the downstairs living spaces, excluding the kitchen and half bath, which are finished with easy-to-clean tile. The kitchen features warm wooden cabinets and opens seamlessly to the dining and living areas, making it ideal for both daily living and entertaining. Upstairs, you'll find two generously si
Key facts
- Spacious living area
- Cozy fireplace
- Easy to clean tile
Tags
Property features AI
Finance
- HOA & community: HOA provides grounds maintenance; Monthly association fee (approximately $457.71) covering insurance and structure maintenance
Exterior
- Parking: Attached carport; 2 covered parking spaces; 2-car garage
- Security: Smoke detectors
- Utilities: Public water; Public sewer; Electricity available; Sewer available; Water available
- Home design: Residential condominium; Two levels; Slab foundation
- Construction: HardiPlank and vinyl siding
- Exterior features: No fencing; Composition roof; Lot about 0.075 acres; Subdivision: Sutters Mill; Directions: Texas Ave to Harvey Rd, Lt on Stallings Dr, Rt on University Oaks Blvd, Lt on Olympia Way. The first building after turning onto Olympia Way.
Interior
- Flooring: Laminate flooring; Tile flooring
- Bathrooms: 1 full bathroom; 1 half bathroom
- Heating & cooling: Central heating (electric); Central air conditioning (electric); Ceiling fan cooling
- Interior features: Ceiling fans; Window treatments; Fireplace (other type)
Neighborhood map
What this means for you Summary
Snapshot
- This is a 2-bed/1.0-bath single-family listed at $123k.
Deal economics
- At list price, monthly cash flow is $-296 ($-4k/yr) — negative.
- To cash-flow at today's rent, offer at most $71k (42.5% below list).
- Meets the 1% rule at list price ($1k rent vs $123k).
- Recommended offer: $71k (42.5% below list) — sets the bar for cash-flow.
Location & tenants
- Location reads 83/100 on livability (#11 in TX, #994 nationally) — a professional / high-income tenant draw. Strengths: amenities A+, commute A+, crime A-; Watch: employment C-.
- College Station ISD (urban): math 58% / reading 54% proficiency, ranked #113 of 826 in TX (top 14%) — acceptable for families but not a draw, mixed tenant base, ~2y average lease.
- Zoned schools: College Hills El (math 33% / reading 32%, grade F, #2,234 of 4,322 statewide, top 52%, 596 students, 75% FRL); Oakwood Int (math 55% / reading 47%, grade C, #326 of 1,662 statewide, top 20%, 719 students, 48% FRL); A & M Cons H S (math 65% / reading 66%, grade B, #193 of 1,632 statewide, top 12%, 2,139 students, 32% FRL) — zoned schools average 52% FRL vs 24% district-wide (27 pts higher); higher-poverty schools than district average — tighter screening recommended.
- Market conditions: Rents rising fast (+6.2%/yr); 307 active listings in the ZIP; 37 comparable units currently listed for rent nearby; rentals at typical pace (median 23d on market — plan ~3-4 weeks tenant-placement turnaround); lower-income renter base — watch delinquency; 2,211 units permitted in Brazos County in 2024 (768 in 5+ unit buildings).
- At $1,366/mo this rent would consume 54% of the median local household income ($30k/yr) (locally 8224% of renters already pay >50% of income on rent) — very limited rent-growth headroom before tenants either downsize or default.
Forward outlook
- Local home prices are declining (-3.0%/yr); year-one equity from $850 of loan paydown is wiped out by about $4k of value loss. Plan a longer hold.
- Brazos County population projected at +55% by 2050 — long-run rental-demand tailwind backs the buy-and-hold thesis.
Negotiation context
- It's been on market 19 days — a 2% lower offer ($121k) is reasonable based on typical stale-listing flexibility.
- 3 sale attempts with the ask held roughly flat each time — persistent listings suggest the price (not the market) is what's stuck; bring a comps-based counter.
Risks & watch-outs
- Watch-outs: HOA is 33% of rent.
Questions for the listing agent
- What do current leases actually rent for vs. the listed asking? Can we see a recent rent roll and the last 12 months of T-12 income?
- What does the HOA fee cover, when was the last increase, and are there any pending special assessments or reserve-fund shortfalls?
- Is there a deadline driving the sale (1031 exchange, divorce, estate, relocation)? That informs how much negotiation room exists.
- Schools are B-rated — typically a magnet for longer-tenancy family renters. What's the average tenant stay here, and is there a school-zone premium baked into asking?
- The area grade is low — what's the realistic commute time and amenity access for the typical tenant pool here? Any planned neighborhood developments (good or bad) we should know about?
- What's the average days-on-market for RENTAL listings here right now (not sales)? A rising rental-DOM trend means longer vacancies and softer asking-rent achievability than the comps imply.
- What's the recent tenant-quality profile in this submarket — average credit score on applications, eviction rate, late-payment / NSF rate, and stable-employment percentage? A property-management company in the area should have these aggregated.
- How much new for-sale + rental construction is in the pipeline within 1–3 miles? Heavy new supply typically softens prices + rents 12–24 months out; constrained supply supports both.
Investment metrics
- 1% rule
- 1.11% ✓
- Cap rate
- 3.40%
- Cash-on-cash
- -10.32%
- DSCR
- 0.54
- GRM
- 7.5
CMA / ARV
- ARV (median comp)
- $146,714
- List price
- $123,000
- Delta
- -16.16%
- Verdict
- UNDERPRICED
- Comps
- 20 within 1.0 mi
Show comp detail 1 sale within ~0.75 mi
| Address | Dist | Beds/Ba | Sqft | Sold | Price | $/sf | Match |
|---|---|---|---|---|---|---|---|
| 1004 Milner | 0.69mi | 2/1.0 | 1,248 (+12%) | 8mo | $299,000 | $240 | 40 |
Match score weights: distance 35% · size 25% · config 20% · recency 20%. Top-matched comps best support the ARV.
Projected returns pro-forma
-3.0% appreciation · 6.24% rent growth · sell at horizon
- IRR
- -28.1%
- Equity multiple
- 0.02×
- Total profit
- $-33,858
- Equity at exit
- $18,340
- IRR
- -12.9%
- Equity multiple
- 0.06×
- Total profit
- $-32,211
- Equity at exit
- $10,635
Cash invested: $34,440 (down + closing). Projections, not guarantees.
Landlord ↔ Tenant lean methodology
- Overall (STATE)
- 87 Strongly Landlord-Friendly
- State Texas
- 87 Strongly Landlord-Friendly · R+5
- County
- — inherits STATE
- City
- — inherits STATE
ZIP-level market 77840
- Rents YoY
- 6.2%
- Active inventory
- 307
- Price-to-rent
- 7.5×
Monthly cashflow live
- Estimated rent
- $1,366 high interval (Pro) →
- Mortgage (P&I)
- −$645
- Tax from tax record
- −$222 /mo · $2,670/yr
- Insurance
- −$51
- HOA
- −$457
- Vacancy / Maint / Mgmt
- −$287
- Net cashflow
- $-296
Break-even live
Sensitivity live
| Price | -10% $-227 | -5% $-261 | +0% $-296 | +5% $-331 | +10% $-366 |
|---|---|---|---|---|---|
| Rent | -10% $-404 | -5% $-350 | +0% $-296 | +5% $-242 | +10% $-188 |
| Rate | -1.0pp $-234 | -0.5pp $-265 | base $-296 | +0.5pp $-328 | +1.0pp $-361 |
UW: 25.0% down · 7.5% · 30yr · 1.5% tax · 5.0% vac · 8.0% maint · 8.0% mgmt
Financing live
Cash to close
- Down payment
- $30,750
- Closing costs
- $3,690
- Reserves months
- —
- Total cash needed
- —
Loan-product check · same deal, 3 products live
Conventional
25% down · 7.5% · 30yr
- Down + closing
- —
- Monthly P&I
- —
- Monthly cashflow
- —
- DSCR
- —
- Eligible?
- —
Personal DTI + credit; lowest rate.
DSCR
20% down · 8.5% · 30yr
- Down + closing
- —
- Monthly P&I
- —
- Monthly cashflow
- —
- DSCR
- —
- Eligible?
- —
No personal income docs; deal must DSCR.
Hard money
10% down · 12.0% · 12mo
- Down + closing
- —
- Monthly P&I
- —
- Monthly cashflow
- —
- DSCR
- —
- Eligible?
- —
Short-term bridge; refi at stabilization.
Rent comps 37 comps
| Address | Beds | Baths | Sqft | Rent | $/sqft | DOM | Units | Dist |
|---|---|---|---|---|---|---|---|---|
| 904 University Oaks Blvd College Station, TX | 1.0–2.0 | 1.0–2.0 | 792 | $1,200 | $1.51 | 45d | 2 | 0.17mi |
| 904 University Oaks Blvd College Station, TX | 1.0–2.0 | 1.0–2.0 | 792 | $1,200 | $1.51 | 23d | 2 | 0.17mi |
| 1900 Dartmouth St College Station, TX | 2.0 | 1.0–1.5 | 1040 | $1,250 | $1.20 | 15d | 1 | 0.30mi |
| 1902 Dartmouth St College Station, TX | 2.0 | 1.5 | 1024 | $1,200 | $1.17 | 23d | 1 | 0.30mi |
| 1903 Dartmouth St College Station, TX | 1.0–2.0 | 1.0 | 870 | $1,250 | $1.44 | 45d | 1 | 0.39mi |
| 1201 Harvey Rd College Station, TX | 1.0–3.0 | 1.0–2.0 | 802 | $1,068 | $1.33 | 15d | 133 | 0.46mi |
| 1915 Dartmouth St College Station, TX | 1.0–2.0 | 1.0–2.5 | 903 | $1,495 | $1.66 | 23d | 30 | 0.54mi |
| 300 Holleman Dr E Unit 1104 College Station, TX | 2.0 | 2.0 | 947 | $1,250 | $1.32 | 45d | 1 | 0.57mi |
| 300 Holleman Dr E Unit 1203 College Station, TX | 2.0 | 2.5 | 1090 | $1,300 | $1.19 | 45d | 1 | 0.57mi |
| 213 Holleman Dr E Unit 105 College Station, TX | 2.0 | 2.0 | 1000 | $1,525 | $1.52 | 45d | 1 | 0.62mi |
| 309 Redmond Dr College Station, TX | 1.0–2.0 | 1.0–1.5 | 638 | $995 | $1.56 | 15d | 9 | 0.71mi |
| 116 Richards St College Station, TX | 2.0 | 1.0 | 1198 | $1,995 | $1.67 | 15d | 1 | 0.76mi |
| 709 Vassar Ct Apt C College Station, TX | 2.0 | 2.0 | 950 | $1,500 | $1.58 | 45d | 1 | 0.78mi |
| 818 Nimitz St College Station, TX | 3.0 | 2.0 | 1133 | $1,395 | $1.23 | 45d | 1 | 0.87mi |
| 2330 Autumn Chase Loop Unit B College Station, TX | 3.0 | 3.0 | 1364 | $1,650 | $1.21 | 23d | 1 | 0.88mi |
| 1601 Holleman Dr College Station, TX | 1.0–3.0 | 1.0–2.0 | 888 | $1,288 | $1.45 | 45d | 5 | 0.91mi |
| 1505 Park Pl Apt 24 College Station, TX | 2.0 | 1.0 | 865 | $950 | $1.10 | 45d | 1 | 0.93mi |
| 615 Pasler St College Station, TX | 3.0 | 1.5 | 1061 | $1,600 | $1.51 | 15d | 1 | 0.95mi |
| 901 Camellia Ct Unit B College Station, TX | 3.0 | 2.0 | 1100 | $1,275 | $1.16 | 15d | 1 | 0.95mi |
| 2400 Central Park Ln College Station, TX | 1.0–2.0 | 1.0–2.0 | 755 | $1,095 | $1.45 | 15d | 10 | 0.97mi |
| 810 Camellia Ct Unit 1328089P College Station, TX | 3.0 | 2.0 | 1302 | $4,917 | $3.78 | 23d | 1 | 0.97mi |
| 1104 Autumn Cir Apt D College Station, TX | 2.0 | 2.0 | 963 | $1,000 | $1.04 | 45d | 1 | 1.14mi |
| 1524 Pine Ridge Dr College Station, TX | 2.0 | 1.0 | 789 | $950 | $1.20 | 45d | 1 | 1.14mi |
| 402 Summer Ct Unit 2B College Station, TX | 2.0 | 2.0 | 750 | $900 | $1.20 | 45d | 1 | 1.16mi |
| 1402 Holleman Dr College Station, TX | 1.0–2.0 | 1.0 | 700 | $795 | $1.14 | 23d | 13 | 1.21mi |
| 1601 Anderson St College Station, TX | 2.0 | 1.0 | 796 | $938 | $1.18 | 23d | 5 | 1.23mi |
| 801 Spring Loop College Station, TX | 1.0–2.0 | 1.0–2.0 | 921 | $1,240 | $1.35 | 15d | 23 | 1.25mi |
| 205 Winter Park Unit D College Station, TX | 2.0 | 2.0 | 980 | $1,500 | $1.53 | 15d | 1 | 1.28mi |
| 1001 Krenek Tap Rd College Station, TX | 3.0–4.0 | 3.0–4.0 | 1572 | $600 | $0.38 | 45d | 2 | 1.29mi |
| 1200 Village Dr College Station, TX | 3.0 | 2.0 | 1443 | $1,750 | $1.21 | 23d | 1 | 1.29mi |
| 1200 Village Dr College Station, TX | 3.0 | 2.0 | 1443 | $1,750 | $1.21 | 15d | 1 | 1.29mi |
| 533 Forest Drive Loop College Station, TX | 3.0 | 3.5 | 1456 | $1,675 | $1.15 | 15d | 1 | 1.30mi |
| 1613 Southwest Pkwy College Station, TX | 2.0 | 1.0 | 798 | $1,150 | $1.44 | 15d | 1 | 1.32mi |
| 512 Camp Ct Unit 1328090P College Station, TX | 3.0 | 2.0 | 1388 | $3,624 | $2.61 | 15d | 1 | 1.34mi |
| 101 Winter Park Unit A College Station, TX | 3.0 | 3.0 | 1347 | $2,250 | $1.67 | 15d | 1 | 1.36mi |
| 1600 Southwest Pkwy College Station, TX | 1.0–3.0 | 1.0–2.5 | 1005 | $1,150 | $1.14 | 15d | 21 | 1.42mi |
| 1302 Laura Ln College Station, TX | 3.0 | 2.0 | 1460 | $1,825 | $1.25 | 23d | 1 | 1.45mi |
HOA detail
- Monthly dues
- $457 · $5,484/yr
Listing history 12 events
-
2026-05-05price $123,000 1126-char remark
-
2026-05-05price $127,000 1126-char remark
-
2026-04-30$129,000 Active 1126-char remark
-
2026-04-16price $132,560
-
2026-01-28$137,560 Active
-
2025-09-04price $132,000
-
2025-06-28price $135,000
-
2025-06-10price $139,000
-
2025-06-03price $145,000
-
2025-04-04$149,500 Active
-
2015-09-08soldstatus
-
2005-04-04soldstatus
ⓘ Source: listings_history table (triggers on properties + properties_extension) + one-shot
backfill from property_details.listing_events for pre-trigger history.
Tax reassessment forecast TX · Resets to sale price
- Current annual tax
- $2,670 · $222/mo
- Projected year-2 tax
- $2,670 · $222/mo
- Expected delta
- $0/yr ($0/mo · 0.0%)
ⓘ Screening estimate from a state-policy table — verify with the county assessor before closing.
Nearby sold comps map
Loading sold comps map…
Walkable amenities ~0.75 mi
Loading nearby amenities…
Taxation est. · year 1
- Rental income
- $16,397
- − Mortgage interest
- −$6,890
- − Property taxes
- −$2,670
- − Insurance
- −$615
- − Repairs & maintenance
- −$1,312
- − Management
- −$1,312
- − HOA
- −$5,484
- − Depreciation
- −$3,578
- Taxable loss
- −$5,463
- Est. tax savings @ 24.0%
- +$1,311
- After-tax cash flow
- $-2,244/yr
For passive investors: Depreciation is non-cash, so a rental often shows a tax loss while cash-flowing — sheltering income. Rental losses are passive: they offset passive income freely, and up to $25,000/yr can offset ordinary (W-2) income if you actively participate and your MAGI is under $100k (phasing out to $0 by $150k); unused losses carry forward. On sale, claimed depreciation is recaptured at up to 25%, and gains may owe capital-gains tax (a 1031 exchange can defer both). Figures are a year-1 estimate at your 24.0% rate — not tax advice; consult a CPA.
Schools (NCES district)
- District
- College Station ISD
- NCES district ID
- 4807350
- Math proficiency
- 58% ▼ -4.00%
- Reading proficiency
- 54% ▼ -2.00%
- Median HH income
- $36,991
- Composite
- 46.54/100
- National rank
- #2428
- State rank
- #113 of 826 in TX
Livability — College Station
- Score
- 83/100
- State rank
- #11
- US rank
- #994
Category grades
Schools grade is shown separately in the Schools card above.
Census & demographics
- Census place
- College Station, TX
- County
- Brazos County · 233,400 people
- City population
- 131,628
- Metro
- College Station-Bryan, TX
- Population (ZIP)
- 54,864
- Household income
- $30,377
- Rent vs Own
- Severe rent burden
- 8224.0
Population outlook (Brazos County) Hauer SSP2
- Today (2025)
- 267,942 people
- By 2030
- 296,630 · +10.7%
- By 2040
- 354,560 · +32.3%
- By 2050
- 414,616 · +54.7%
- By 2075
- 562,158 · +109.8%
- By 2100
- 678,828 · +153.3%
Race, ethnicity, and origin ACS 2023
- Neighborhood character
- Diverse neighborhood (Simpson 0.63)
- Race & ethnicity
- White 55% Hispanic / Latino 20% Two or more races 11% Black 11% Asian 9%
- Hispanic origin (detail)
- Mexican 13%
- Common ancestry
- Romanian 2% Lithuanian 2% Italian 2%
- Foreign-born
- 14% · Canada, China, South Korea
- Languages at home
- 77% English-only · Spanish 12% Other Indo-European 3% Chinese 2%
Political lean MEDSL · Brazos
- 2024 margin
- Strong R (+24.9) · D 36.9% · R 61.7% · Other 1.4%
- 2008→2024 swing
- +4.1pp toward D · 2008: -28.9pp · 2024: -24.9pp
- All cycles
- 2024: R+24.9 2020: R+14.3 2016: R+23.7 2012: R+35.3 2008: R+28.9
Not yet ingested
- Civics
- —
Market trends
- HPI YoY
- ▼ -155.15%
- Current HPI
- 195.2885
- Rent YoY
- ▲ 6.24%
- Metro
- College Station-Bryan, TX
- State GDP YoY
- ▲ 3.95%
- F500 in state
- 110
Industry mix (Fortune 500 HQ in TX)
| Industry | F500 HQs | Revenue |
|---|---|---|
| Energy | 16 | $1,198B |
|
||
| Technology | 5 | $198B |
|
||
| Engineering / Construction | 4 | $72B |
|
||
| Energy Services | 3 | $60B |
|
||
| Utilities | 3 | $41B |
|
||
| Healthcare | 2 | $330B |
|
||
Price history
-17.7% since first listed13 events — show timeline
- 2026-05-19 Pending — BCSRMLS
- 2026-05-05 Price Changed $123,000 BCSRMLS
- 2026-05-05 Price Changed $127,000 BCSRMLS
- 2026-04-30 Listed $129,000 BCSRMLS
- 2026-04-16 Price Changed $132,560 BCSRMLS
- 2026-01-28 Listed $137,560 BCSRMLS
- 2025-09-04 Price Changed $132,000 BCSRMLS
- 2025-06-28 Price Changed $135,000 BCSRMLS
- 2025-06-10 Price Changed $139,000 BCSRMLS
- 2025-06-03 Price Changed $145,000 BCSRMLS
- 2025-04-04 Listed $149,500 BCSRMLS
- 2015-09-08 Sold (Public Records) — Public Records
- 2005-04-04 Sold (Public Records) — Public Records
Property tax history
+3.5%/yrLatest (2025): $2,670 · +8.8% YoY. Source: county tax records.
Cash-flow waterfall
monthlySold comps — $/sqft
last 12 mo · ≤1 miLoading sold comps…