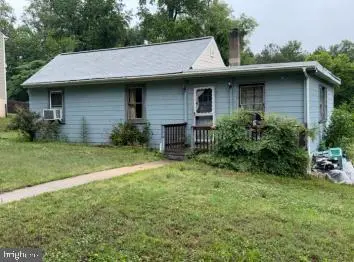
10231 Brightwood Ave · Bellwood, VA
Flood risk 1/10 · Minimal
- FEMA flood zone
- X (unshaded)
- Chance of flooding over 30 yrs
- 0.0%
- Est. flood insurance / yr
- $473 – $860
Fire risk 3/10 · Minor
- Est. fire insurance / yr
- $666 – $1,236
Heat risk 7/10 · Major
- Hot days now (above 107°F)
- 7 days/yr
- Hot days in 30 yrs
- 16 days/yr
Wind risk 6/10 · Moderate
- Chance of severe wind over 30 yrs
- 27.0%
Air-quality risk 2/10 · Minimal
- Unhealthy air days now
- 1 days/yr
- Unhealthy air days in 30 yrs
- 1 days/yr
Risk factors via First Street. Map © Google.
Why this score? — see what drove the C- grade
The composite is a weighted blend of 9 inputs, each scored 0–100. Each bar is that input's sub-score; the figure is the points it added to the 100-point composite (weight × sub-score).
- ARV discount +15.0/15.0
- Cash flow +13.8/30.0
- Schools +5.2/10.0
- DSCR +4.2/10.0
- Rent growth +3.6/5.0
- 1% rule +3.3/10.0
- Livability +3.1/5.0
- Condition / age +2.5/5.0
- Appreciation +0.0/10.0
$187,750
🖨 Deal sheet (PDF) 📄 Offer letter ✓ Due diligence
Key facts
- 3.02 acre lot
- Built 1940
- Listed 19 days
Property features AI
Exterior
- Parking: On-street parking
- Utilities: Public water; Public sewer; Electric service
- Home design: Detached property
- Construction: Vinyl and wood siding; Shingle roof; Slab foundation; Year built reported by assessor
- Exterior features: Subdivision possible; Water-oriented property on a creek; Above-grade and below-grade structures noted
Interior
- Bedrooms: Two bedrooms on the main level
- Bathrooms: One full bathroom; One half bathroom
- Heating & cooling: Hot water and electric baseboard heating; Electric hot water
- Interior features: No basement; Finished living area reported by assessor
Neighborhood map
What this means for you Summary
Snapshot
- This is a 2-bed/1.0-bath single-family listed at $188k.
Deal economics
- At list price, monthly cash flow is $18 ($216/yr) — positive.
- The deal already cash-flows at list — no discount required.
- To meet the 1% rule (rent ≥ 1% of price), the offer needs to be $156k (17.2% below list).
- Recommended offer: $156k (17.2% below list) — sets the bar for 1% rule.
Location & tenants
- Location reads 61/100 on livability (#426 in VA) — a middle-class / working-renter tenant base. Strengths: cost of living A+, housing A+; Watch: amenities F, commute F, employment D-.
- Chesterfield County Public School District (suburban): math 52% / reading 64% proficiency, ranked #57 of 131 in VA (top 44%) — acceptable for families but not a draw, mixed tenant base, ~2y average lease.
- Zoned schools: Bellwood Elementary (math 30% / reading 33%, grade F, #1,002 of 1,108 statewide, top 91%, 467 students, 82% FRL); Salem Church Middle (math 34% / reading 44%, grade F, #309 of 342 statewide, top 91%, 910 students, 80% FRL); Lloyd C. Bird High (math 40% / reading 73%, grade C, #270 of 319 statewide, top 86%, 2,031 students, 79% FRL) — zoned schools average 80% FRL vs 26% district-wide (54 pts higher); higher-poverty schools than district average — tighter screening recommended.
- Zoned-school proficiency averages 42% at this address vs 58% district-wide (-16 pts) — the specific schools serving this property underperform the Chesterfield County Public School District average; the district grade overstates school quality for this exact location.
- Market conditions: Rents rising fast (+4.5%/yr); 177 active listings in the ZIP; 6 comparable units currently listed for rent nearby; rentals lingering (median 46d on market — plan ~5-8 weeks vacancy on turnover, expect pricing pressure); 67% of comp listings sitting > 30 days — soft ceiling on asking rent; 2,307 units permitted in Chesterfield County in 2024 (462 in 5+ unit buildings).
- This rent runs 37% of the median local income ($50k/yr) — at the standard rent-burdened threshold; future hikes will face affordability resistance.
Forward outlook
- Local home prices are declining (-3.0%/yr); year-one equity from $1k of loan paydown is wiped out by about $6k of value loss. Plan a longer hold.
- Chesterfield County population projected at +20% by 2050 — long-run rental-demand tailwind backs the buy-and-hold thesis.
Negotiation context
- It's been on market 19 days — a 2% lower offer ($185k) is reasonable based on typical stale-listing flexibility.
Risks & watch-outs
- Watch-outs: built in 1940 — expect roof / HVAC / electrical / plumbing capex.
- Climate carrying-cost: major wind risk, 27% chance of damaging wind over 30y; extreme-heat days projected 7→16/yr by 2055 (HVAC capex compounding) — expect insurance premiums to compound above CPI over the hold.
Questions for the listing agent
- Built in 1940 — when were the roof, HVAC, electrical panel, plumbing, and water heater last replaced?
- Is there a deadline driving the sale (1031 exchange, divorce, estate, relocation)? That informs how much negotiation room exists.
- What's the average days-on-market for RENTAL listings here right now (not sales)? A rising rental-DOM trend means longer vacancies and softer asking-rent achievability than the comps imply.
- What's the recent tenant-quality profile in this submarket — average credit score on applications, eviction rate, late-payment / NSF rate, and stable-employment percentage? A property-management company in the area should have these aggregated.
- How much new for-sale + rental construction is in the pipeline within 1–3 miles? Heavy new supply typically softens prices + rents 12–24 months out; constrained supply supports both.
Investment metrics
- 1% rule
- 0.83% ✗
- Cap rate
- 6.41%
- Cash-on-cash
- 0.41%
- DSCR
- 1.02
- GRM
- 10.1
CMA / ARV
- ARV (on-the-fly)
- $303,774
- Comps found
- 12
Show comp detail 12 sales within ~0.75 mi
| Address | Dist | Beds/Ba | Sqft | Sold | Price | $/sf | Match |
|---|---|---|---|---|---|---|---|
| 9925 Reymet Ct | 0.46mi | 3/2.0 (+1) | 1,232 (+4%) | 1mo | $307,000 | $249 | 61 |
| 10807 Stilton Dr | 0.59mi | 3/2.0 (+1) | 1,200 (+2%) | 3mo | $308,000 | $257 | 59 |
| 3012 Kenova Dr | 0.49mi | 3/1.0 (+1) | 1,292 (+9%) | 1mo | $277,500 | $215 | 56 |
| 3001 Kenova Dr | 0.45mi | 3/1.0 (+1) | 1,040 (-12%) | 7mo | $231,000 | $222 | 48 |
| 2942 Gaffney Rd | 0.56mi | 3/1.0 (+1) | 1,040 (-12%) | 3mo | $277,000 | $266 | 46 |
| 9825 Proctors Rd | 0.51mi | 3/1.0 (+1) | 1,040 (-12%) | 9mo | $273,000 | $263 | 44 |
| 9709 Kerwin Rd | 0.54mi | 3/1.0 (+1) | 1,336 (+13%) | 8mo | $255,000 | $191 | 42 |
| 3029 Gaffney Rd | 0.62mi | 3/1.0 (+1) | 1,014 (-14%) | 3mo | $270,000 | $266 | 40 |
| 2721 Perlock Rd | 0.55mi | 3/1.0 (+1) | 1,032 (-13%) | 11mo | $280,000 | $271 | 39 |
| 9812 Ashwood Rd | 0.66mi | 3/1.5 (+1) | 1,040 (-12%) | 10mo | $267,000 | $257 | 34 |
| 10900 Timonium Dr | 0.75mi | 3/2.0 (+1) | 1,348 (+14%) | 9mo | $315,000 | $234 | 25 |
| 10911 Rufford Rd | 0.67mi | 3/2.5 (+1) | 1,348 (+14%) | 13mo | $346,001 | $257 | 23 |
Match score weights: distance 35% · size 25% · config 20% · recency 20%. Top-matched comps best support the ARV.
Projected returns pro-forma
-3.0% appreciation · 4.55% rent growth · sell at horizon
- IRR
- -14.1%
- Equity multiple
- 0.49×
- Total profit
- $-26,843
- Equity at exit
- $27,994
- IRR
- -3.1%
- Equity multiple
- 0.78×
- Total profit
- $-11,588
- Equity at exit
- $16,233
Cash invested: $52,570 (down + closing). Projections, not guarantees.
Landlord ↔ Tenant lean methodology
- Overall (STATE)
- 55 Moderately Landlord-Leaning
- State Virginia
- 55 Moderately Landlord-Leaning · D+2
- County
- — inherits STATE
- City
- — inherits STATE
ZIP-level market 23224
- Rents YoY
- 4.5%
- Active inventory
- 177
- Price-to-rent
- 10.1×
Monthly cashflow live
- Estimated rent
- $1,555 high interval (Pro) →
- Mortgage (P&I)
- −$985
- Tax from tax record
- −$148 /mo · $1,773/yr
- Insurance
- −$78
- HOA
- −$0
- Vacancy / Maint / Mgmt
- −$327
- Net cashflow
- $18
Break-even live
Sensitivity live
| Price | -10% $124 | -5% $71 | +0% $18 | +5% $-35 | +10% $-88 |
|---|---|---|---|---|---|
| Rent | -10% $-105 | -5% $-43 | +0% $18 | +5% $79 | +10% $141 |
| Rate | -1.0pp $113 | -0.5pp $66 | base $18 | +0.5pp $-31 | +1.0pp $-80 |
UW: 25.0% down · 7.5% · 30yr · 1.5% tax · 5.0% vac · 8.0% maint · 8.0% mgmt
Financing live
Cash to close
- Down payment
- $46,938
- Closing costs
- $5,632
- Reserves months
- —
- Total cash needed
- —
Loan-product check · same deal, 3 products live
Conventional
25% down · 7.5% · 30yr
- Down + closing
- —
- Monthly P&I
- —
- Monthly cashflow
- —
- DSCR
- —
- Eligible?
- —
Personal DTI + credit; lowest rate.
DSCR
20% down · 8.5% · 30yr
- Down + closing
- —
- Monthly P&I
- —
- Monthly cashflow
- —
- DSCR
- —
- Eligible?
- —
No personal income docs; deal must DSCR.
Hard money
10% down · 12.0% · 12mo
- Down + closing
- —
- Monthly P&I
- —
- Monthly cashflow
- —
- DSCR
- —
- Eligible?
- —
Short-term bridge; refi at stabilization.
Rent comps 6 comps
| Address | Beds | Baths | Sqft | Rent | $/sqft | DOM | Units | Dist |
|---|---|---|---|---|---|---|---|---|
| 10250 Colony Village Way Richmond, VA | 2.0 | 2.0 | 949 | $1,655 | $1.74 | 4d | 7 | 0.19mi |
| 9934 Friend Ave North Chesterfield, VA | 3.0 | 2.0 | 1224 | $1,980 | $1.62 | 45d | 1 | 0.42mi |
| 11200 Route 1 North Chesterfield, VA | 1.0 | 1.0 | 800 | $995 | $1.24 | 45d | 1 | 0.76mi |
| 11200 U.S. 1 Unit 20 North Chesterfield, VA | 1.0 | 1.0 | 800 | $800 | $1.00 | 45d | 1 | 0.76mi |
| 11424 Elokomin Ave Chester, VA | 2.0–3.0 | 1.0–2.0 | 1074 | $1,139 | $1.06 | 25d | 7 | 1.03mi |
| 2716 Goyne Loop Chester, VA | 2.0 | 1.5 | 1280 | $1,850 | $1.45 | 45d | 1 | 1.42mi |
Listing history 12 events
-
2026-06-21days on market $187,750 Active 19 DOM
-
2026-06-18days on market $187,750 Active 16 DOM
-
2026-06-17days on market $187,750 Active 15 DOM
-
2026-06-16days on market $187,750 Active 14 DOM
-
2026-06-15days on market $187,750 Active 13 DOM
-
2026-06-13days on market $187,750 Active 11 DOM
-
2026-06-13days on market $187,750 Active 10 DOM
-
2026-06-09days on market $187,750 Active 7 DOM
-
2026-06-08days on market $187,750 Active 6 DOM
-
2026-06-07days on market $187,750 Active 5 DOM
-
2026-06-05days on market $187,750 Active 2 DOM
-
2026-06-02$187,750 Active 1 DOM
ⓘ Source: listings_history table (triggers on properties + properties_extension) + one-shot
backfill from property_details.listing_events for pre-trigger history.
Tax reassessment forecast VA · Resets to sale price
- Current annual tax
- $1,773 · $148/mo
- Projected year-2 tax
- $1,773 · $148/mo
- Expected delta
- $0/yr ($0/mo · -0.0%)
ⓘ Screening estimate from a state-policy table — verify with the county assessor before closing.
Climate risk First Street
- Flood 1/10 Low FEMA zone X (unshaded) · 0% chance over 30 yrs
- Wildfire 3/10 Moderate
- Heat 7/10 Severe 7 d/yr ≥107°F today · 16 d/yr by 30 yrs out
- Wind 6/10 Major 27% chance of damaging wind over 30 yrs
- Air quality 2/10 Low 1 unhealthy d/yr today · 1 by 30 yrs out
Nearby sold comps map
Loading sold comps map…
Walkable amenities ~0.75 mi
Loading nearby amenities…
Taxation est. · year 1
- Rental income
- $18,662
- − Mortgage interest
- −$10,517
- − Property taxes
- −$1,773
- − Insurance
- −$939
- − Repairs & maintenance
- −$1,493
- − Management
- −$1,493
- − Depreciation
- −$5,462
- Taxable loss
- −$3,014
- Est. tax savings @ 24.0%
- +$723
- After-tax cash flow
- $940/yr
For passive investors: Depreciation is non-cash, so a rental often shows a tax loss while cash-flowing — sheltering income. Rental losses are passive: they offset passive income freely, and up to $25,000/yr can offset ordinary (W-2) income if you actively participate and your MAGI is under $100k (phasing out to $0 by $150k); unused losses carry forward. On sale, claimed depreciation is recaptured at up to 25%, and gains may owe capital-gains tax (a 1031 exchange can defer both). Figures are a year-1 estimate at your 24.0% rate — not tax advice; consult a CPA.
Schools (NCES district)
- District
- Chesterfield County Public School District
- NCES district ID
- 5100840
- Math proficiency
- 52% ▼ -30.00%
- Reading proficiency
- 64% ▼ -15.00%
- Median HH income
- $72,821
- Composite
- 51.56/100
- National rank
- #1712
- State rank
- #57 of 131 in VA
Livability — Bellwood
- Score
- 61/100
- State rank
- #426
- US rank
- #18187
Category grades
Schools grade is shown separately in the Schools card above.
Census & demographics
- Census place
- Bellwood, VA
- County
- Richmond City · 178,280 people
- Metro
- Richmond, VA
- Population (ZIP)
- 40,575
- Household income
- $50,475
- Rent vs Own
- Severe rent burden
- 3584.0
Population outlook (Chesterfield County) Hauer SSP2
- Today (2025)
- 377,190 people
- By 2030
- 395,710 · +4.9%
- By 2040
- 427,694 · +13.4%
- By 2050
- 452,706 · +20.0%
- By 2075
- 505,533 · +34.0%
- By 2100
- 521,282 · +38.2%
Race, ethnicity, and origin ACS 2023
- Neighborhood character
- Diverse neighborhood (Simpson 0.58)
- Race & ethnicity
- Black 59% Hispanic / Latino 22% White 15% Two or more races 6%
- Hispanic origin (detail)
- Mexican 5% Puerto Rican 2%
- Common ancestry
- Romanian 1% Lithuanian 1% Serbian 1%
- Foreign-born
- 17% · Canada
- Languages at home
- 78% English-only · Spanish 19% French/Haitian/Cajun 1%
Political lean MEDSL · Chesterfield
- 2024 margin
- Lean D (+9.0) · D 53.8% · R 44.8% · Other 1.4%
- 2008→2024 swing
- +16.4pp toward D · 2008: -7.5pp · 2024: 9.0pp
- All cycles
- 2024: D+9.0 2020: D+6.7 2016: R+2.2 2012: R+7.1 2008: R+7.5
Not yet ingested
- Civics
- —
Market trends
- HPI YoY
- ▼ -283.99%
- Current HPI
- 336.9345
- Rent YoY
- ▲ 4.55%
- Metro
- Richmond, VA
- State GDP YoY
- ▲ 2.40%
- F500 in state
- 50
Industry mix (Fortune 500 HQ in VA)
| Industry | F500 HQs | Revenue |
|---|---|---|
| Aerospace / Defense | 4 | $236B |
|
||
| Technology / Defense | 3 | $32B |
|
||
| Financial Services | 2 | $176B |
|
||
| Utilities | 2 | $27B |
|
||
| Insurance | 2 | $25B |
|
||
| Technology | 2 | $15B |
|
||
Price history
1 event — show timeline
- 2026-06-02 Listed $187,750 BRIGHT MLS
Property tax history
+5.1%/yrLatest (2025): $1,773 · +7.1% YoY. Source: county tax records.
Cash-flow waterfall
monthlySold comps — $/sqft
last 12 mo · ≤1 miLoading sold comps…