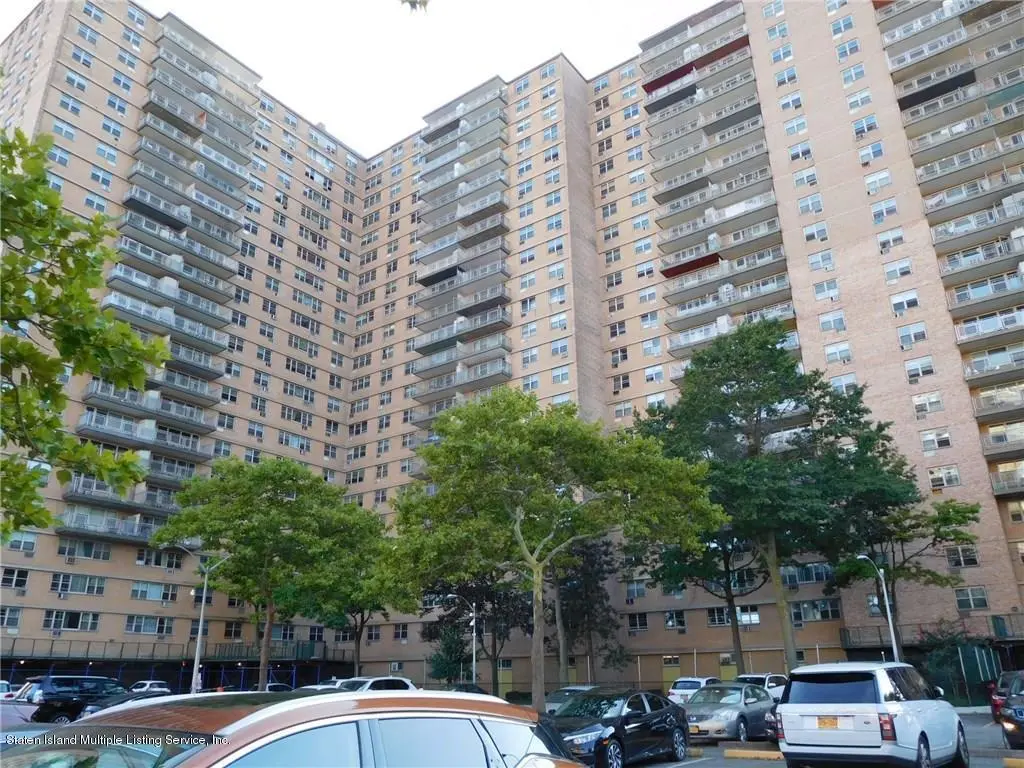
448 Neptune Ave Unit 16h · New York, NY
Flood risk 6/10 · Moderate
- FEMA flood zone
- AE
- Chance of flooding over 30 yrs
- 0.57%
- Est. flood insurance / yr
- $1,737 – $8,500
Fire risk 1/10 · Minimal
- Est. fire insurance / yr
- $691 – $1,283
Heat risk 7/10 · Major
- Hot days now (above 97°F)
- 7 days/yr
- Hot days in 30 yrs
- 15 days/yr
Wind risk 6/10 · Moderate
- Chance of severe wind over 30 yrs
- 72.0%
Air-quality risk 4/10 · Minor
- Unhealthy air days now
- 5 days/yr
- Unhealthy air days in 30 yrs
- 7 days/yr
Risk factors via First Street. Map © Google.
Why this score? — see what drove the D+ grade
The composite is a weighted blend of 9 inputs, each scored 0–100. Each bar is that input's sub-score; the figure is the points it added to the 100-point composite (weight × sub-score).
- ARV discount +15.0/15.0
- Appreciation +7.5/10.0
- Cash flow +5.9/30.0
- Schools +5.0/10.0
- 1% rule +4.6/10.0
- Rent growth +4.3/5.0
- Livability +3.8/5.0
- Condition / age +2.2/5.0
- DSCR +0.3/10.0
$398,888
🖨 Deal sheet (PDF) 📄 Offer letter ✓ Due diligence
Listing remarks
2 BEDROOM CO-OP IN TRUMP VILLAGE- INCLUDES 2 BEDROOMS, LIVING ROOM, DINING ROOM, KITCHEN, FULL BATHROOM, GENEROUS CLOSETS. CO-OP HAS LAUNDRY AREA, GYM, STORAGE AND PLAYGROUND. PETS OK. MAINTENANCE INCLUDES GAS, HEAT, ELECTRIC, WAITING LIST ON PARKING. INCLUDES WATER, REFRIGERATOR, STOVE, AC UNIT, BALCONY WITH WATER VIEWS PROXIMITY TO THE BEACH, SUBWAY, SHOPPING AND CONEY ISLAND ATTRACTIONS.
Key facts
- Storage
- Laundry area
- City views
Tags
Property features AI
Finance
- Other: Zoning: R6
- HOA & community: Has association (AKAM ASSOC); Pets allowed; Playground; Association fees collected monthly; Association covers snow removal and outside maintenance
Exterior
- Parking: On-street parking
- Utilities: 220-volt electric; Sewer service included in association; Water service included in association; Gas included in association; Electric included in association
- Home design: Condominium; 23-story building; Facing information not provided; Approximate year built
- Construction: Brick construction; Fair condition
- Exterior features: Balcony
Interior
- Kitchen: Microwave; Refrigerator
- Bathrooms: 1 full bathroom
- Heating & cooling: Steam heating; Electric heating; Cooling present (wall unit)
- Interior features: Walk-in closet(s); Wall unit air conditioning
Neighborhood map
What this means for you Summary
Snapshot
- This is a 2-bed/1.0-bath single-family listed at $399k. Condition is rated fair.
Deal economics
- At list price, monthly cash flow is $-1k ($-14k/yr) — negative.
- To cash-flow at today's rent, offer at most $225k (43.6% below list).
- To meet the 1% rule (rent ≥ 1% of price), the offer needs to be $384k (3.8% below list).
- Recommended offer: $225k (43.6% below list) — sets the bar for cash-flow.
- Cap rate 4.0% vs local median 2.6% in New York — top-decile yield for the area; either an underpriced asset or a hidden risk that comps aren't pricing in. Stress-test before assuming the spread holds.
Location & tenants
- Location reads 75/100 on livability (#268 in NY, #4,188 nationally) — a middle-class / working-renter tenant base. Strengths: amenities A+, commute A+, health & safety A; Watch: crime F, cost of living F.
- Zoned schools: Elm Tree Elementary School (math 27% / reading 52%, grade F, #1,444 of 2,108 statewide, top 71%, 806 students, 94% FRL); Is 98 Bay Academy (math 96% / reading 96%, grade A+, #2 of 729 statewide, top 0%, 1,488 students, 63% FRL); Midwood High School (math 94% / reading 96%, grade A+, #83 of 1,100 statewide, top 8%, 4,062 students, 73% FRL).
- Market conditions: Rents rising fast (+7.0%/yr); 114 active listings in the ZIP; 11 comparable units currently listed for rent nearby; rentals at typical pace (median 27d on market — plan ~3-4 weeks tenant-placement turnaround); lower-income renter base — watch delinquency; 10,063 units permitted in Kings County in 2024 (9,789 in 5+ unit buildings).
- At $3,837/mo this rent would consume 105% of the median local household income ($44k/yr) (locally 4426% of renters already pay >50% of income on rent) — very limited rent-growth headroom before tenants either downsize or default.
Forward outlook
- In year one you build about $23k of equity ($3k loan paydown + $20k appreciation (5.0% local appreciation)).
- Kings County population projected at +13% by 2050 — modest demand growth; plan on rents tracking national, not racing it.
- By year 2, paydown + projected appreciation supports a ~$36k cash-out refi (75% LTV) — recoverable capital for the next deal without selling this one.
Negotiation context
- It's been on market 17 days — a 2% lower offer ($393k) is reasonable based on typical stale-listing flexibility.
Risks & watch-outs
- Watch-outs: flood insurance adds $427/mo; HOA is 27% of rent.
- Climate carrying-cost: in FEMA flood zone AE (mandatory federal flood insurance); major wind risk, 72% chance of damaging wind over 30y; extreme-heat days projected 7→15/yr by 2055 (HVAC capex compounding) — expect insurance premiums to compound above CPI over the hold.
Questions for the listing agent
- What do current leases actually rent for vs. the listed asking? Can we see a recent rent roll and the last 12 months of T-12 income?
- Have any recent inspections been done? Can we get a copy of the seller's disclosures and any deferred-maintenance estimates?
- Built in 1964 — when were the roof, HVAC, electrical panel, plumbing, and water heater last replaced?
- What's the actual annual flood-insurance premium (NFIP or private), and is the property in a SFHA with mandatory coverage?
- What does the HOA fee cover, when was the last increase, and are there any pending special assessments or reserve-fund shortfalls?
- Is there a deadline driving the sale (1031 exchange, divorce, estate, relocation)? That informs how much negotiation room exists.
- Schools are B-rated — typically a magnet for longer-tenancy family renters. What's the average tenant stay here, and is there a school-zone premium baked into asking?
- Crime grade is F in this area — have there been break-ins, vandalism, or insurance claims at this property in the last 3 years? What carrier currently insures it and at what premium?
- The area grade is low — what's the realistic commute time and amenity access for the typical tenant pool here? Any planned neighborhood developments (good or bad) we should know about?
- What's the average days-on-market for RENTAL listings here right now (not sales)? A rising rental-DOM trend means longer vacancies and softer asking-rent achievability than the comps imply.
- What's the recent tenant-quality profile in this submarket — average credit score on applications, eviction rate, late-payment / NSF rate, and stable-employment percentage? A property-management company in the area should have these aggregated.
- How much new for-sale + rental construction is in the pipeline within 1–3 miles? Heavy new supply typically softens prices + rents 12–24 months out; constrained supply supports both.
Investment metrics
- 1% rule
- 0.96% ✗
- Cap rate
- 3.96%
- Cash-on-cash
- -8.33%
- DSCR
- 0.63
- GRM
- 8.7
CMA / ARV
- ARV (on-the-fly)
- $547,200
- Comps found
- 3
Show comp detail 3 sales within ~0.75 mi
| Address | Dist | Beds/Ba | Sqft | Sold | Price | $/sf | Match |
|---|---|---|---|---|---|---|---|
| 38 Brighton 1st Walk | 0.22mi | 3/1.0 (+1) | 1,015 (+7%) | 11mo | $550,000 | $542 | 64 |
| 526 Avenue Z Unit 2f | 0.51mi | 2/2.0 | 1,021 (+8%) | 6mo | $588,000 | $576 | 55 |
| 3042 Brighton 8 St | 0.49mi | 3/1.5 (+1) | 1,062 (+12%) | 18mo | $790,000 | $744 | 35 |
Match score weights: distance 35% · size 25% · config 20% · recency 20%. Top-matched comps best support the ARV.
Projected returns pro-forma
4.98% appreciation · 7.03% rent growth · sell at horizon
- IRR
- 4.3%
- Equity multiple
- 1.29×
- Total profit
- $32,117
- Equity at exit
- $225,609
- IRR
- 9.1%
- Equity multiple
- 2.82×
- Total profit
- $202,751
- Equity at exit
- $389,010
Cash invested: $111,689 (down + closing). Projections, not guarantees.
Landlord ↔ Tenant lean methodology
- Overall (CITY)
- 0 Strongly Tenant-Friendly
- State New York
- 15 Strongly Tenant-Friendly · D+10
- County
- — inherits STATE
- City New York
- 0 Strongly Tenant-Friendly · D+34
ZIP-level market 11224
- Home prices YoY
- 1.0%
- Rents YoY
- 7.0%
- Active inventory
- 114
- Price-to-rent
- 8.7×
Monthly cashflow live
- Estimated rent
- $3,837 high interval (Pro) →
- Mortgage (P&I)
- −$2,092
- Tax est. 1.5%
- −$499 /mo · $5,983/yr
- Insurance
- −$166
- Flood insurance flood zone
- −$427 /mo · $5,118/yr
- HOA
- −$1,050
- Vacancy / Maint / Mgmt
- −$806
- Net cashflow
- $-1,202
Break-even live
Sensitivity live
| Price | -10% $-926 | -5% $-1,064 | +0% $-1,202 | +5% $-1,340 | +10% $-1,478 |
|---|---|---|---|---|---|
| Rent | -10% $-1,505 | -5% $-1,354 | +0% $-1,202 | +5% $-1,051 | +10% $-899 |
| Rate | -1.0pp $-1,001 | -0.5pp $-1,101 | base $-1,202 | +0.5pp $-1,305 | +1.0pp $-1,411 |
UW: 25.0% down · 7.5% · 30yr · 1.5% tax · 5.0% vac · 8.0% maint · 8.0% mgmt
Financing live
Cash to close
- Down payment
- $99,722
- Closing costs
- $11,967
- Reserves months
- —
- Total cash needed
- —
Loan-product check · same deal, 3 products live
Conventional
25% down · 7.5% · 30yr
- Down + closing
- —
- Monthly P&I
- —
- Monthly cashflow
- —
- DSCR
- —
- Eligible?
- —
Personal DTI + credit; lowest rate.
DSCR
20% down · 8.5% · 30yr
- Down + closing
- —
- Monthly P&I
- —
- Monthly cashflow
- —
- DSCR
- —
- Eligible?
- —
No personal income docs; deal must DSCR.
Hard money
10% down · 12.0% · 12mo
- Down + closing
- —
- Monthly P&I
- —
- Monthly cashflow
- —
- DSCR
- —
- Eligible?
- —
Short-term bridge; refi at stabilization.
Rent comps 11 comps
| Address | Beds | Baths | Sqft | Rent | $/sqft | DOM | Units | Dist |
|---|---|---|---|---|---|---|---|---|
| 532 Neptune Ave Brooklyn, NY | 1.0–3.0 | 1.0–2.0 | 948 | $4,550 | $4.80 | 1d | 8 | 0.23mi |
| 2971 Shell Rd Unit 720 Brooklyn, NY | 2.0 | 2.0 | 920 | $4,100 | $4.46 | 26d | 1 | 0.31mi |
| 2971 Shell Rd Unit 704 Brooklyn, NY | 2.0 | 1.0 | 826 | $3,950 | $4.78 | 26d | 1 | 0.31mi |
| 2971 Shell Rd Unit 711 Brooklyn, NY | 2.0 | 2.0 | 907 | $4,200 | $4.63 | 26d | 1 | 0.31mi |
| 2971 Shell Rd Unit 612 Brooklyn, NY | 2.0 | 2.0 | 907 | $4,150 | $4.58 | 26d | 1 | 0.31mi |
| 2971 Shell Rd Unit 508 Brooklyn, NY | 2.0 | 2.0 | 930 | $4,099 | $4.41 | 26d | 1 | 0.31mi |
| 2971 Shell Rd Unit 406 Brooklyn, NY | 2.0 | 2.0 | 920 | $3,550 | $3.86 | 26d | 1 | 0.31mi |
| 2538 E 2nd St Unit 2 Brooklyn, NY | 3.0 | 1.0 | 1100 | $2,600 | $2.36 | 26d | 1 | 0.60mi |
| 1515 Surf Ave Brooklyn, NY | 1.0–2.0 | 1.0 | 706 | $5,195 | $7.35 | 0d | 16 | 0.71mi |
| 2483 W 16th St Brooklyn, NY | 1.0 | 1.0 | 800 | $1,800 | $2.25 | 22d | 1 | 0.93mi |
| 8642 26th Ave Unit 3 Brooklyn, NY | 3.0 | 1.0 | 1100 | $3,100 | $2.82 | 17d | 1 | 1.44mi |
HOA detail
- Monthly dues
- $1,050 · $12,600/yr
- Likely covers
- watergaselectricgym
Listing history 11 events
-
2026-06-21pricedays on market $398,888 Active 17 DOM
-
2026-06-18days on market $328,888 Active 14 DOM
-
2026-06-17days on market $328,888 Active 13 DOM
-
2026-06-16days on market $328,888 Active 12 DOM
-
2026-06-15days on market $328,888 Active 11 DOM
-
2026-06-13days on market $328,888 Active 9 DOM
-
2026-06-09days on market $328,888 Active 5 DOM
-
2026-06-08remarks 394-char remark
-
2026-06-08days on market $328,888 Active 4 DOM
-
2026-06-07remarks 387-char remark
-
2026-06-07$328,888 Active 3 DOM
ⓘ Source: listings_history table (triggers on properties + properties_extension) + one-shot
backfill from property_details.listing_events for pre-trigger history.
Climate risk First Street
- Flood 6/10 Major FEMA zone AE · 57% chance over 30 yrs
- Wildfire 1/10 Low
- Heat 7/10 Severe 7 d/yr ≥97°F today · 15 d/yr by 30 yrs out
- Wind 6/10 Major 72% chance of damaging wind over 30 yrs
- Air quality 4/10 Moderate 5 unhealthy d/yr today · 7 by 30 yrs out
Nearby sold comps map
Loading sold comps map…
Walkable amenities ~0.75 mi
Loading nearby amenities…
Taxation est. · year 1
- Rental income
- $46,041
- − Mortgage interest
- −$22,344
- − Property taxes
- −$5,983
- − Insurance
- −$7,113
- − Repairs & maintenance
- −$3,683
- − Management
- −$3,683
- − HOA
- −$12,600
- − Depreciation
- −$11,604
- Taxable loss
- −$20,970
- Est. tax savings @ 24.0%
- +$5,033
- After-tax cash flow
- $-9,393/yr
For passive investors: Depreciation is non-cash, so a rental often shows a tax loss while cash-flowing — sheltering income. Rental losses are passive: they offset passive income freely, and up to $25,000/yr can offset ordinary (W-2) income if you actively participate and your MAGI is under $100k (phasing out to $0 by $150k); unused losses carry forward. On sale, claimed depreciation is recaptured at up to 25%, and gains may owe capital-gains tax (a 1031 exchange can defer both). Figures are a year-1 estimate at your 24.0% rate — not tax advice; consult a CPA.
Condition & rehab AI · 5 photos
This multi-story apartment complex has a fair condition with cosmetic updates needed. The interior is in good condition, and the exterior and landscaping are well-maintained. Enhancing the landscaping and inspecting the roof could significantly increase its value.
Repairs flagged
- Major roof inspection — The satellite image shows a flat roof, which may require inspection for any potential issues.
- Minor landscaping maintenance — The trees and shrubs appear healthy, but regular trimming and maintenance should be considered.
Value-add opportunities
- Both landscaping improvements — Enhancing the landscaping can improve curb appeal and attract potential buyers or renters.
- Both roof inspection and repair — A thorough inspection of the roof may reveal any necessary repairs and could prevent future costly issues.
Renovation cost estimate screening
| Repair item | Severity | Est. cost |
|---|---|---|
| roof inspection · The satellite image shows a flat roof, which may require inspection for any potential issues. | Major | $15,000–50,000 |
| landscaping maintenance · The trees and shrubs appear healthy, but regular trimming and maintenance should be considered. | Minor | $500–3,000 |
| Total estimated repair cost · 2 items | $15,500–53,000 |
Value-add ROI direction
- Both landscaping improvements — Enhancing the landscaping can improve curb appeal and attract potential buyers or renters. ↑
- Both roof inspection and repair — A thorough inspection of the roof may reveal any necessary repairs and could prevent future costly issues. ↑
ⓘ Cost ranges are severity-bucket heuristics (US national rule-of-thumb). Get contractor quotes + a written scope before underwriting a rehab budget.
Schools (NCES district)
No district data.
Livability — New York
- Score
- 75/100
- State rank
- #268
- US rank
- #4188
Category grades
Schools grade is shown separately in the Schools card above.
Census & demographics
- Census place
- New York, NY
- County
- Kings County · 2,614,986 people
- City population
- 7,731,280
- Metro
- New York-Newark-Jersey City, NY-NJ-PA
- Population (ZIP)
- 50,822
- Household income
- $43,648
- Rent vs Own
- Severe rent burden
- 4426.0
Population outlook (Kings County) Hauer SSP2
- Today (2025)
- 2,847,441 people
- By 2030
- 2,937,006 · +3.1%
- By 2040
- 3,095,491 · +8.7%
- By 2050
- 3,228,968 · +13.4%
- By 2075
- 3,321,723 · +16.7%
- By 2100
- 3,111,387 · +9.3%
Race, ethnicity, and origin ACS 2023
- Neighborhood character
- Diverse neighborhood (Simpson 0.68)
- Race & ethnicity
- White 48% Black 22% Hispanic / Latino 19% Asian 8% Two or more races 7%
- Hispanic origin (detail)
- Mexican 5% Puerto Rican 8% Dominican 2%
- Common ancestry
- Scotch-Irish 10% Subsaharan African 7% Romanian 1%
- Foreign-born
- 48% · Canada, China
- Languages at home
- 42% English-only · Russian/Polish/Slavic 32% Spanish 11% Chinese 5%
Political lean MEDSL · Kings
- 2024 margin
- Solid D (+44.0) · D 72.0% · R 28.0%
- 2008→2024 swing
- -15.5pp toward R · 2008: 59.4pp · 2024: 44.0pp
- All cycles
- 2024: D+44.0 2020: D+54.8 2016: D+61.8 2012: D+63.9 2008: D+59.4
Not yet ingested
- Civics
- —
Market trends
- HPI YoY
- ▲ 4.98%
- Current HPI
- 505.1405
- Rent YoY
- ▲ 7.03%
- Metro
- New York-Newark-Jersey City, NY-NJ-PA
- State GDP YoY
- ▲ 2.60%
- F500 in state
- 92
Industry mix (Fortune 500 HQ in NY)
| Industry | F500 HQs | Revenue |
|---|---|---|
| Financial Services | 10 | $950B |
|
||
| Consumer Goods | 9 | $162B |
|
||
| Insurance | 4 | $225B |
|
||
| Telecommunications | 2 | $144B |
|
||
| Pharmaceuticals | 2 | $112B |
|
||
| Media / Entertainment | 2 | $69B |
|
||
Price history
1 event — show timeline
- 2026-06-04 Listed $328,888 SIBORMLS
Cash-flow waterfall
monthlySold comps — $/sqft
last 12 mo · ≤1 miLoading sold comps…