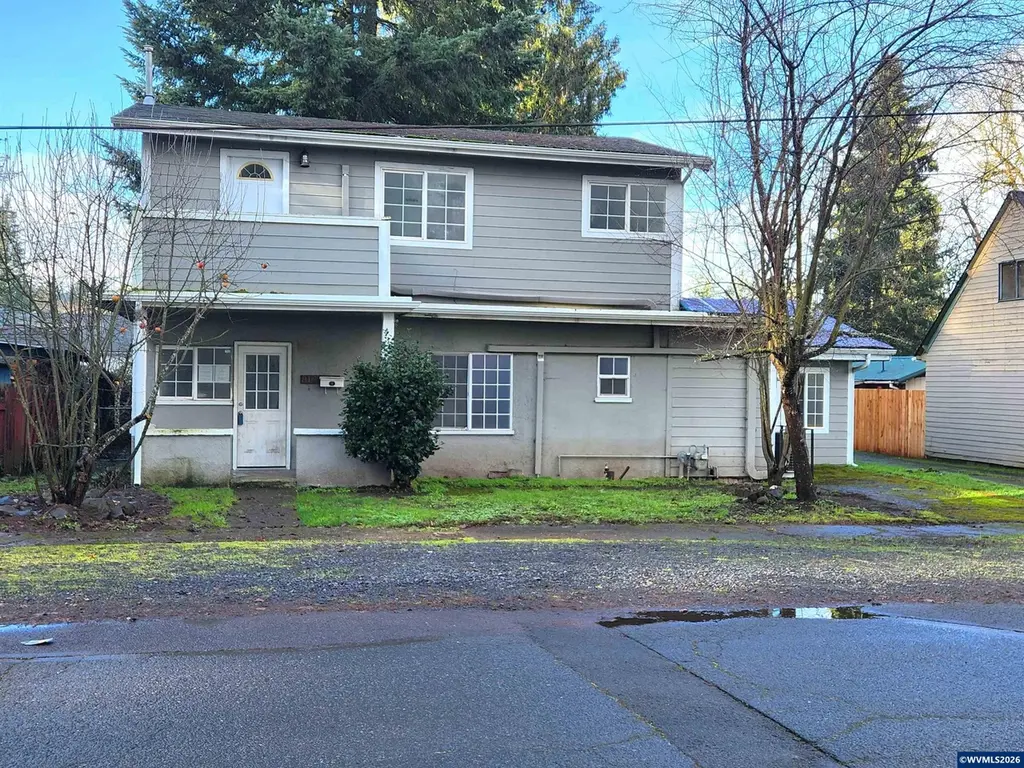
816 14th Ave · Sweet Home, OR
Flood risk 1/10 · Minimal
- FEMA flood zone
- X (unshaded)
- Chance of flooding over 30 yrs
- 0.0%
- Est. flood insurance / yr
- $507 – $1,088
Fire risk 5/10 · Moderate
- Est. fire insurance / yr
- $498 – $926
Heat risk 4/10 · Minor
- Hot days now (above 91°F)
- 8 days/yr
- Hot days in 30 yrs
- 17 days/yr
Wind risk 1/10 · Minimal
- Chance of severe wind over 30 yrs
- —
Air-quality risk 10/10 · Severe
- Unhealthy air days now
- 11 days/yr
- Unhealthy air days in 30 yrs
- 15 days/yr
Risk factors via First Street. Map © Google.
Why this score? — see what drove the C- grade
The composite is a weighted blend of 9 inputs, each scored 0–100. Each bar is that input's sub-score; the figure is the points it added to the 100-point composite (weight × sub-score).
- ARV discount +15.0/15.0
- Cash flow +13.2/30.0
- Appreciation +5.0/10.0
- DSCR +4.0/10.0
- 1% rule +3.4/10.0
- Livability +3.2/5.0
- Schools +2.9/10.0
- Rent growth +2.5/5.0
- Condition / age +2.5/5.0
$208,000
🖨 Deal sheet 📄 Offer letter ✓ Due diligence
Listing remarks MLS
Classic 1939 home with 4 bedrooms and 2 bathrooms, totaling 1,675 sq ft Situated directly across from a Sankey Park in Sweet Home. Home is in need of some work and updating, offering a great opportunity to customize or restore. Quiet small-town setting with easy access to local amenities. Cash or renovation loan likely required.
Key facts
- 5,663 sq ft lot
- Built 1939
- Listed 148 days
Neighborhood map
What this means for you Summary
Snapshot
- This is a 4-bed/2.0-bath single-family listed at $208k.
Deal economics
- At list price, monthly cash flow is $-2 ($-27/yr) — negative.
- To cash-flow at today's rent, offer at most $208k (0.2% below list).
- To meet the 1% rule (rent ≥ 1% of price), the offer needs to be $175k (15.9% below list).
- Recommended offer: $175k (15.9% below list) — sets the bar for 1% rule.
- Cap rate 6.3% vs local median 2.9% in Sweet Home — top-decile yield for the area; either an underpriced asset or a hidden risk that comps aren't pricing in. Stress-test before assuming the spread holds.
Location & tenants
- Location reads 63/100 on livability (#233 in OR) — a middle-class / working-renter tenant base. Strengths: cost of living A+, housing A+; Watch: health & safety C-, schools D-, amenities F.
- Sweet Home SD 55 (town): math 26% / reading 42% proficiency, ranked #29 of 58 in OR (top 50%) — families likely to look elsewhere, expect single-tenant / working-renter base with shorter leases.
- Market conditions: 1 active listings in the ZIP; 1 comparable units currently listed for rent nearby; 311 units permitted in Linn County in 2024 (60 in 5+ unit buildings).
Forward outlook
- In year one you build about $8k of equity ($1k loan paydown + $6k appreciation (3.0% local appreciation)).
- Linn County population projected at +5% by 2050 — modest demand growth; plan on rents tracking national, not racing it.
- At projected returns (3.0% appreciation + 3.0% rent growth), your $58k cash investment doubles in ~7 years — after that, you're playing with house money.
- By year 5, paydown + projected appreciation supports a ~$33k cash-out refi (75% LTV) — recoverable capital for the next deal without selling this one.
Negotiation context
- It's been on market 148 days — a 12% lower offer ($183k) is reasonable based on typical stale-listing flexibility.
- 3 sale attempts since 22y ago; this cycle's ask has dropped $32k (13%) from the opening price — seller is motivated, your offer sets the floor, not the list.
Risks & watch-outs
- Watch-outs: built in 1939 — expect roof / HVAC / electrical / plumbing capex.
- Climate carrying-cost: moderate wildfire risk — expect insurance premiums to compound above CPI over the hold.
Questions for the listing agent
- What do current leases actually rent for vs. the listed asking? Can we see a recent rent roll and the last 12 months of T-12 income?
- It's been on market 148 days. Have you received any prior offers? Is the seller open to a 16% concession, seller financing, or rate buy-down credit?
- Built in 1939 — when were the roof, HVAC, electrical panel, plumbing, and water heater last replaced?
- Why hasn't it sold? Are there any deal-killer items the seller is aware of (foundation, flood, title, zoning, code violations)?
- Is there a deadline driving the sale (1031 exchange, divorce, estate, relocation)? That informs how much negotiation room exists.
- Schools are D-rated, which usually means shorter tenancies and higher turnover. Who's the typical renter profile here, and what's been the actual vacancy rate?
- What's the average days-on-market for RENTAL listings here right now (not sales)? A rising rental-DOM trend means longer vacancies and softer asking-rent achievability than the comps imply.
- What's the recent tenant-quality profile in this submarket — average credit score on applications, eviction rate, late-payment / NSF rate, and stable-employment percentage? A property-management company in the area should have these aggregated.
- How much new for-sale + rental construction is in the pipeline within 1–3 miles? Heavy new supply typically softens prices + rents 12–24 months out; constrained supply supports both.
Investment metrics
- 1% rule
- 0.84% ✗
- Cap rate
- 6.28%
- Cash-on-cash
- -0.05%
- DSCR
- 1.00
- GRM
- 9.9
CMA / ARV
- ARV (median comp)
- $327,450
- List price
- $208,000
- Delta
- -36.48%
- Verdict
- UNDERPRICED
- Comps
- 20 within 1.0 mi
Show comp detail 12 sales within ~0.75 mi
| Address | Dist | Beds/Ba | Sqft | Sold | Price | $/sf | Match |
|---|---|---|---|---|---|---|---|
| 910 Oak Ter | 0.27mi | 4/2.0 | 1,676 (+0%) | 2mo | $370,000 | $221 | 85 |
| 1730 Cedar St | 0.32mi | 3/2.0 (-1) | 1,704 (+2%) | 4mo | $365,000 | $214 | 74 |
| 1160 Cedar St | 0.25mi | 3/2.0 (-1) | 1,820 (+9%) | 1mo | $330,000 | $181 | 68 |
| 1435 Elm St | 0.17mi | 3/2.0 (-1) | 1,484 (-11%) | 1mo | $324,900 | $219 | 67 |
| 500 Ironwood St | 0.49mi | 3/2.0 (-1) | 1,614 (-4%) | 8mo | $375,000 | $232 | 59 |
| 1651 13th Ave | 0.45mi | 4/2.0 | 1,532 (-8%) | 7mo | $365,000 | $238 | 59 |
| 1708 Fir St | 0.25mi | 3/2.5 (-1) | 1,430 (-15%) | 2mo | $365,000 | $255 | 55 |
| 1038 3rd Ave | 0.64mi | 3/2.0 (-1) | 1,756 (+5%) | 3mo | $352,600 | $201 | 54 |
| 532 6th Ave | 0.48mi | 3/1.5 (-1) | 1,784 (+6%) | 7mo | $287,500 | $161 | 54 |
| 225 21st Ave | 0.50mi | 3/2.0 (-1) | 1,498 (-11%) | 1mo | $356,500 | $238 | 53 |
| 1720 9th Ave | 0.58mi | 3/2.0 (-1) | 1,459 (-13%) | 2mo | $590,000 | $404 | 45 |
| 2263 Harding St | 0.56mi | 5/2.0 (+1) | 1,870 (+12%) | 7mo | $352,000 | $188 | 43 |
Match score weights: distance 35% · size 25% · config 20% · recency 20%. Top-matched comps best support the ARV.
Projected returns pro-forma
3.0% appreciation · 3.0% rent growth · sell at horizon
- IRR
- 7.5%
- Equity multiple
- 1.43×
- Total profit
- $24,909
- Equity at exit
- $93,526
- IRR
- 10.2%
- Equity multiple
- 2.53×
- Total profit
- $88,896
- Equity at exit
- $144,134
Cash invested: $58,240 (down + closing). Projections, not guarantees.
Landlord ↔ Tenant lean methodology
- Overall (STATE)
- 28 Tenant-Leaning
- State Oregon
- 28 Tenant-Leaning · D+6
- County
- — inherits STATE
- City
- — inherits STATE
ZIP-level market 97386-2235
- Active inventory
- 1
- Price-to-rent
- 9.9×
Monthly cashflow live
- Estimated rent
- $1,750 medium interval (Pro) →
- Mortgage (P&I)
- −$1,091
- Tax from tax record
- −$207 /mo · $2,487/yr
- Insurance
- −$87
- HOA
- −$0
- Vacancy / Maint / Mgmt
- −$368
- Net cashflow
- $-2
Break-even live
UW: 25.0% down · 7.5% · 30yr · 1.5% tax · 5.0% vac · 8.0% maint · 8.0% mgmt
Financing live
Cash to close
- Down payment
- $52,000
- Closing costs
- $6,240
- Reserves months
- —
- Total cash needed
- —
Loan-product check · same deal, 3 products live
Conventional
25% down · 7.5% · 30yr
- Down + closing
- —
- Monthly P&I
- —
- Monthly cashflow
- —
- DSCR
- —
- Eligible?
- —
Personal DTI + credit; lowest rate.
DSCR
20% down · 8.5% · 30yr
- Down + closing
- —
- Monthly P&I
- —
- Monthly cashflow
- —
- DSCR
- —
- Eligible?
- —
No personal income docs; deal must DSCR.
Hard money
10% down · 12.0% · 12mo
- Down + closing
- —
- Monthly P&I
- —
- Monthly cashflow
- —
- DSCR
- —
- Eligible?
- —
Short-term bridge; refi at stabilization.
Rent comps 1 comps
| Address | Beds | Baths | Sqft | Rent | $/sqft | DOM | Units | Dist |
|---|---|---|---|---|---|---|---|---|
| 2034 Long St Sweet Home, OR | 3.0 | 1.0 | 1050 | $1,750 | $1.67 | 43d | 1 | 0.52mi |
Listing history 26 events
-
2026-06-13statusdays on market $208,000 Pending 148 DOM
-
2026-06-10days on market $208,000 Active 146 DOM
-
2026-06-09days on market $208,000 Active 145 DOM
-
2026-06-08days on market $208,000 Active 144 DOM
-
2026-06-07days on market $208,000 Active 143 DOM
-
2026-06-05days on market $208,000 Active 140 DOM
-
2026-06-02days on market $208,000 Active 138 DOM
-
2026-06-01days on market $208,000 Active 137 DOM
-
2026-05-31days on market $208,000 Active 136 DOM
-
2026-05-30days on market $208,000 Active 135 DOM
-
2026-04-22price $215,000 330-char remark
Show marketing remark (330 chars)
Classic 1939 home with 4 bedrooms and 2 bathrooms, totaling 1,675 sq ft Situated directly across from a Sankey Park in Sweet Home. Home is in need of some work and updating, offering a great opportunity to customize or restore. Quiet small-town setting with easy access to local amenities. Cash or renovation loan likely required.
-
2026-03-21price $224,900 330-char remark
Show marketing remark (330 chars)
Classic 1939 home with 4 bedrooms and 2 bathrooms, totaling 1,675 sq ft Situated directly across from a Sankey Park in Sweet Home. Home is in need of some work and updating, offering a great opportunity to customize or restore. Quiet small-town setting with easy access to local amenities. Cash or renovation loan likely required.
-
2026-02-19price $232,000 330-char remark
Show marketing remark (330 chars)
Classic 1939 home with 4 bedrooms and 2 bathrooms, totaling 1,675 sq ft Situated directly across from a Sankey Park in Sweet Home. Home is in need of some work and updating, offering a great opportunity to customize or restore. Quiet small-town setting with easy access to local amenities. Cash or renovation loan likely required.
-
2026-01-15$239,900 Active 330-char remark
Show marketing remark (330 chars)
Classic 1939 home with 4 bedrooms and 2 bathrooms, totaling 1,675 sq ft Situated directly across from a Sankey Park in Sweet Home. Home is in need of some work and updating, offering a great opportunity to customize or restore. Quiet small-town setting with easy access to local amenities. Cash or renovation loan likely required.
-
2024-12-03price $314,000
-
2024-10-29price $319,000
-
2022-06-21soldstatus $285,000 Sold
-
2022-06-21soldstatus $285,000
-
2022-04-29historical Active under Contract
-
2022-04-21price $285,000
-
2022-03-18$325,000 Active
-
2017-06-19soldstatus $57,753
-
2017-04-07soldstatus $56,000
-
2004-12-02soldstatus $98,000
-
2004-12-02soldstatus $98,000
-
2004-07-09$99,900
ⓘ Source: listings_history table (triggers on properties + properties_extension) + one-shot
backfill from property_details.listing_events for pre-trigger history.
Tax reassessment forecast OR · Resets to sale price
- Current annual tax
- $2,487 · $207/mo
- Projected year-2 tax
- $2,487 · $207/mo
- Expected delta
- $0/yr ($0/mo · 0.0%)
ⓘ Screening estimate from a state-policy table — verify with the county assessor before closing.
Climate risk First Street
- Flood 1/10 Low FEMA zone X (unshaded) · 0% chance over 30 yrs
- Wildfire 5/10 Major
- Heat 4/10 Moderate 8 d/yr ≥91°F today · 17 d/yr by 30 yrs out
- Wind 1/10 Low
- Air quality 10/10 Extreme 11 unhealthy d/yr today · 15 by 30 yrs out
Nearby sold comps map
Loading sold comps map…
Walkable amenities ~0.75 mi
Loading nearby amenities…
Taxation est. · year 1
- Rental income
- $21,000
- − Mortgage interest
- −$11,651
- − Property taxes
- −$2,487
- − Insurance
- −$1,040
- − Repairs & maintenance
- −$1,680
- − Management
- −$1,680
- − Depreciation
- −$6,051
- Taxable loss
- −$3,590
- Est. tax savings @ 24.0%
- +$861
- After-tax cash flow
- $835/yr
For passive investors: Depreciation is non-cash, so a rental often shows a tax loss while cash-flowing — sheltering income. Rental losses are passive: they offset passive income freely, and up to $25,000/yr can offset ordinary (W-2) income if you actively participate and your MAGI is under $100k (phasing out to $0 by $150k); unused losses carry forward. On sale, claimed depreciation is recaptured at up to 25%, and gains may owe capital-gains tax (a 1031 exchange can defer both). Figures are a year-1 estimate at your 24.0% rate — not tax advice; consult a CPA.
Schools (NCES district)
- District
- Sweet Home SD 55
- NCES district ID
- 4111970
- Math proficiency
- 26% ▼ -7.00%
- Reading proficiency
- 42% ▼ -3.00%
- Median HH income
- $41,727
- Composite
- 28.67/100
- National rank
- #6698
- State rank
- #29 of 58 in OR
Livability — Sweet Home
- Score
- 63/100
- State rank
- #233
- US rank
- #15826
Category grades
Schools grade is shown separately in the Schools card above.
Census & demographics
- Census place
- Sweet Home, OR
Population outlook (Linn County) Hauer SSP2
- Today (2025)
- 127,026 people
- By 2030
- 129,540 · +2.0%
- By 2040
- 132,780 · +4.5%
- By 2050
- 133,614 · +5.2%
- By 2075
- 129,061 · +1.6%
- By 2100
- 112,224 · -11.7%
Not yet ingested
- Political lean
- —
- Race & ethnicity
- —
- Common origin
- —
- Civics
- —
Market trends
- HPI YoY
- —
- Current HPI
- —
- Rent YoY
- —
- Metro
- —
- State GDP YoY
- ▲ 2.05%
- F500 in state
- 2
Industry mix (Fortune 500 HQ in OR)
| Industry | F500 HQs | Revenue |
|---|---|---|
| Consumer Goods | 1 | $51B |
|
||
Price history
+115.2% since first listed16 events — show timeline
- 2026-04-22 Price Changed $215,000 WVMLS
- 2026-03-21 Price Changed $224,900 WVMLS
- 2026-02-19 Price Changed $232,000 WVMLS
- 2026-01-15 Listed $239,900 WVMLS
- 2024-12-03 Price Changed $314,000 WVMLS
- 2024-10-29 Price Changed $319,000 WVMLS
- 2022-06-21 Sold (Public Records) $285,000 Public Records
- 2022-06-21 Sold (MLS) $285,000 WVMLS
- 2022-04-29 Contingent — WVMLS
- 2022-04-21 Price Changed $285,000 WVMLS
- 2022-03-18 Listed $325,000 WVMLS
- 2017-06-19 Sold (Public Records) $57,753 Public Records
- 2017-04-07 Sold (Public Records) $56,000 Public Records
- 2004-12-02 Sold (Public Records) $98,000 Public Records
- 2004-12-02 Sold (MLS) $98,000 WVMLS
- 2004-07-09 Listed $99,900 WVMLS
Property tax history
+3.2%/yrLatest (2025): $2,487 · +2.9% YoY. Source: county tax records.
Cash-flow waterfall
monthlySold comps — $/sqft
last 12 mo · ≤1 miLoading sold comps…