 Fourplex
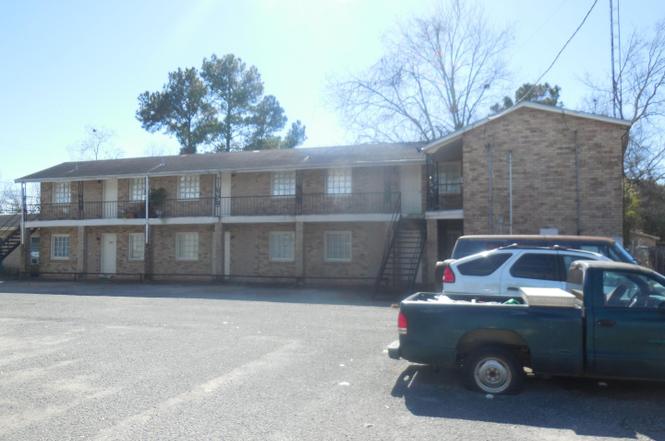
321 S Academy St · Opelousas, LA
Flood risk 1/10 · Minimal
- FEMA flood zone
- X (unshaded)
- Chance of flooding over 30 yrs
- 0.0%
- Est. flood insurance / yr
- $507 – $1,088
Fire risk 1/10 · Minimal
- Est. fire insurance / yr
- $1,269 – $2,357
Heat risk 8/10 · Major
- Hot days now (above 110°F)
- 7 days/yr
- Hot days in 30 yrs
- 21 days/yr
Wind risk 9/10 · Severe
- Chance of severe wind over 30 yrs
- 99.0%
Air-quality risk 1/10 · Minimal
- Unhealthy air days now
- 0 days/yr
- Unhealthy air days in 30 yrs
- 0 days/yr
Risk factors via First Street. Map © Google.
Why this score? — see what drove the B- grade
The composite is a weighted blend of 9 inputs, each scored 0–100. Each bar is that input's sub-score; the figure is the points it added to the 100-point composite (weight × sub-score).
- Cash flow +30.0/30.0
- DSCR +10.0/10.0
- 1% rule +8.1/10.0
- ARV discount +7.5/15.0
- Livability +3.2/5.0
- Rent growth +2.5/5.0
- Condition / age +2.5/5.0
- Schools +2.2/10.0
- Appreciation +0.0/10.0
$277,900
🖨 Deal sheet 📄 Offer letter ✓ Due diligence
Multi-family units
County records classify this as Multi-Family (5+ Unit). Listing-text estimate: 4 units. estimate disagrees with records
5+ unit building — per-unit beds/baths from public records are typically unavailable; the breakdown below (if shown) is an estimate from the listing text.
Listing remarks MLS
Great Multi-Family Investment Opportunity! This income producing commercial corner is located right on the corner of S Academy & 190 in the historic district of Opelousas near Lowe's Home Improvement. One structure is a 5-Plex which is 100% occupied. The second building is a vacant 7400 Sq.Ft structure which was once used as a lounge/restaurant. The tenants are all long term of 8+ years. Schedule your appointment today!
Key facts
- Under-market rentals
- Prime location
- Corner lot
Tags
Neighborhood map
What this means for you Summary
Snapshot
- This is a 4 × 2-bed/1.0-bath units multifamily listed at $278k.
Deal economics
- At list price, monthly cash flow is $1k ($14k/yr) — positive. Per door: $301/mo.
- The deal already cash-flows at list — no discount required.
- Meets the 1% rule at list price ($4k rent vs $278k).
- Recommended offer: $245k (12.0% below list) — sets the bar for market timing.
- Cap rate 11.5% vs local median 4.0% in Opelousas — top-decile yield for the area; either an underpriced asset or a hidden risk that comps aren't pricing in. Stress-test before assuming the spread holds.
Location & tenants
- Location reads 63/100 on livability (#187 in LA) — a middle-class / working-renter tenant base. Strengths: cost of living A+, housing A+, health & safety A+; Watch: crime F, amenities F, commute F.
- St. Landry Parish (town): math 20% / reading 33% proficiency, ranked #54 of 98 in LA (top 55%) — low school quality limits family demand, transient renter base, plan for 1-2y turnover; 73% free/reduced lunch — lower-income household profile, screen leases tightly.
- Zoned schools: Opelousas Middle School (math 5% / reading 16%, grade F, #197 of 218 statewide, top 91%, 246 students, 92% FRL); Opelousas Senior High School (math 11% / reading 18%, grade F, #224 of 265 statewide, top 86%, 840 students, 77% FRL).
- Zoned-school proficiency averages 12% at this address vs 26% district-wide (-14 pts) — the specific schools serving this property underperform the St. Landry Parish average; the district grade overstates school quality for this exact location.
- Market conditions: 309 active listings in the ZIP; 142 units permitted in St. Landry Parish in 2024 (0 in 5+ unit buildings).
Forward outlook
- Local home prices are declining (-3.0%/yr); year-one equity from $2k of loan paydown is wiped out by about $8k of value loss. Plan a longer hold.
- St. Landry County population projected to shrink 9% by 2050 — rents likely to lag national; underwrite the cash flow, not the appreciation.
- At projected returns (-3.0% appreciation + 3.0% rent growth), your $78k cash investment doubles in ~7 years — after that, you're playing with house money.
Negotiation context
- It's been on market 304 days — a 12% lower offer ($245k) is reasonable based on typical stale-listing flexibility.
- 5 sale attempts since 8y ago with the ask held roughly flat each time — persistent listings suggest the price (not the market) is what's stuck; bring a comps-based counter.
- Current owner paid $130k; list at $278k implies a 114% gain — meaningful room to come down on a strong offer.
Risks & watch-outs
- Climate carrying-cost: severe wind risk, 99% chance of damaging wind over 30y; extreme-heat days projected 7→21/yr by 2055 (HVAC capex compounding) — expect insurance premiums to compound above CPI over the hold.
Questions for the listing agent
- It's been on market 304 days. Have you received any prior offers? Is the seller open to a 12% concession, seller financing, or rate buy-down credit?
- Can we see the unit-by-unit rent roll, current vacancy, and any below-market leases? What's the average tenancy length?
- What capital expenditures (roof, boiler, parking lot, exteriors) have been made in the last 5 years, and what's planned in the next 2?
- Why hasn't it sold? Are there any deal-killer items the seller is aware of (foundation, flood, title, zoning, code violations)?
- Is there a deadline driving the sale (1031 exchange, divorce, estate, relocation)? That informs how much negotiation room exists.
- Crime grade is F in this area — have there been break-ins, vandalism, or insurance claims at this property in the last 3 years? What carrier currently insures it and at what premium?
- What's the average days-on-market for RENTAL listings here right now (not sales)? A rising rental-DOM trend means longer vacancies and softer asking-rent achievability than the comps imply.
- What's the recent tenant-quality profile in this submarket — average credit score on applications, eviction rate, late-payment / NSF rate, and stable-employment percentage? A property-management company in the area should have these aggregated.
- How much new apartment / multifamily construction is in the pipeline within 1–3 miles? Heavy new supply (>2% of stock underway) typically softens rents 12–24 months out; light construction supports rent growth.
Investment metrics
- 1% rule
- 1.31% ✓
- Cap rate
- 11.49%
- Cash-on-cash
- 18.55%
- DSCR
- 1.83
- GRM
- 6.4
CMA / ARV
No comps found within radius.
Projected returns pro-forma
-3.0% appreciation · 3.0% rent growth · sell at horizon
- IRR
- 10.3%
- Equity multiple
- 1.40×
- Total profit
- $31,492
- Equity at exit
- $41,436
- IRR
- 19.3%
- Equity multiple
- 2.62×
- Total profit
- $125,696
- Equity at exit
- $24,028
Cash invested: $77,812 (down + closing). Projections, not guarantees.
Landlord ↔ Tenant lean methodology
- Overall (STATE)
- 90 Strongly Landlord-Friendly
- State Louisiana
- 90 Strongly Landlord-Friendly · R+12
- County
- — inherits STATE
- City
- — inherits STATE
ZIP-level market 70570
- Home prices YoY
- -34.7%
- Active inventory
- 309
- Price-to-rent
- 25.4×
Monthly cashflow live
- Estimated rent
- $3,646 medium interval (Pro) →
- Mortgage (P&I)
- −$1,457
- Tax from tax record
- −$104 /mo · $1,251/yr
- Insurance
- −$116
- HOA
- −$0
- Vacancy / Maint / Mgmt
- −$766
- Net cashflow
- $1,203
Break-even live
4-unit breakdown (identical units grouped — click to expand)
| Units | Beds | Baths | Est. rent |
|---|---|---|---|
| 4× units | 2 | 1 | $3,644 |
| #1 | 2 | 1 | $911 |
| #2 | 2 | 1 | $911 |
| #3 | 2 | 1 | $911 |
| #4 | 2 | 1 | $911 |
| Total (4 units) | $3,646 | ||
UW: 25.0% down · 7.5% · 30yr · 1.5% tax · 5.0% vac · 8.0% maint · 8.0% mgmt
Financing live
Cash to close
- Down payment
- $69,475
- Closing costs
- $8,337
- Reserves months
- —
- Total cash needed
- —
Loan-product check · same deal, 3 products live
Conventional
25% down · 7.5% · 30yr
- Down + closing
- —
- Monthly P&I
- —
- Monthly cashflow
- —
- DSCR
- —
- Eligible?
- —
Personal DTI + credit; lowest rate.
DSCR
20% down · 8.5% · 30yr
- Down + closing
- —
- Monthly P&I
- —
- Monthly cashflow
- —
- DSCR
- —
- Eligible?
- —
No personal income docs; deal must DSCR.
Hard money
10% down · 12.0% · 12mo
- Down + closing
- —
- Monthly P&I
- —
- Monthly cashflow
- —
- DSCR
- —
- Eligible?
- —
Short-term bridge; refi at stabilization.
Listing history 10 events
-
2026-04-13status Pending
-
2026-03-03status Active
-
2026-03-03price $277,900
-
2025-06-25status Active
-
2025-06-05status Pending
-
2025-05-21status Active
-
2025-05-21status Pending
-
2025-05-19$279,000 Active
-
2018-04-16soldstatus $130,000 427-char remark
Show marketing remark (427 chars)
Great Multi-Family Investment Opportunity! This income producing commercial corner is located right on the corner of S Academy & 190 in the historic district of Opelousas near Lowe's Home Improvement. One structure is a 5-Plex which is 100% occupied. The second building is a vacant 7400 Sq.Ft structure which was once used as a lounge/restaurant. The tenants are all long term of 8+ years. Schedule your appointment today!
-
2018-01-29$194,000 427-char remark
Show marketing remark (427 chars)
Great Multi-Family Investment Opportunity! This income producing commercial corner is located right on the corner of S Academy & 190 in the historic district of Opelousas near Lowe's Home Improvement. One structure is a 5-Plex which is 100% occupied. The second building is a vacant 7400 Sq.Ft structure which was once used as a lounge/restaurant. The tenants are all long term of 8+ years. Schedule your appointment today!
ⓘ Source: listings_history table (triggers on properties + properties_extension) + one-shot
backfill from property_details.listing_events for pre-trigger history.
Tax reassessment forecast LA · Resets to sale price
- Current annual tax
- $1,251 · $104/mo
- Projected year-2 tax
- $1,528 · $127/mo
- Expected delta
- +$278/yr (+$23/mo · 22.2%)
ⓘ Screening estimate from a state-policy table — verify with the county assessor before closing.
Climate risk First Street
- Flood 1/10 Low FEMA zone X (unshaded) · 0% chance over 30 yrs
- Wildfire 1/10 Low
- Heat 8/10 Severe 7 d/yr ≥110°F today · 21 d/yr by 30 yrs out
- Wind 9/10 Extreme 99% chance of damaging wind over 30 yrs
- Air quality 1/10 Low 0 unhealthy d/yr today · 0 by 30 yrs out
Nearby sold comps map
Loading sold comps map…
Walkable amenities ~0.75 mi
Loading nearby amenities…
Taxation est. · year 1
- Rental income
- $43,752
- − Mortgage interest
- −$15,567
- − Property taxes
- −$1,251
- − Insurance
- −$1,390
- − Repairs & maintenance
- −$3,500
- − Management
- −$3,500
- − Depreciation
- −$8,084
- Taxable income
- $10,460
- Est. tax owed @ 24.0%
- −$2,510
- After-tax cash flow
- $11,925/yr
For passive investors: Depreciation is non-cash, so a rental often shows a tax loss while cash-flowing — sheltering income. Rental losses are passive: they offset passive income freely, and up to $25,000/yr can offset ordinary (W-2) income if you actively participate and your MAGI is under $100k (phasing out to $0 by $150k); unused losses carry forward. On sale, claimed depreciation is recaptured at up to 25%, and gains may owe capital-gains tax (a 1031 exchange can defer both). Figures are a year-1 estimate at your 24.0% rate — not tax advice; consult a CPA.
Schools (NCES district)
- District
- St. Landry Parish
- NCES district ID
- 2201560
- Math proficiency
- 20% ▼ -43.00%
- Reading proficiency
- 33% ▼ -35.00%
- Median HH income
- $32,635
- Composite
- 21.59/100
- National rank
- #8303
- State rank
- #54 of 98 in LA
Livability — Opelousas
- Score
- 63/100
- State rank
- #187
- US rank
- #14928
Category grades
Schools grade is shown separately in the Schools card above.
Census & demographics
- Census place
- Opelousas, LA
- Population (ZIP)
- 37,188
Population outlook (St. Landry County) Hauer SSP2
- Today (2025)
- 83,114 people
- By 2030
- 82,110 · -1.2%
- By 2040
- 79,445 · -4.4%
- By 2050
- 75,855 · -8.7%
- By 2075
- 65,684 · -21.0%
- By 2100
- 51,739 · -37.7%
Race, ethnicity, and origin ACS 2023
- Neighborhood character
- Diverse neighborhood (Simpson 0.56)
- Race & ethnicity
- Black 55% White 37% Two or more races 4% Hispanic / Latino 4%
- Common ancestry
- Lithuanian 8%
- Foreign-born
- 1% · Canada
- Languages at home
- 92% English-only · French/Haitian/Cajun 5% Spanish 3%
Political lean MEDSL · St. Landry
- 2024 margin
- R (+18.8) · D 40.0% · R 58.9% · Other 1.1%
- 2008→2024 swing
- -15.6pp toward R · 2008: -3.2pp · 2024: -18.8pp
- All cycles
- 2024: R+18.8 2020: R+14.1 2016: R+11.9 2012: R+4.3 2008: R+3.2
Not yet ingested
- Civics
- —
Market trends
- HPI YoY
- ▼ -52.38%
- Current HPI
- 98.4256
- Rent YoY
- —
- Metro
- —
- State GDP YoY
- ▲ 3.29%
- F500 in state
- 10
Industry mix (Fortune 500 HQ in LA)
| Industry | F500 HQs | Revenue |
|---|---|---|
| Telecommunications | 2 | $23B |
|
||
| Utilities | 1 | $12B |
|
||
| Wholesale / Distribution | 1 | $5B |
|
||
| Advertising | 1 | $2B |
|
||
Price history
+43.2% since first listed10 events — show timeline
- 2026-04-13 Pending — AcadianaMLS
- 2026-03-03 Relisted — AcadianaMLS
- 2026-03-03 Price Changed $277,900 AcadianaMLS
- 2025-06-25 Relisted — AcadianaMLS
- 2025-06-05 Pending — AcadianaMLS
- 2025-05-21 Relisted — AcadianaMLS
- 2025-05-21 Pending — AcadianaMLS
- 2025-05-19 Listed $279,000 AcadianaMLS
- 2018-04-16 Sold (MLS) $130,000 AcadianaMLS
- 2018-01-29 Listed $194,000 AcadianaMLS
Property tax history
+3.6%/yrLatest (2025): $1,251 · +0.0% YoY. Source: county tax records.
Cash-flow waterfall
monthlySold comps — $/sqft
last 12 mo · ≤1 miLoading sold comps…