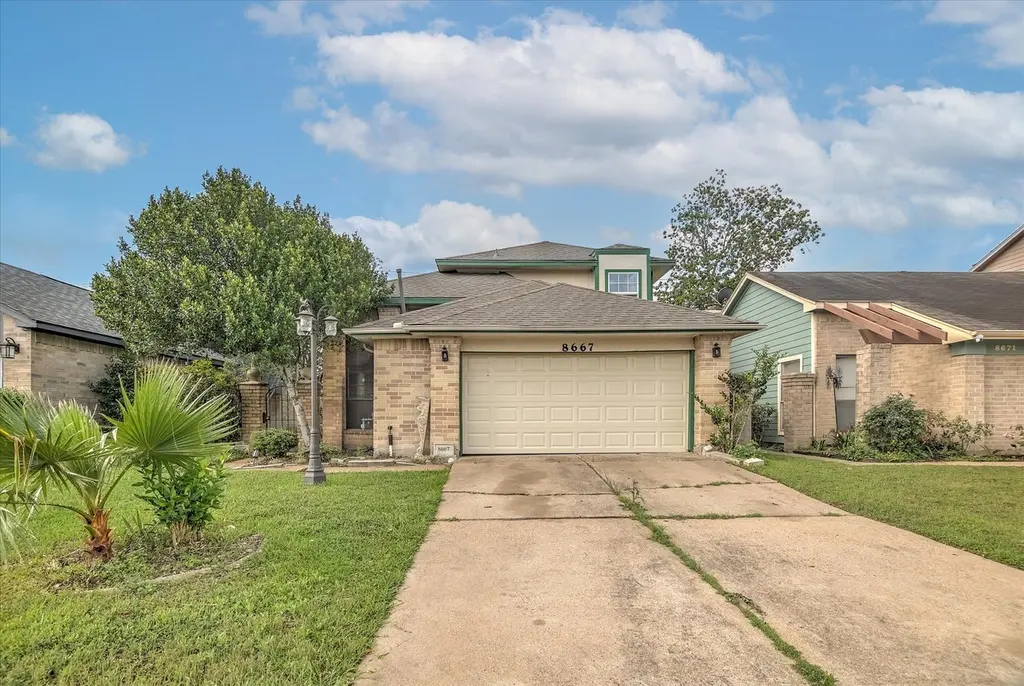
8667 Vinkins Rd · Houston, TX
Flood risk 4/10 · Minor
- FEMA flood zone
- X (unshaded)
- Chance of flooding over 30 yrs
- 0.22%
- Est. flood insurance / yr
- $507 – $1,088
Fire risk 1/10 · Minimal
- Est. fire insurance / yr
- $1,222 – $2,270
Heat risk 9/10 · Severe
- Hot days now (above 110°F)
- 7 days/yr
- Hot days in 30 yrs
- 24 days/yr
Wind risk 9/10 · Severe
- Chance of severe wind over 30 yrs
- 99.0%
Air-quality risk 3/10 · Minor
- Unhealthy air days now
- 2 days/yr
- Unhealthy air days in 30 yrs
- 3 days/yr
Risk factors via First Street. Map © Google.
Why this score? — see what drove the D grade
The composite is a weighted blend of 9 inputs, each scored 0–100. Each bar is that input's sub-score; the figure is the points it added to the 100-point composite (weight × sub-score).
- ARV discount +11.2/15.0
- Cash flow +9.6/30.0
- Appreciation +4.6/10.0
- 1% rule +4.0/10.0
- Livability +3.7/5.0
- DSCR +2.7/10.0
- Schools +2.7/10.0
- Condition / age +2.5/5.0
- Rent growth +2.1/5.0
$199,000
🖨 Deal sheet (PDF) 📄 Offer letter ✓ Due diligence
Listing remarks MLS
Great 3 bedroom, 2 1/2 bath home with formal dining, and parquet, carpet, and ceramic tile flooring. Well located, close to freeways, schools, and shopping centers. 1637 square feet - information is from the FHA appraisal and is deemed reliable but not guaranteed. Evidence of mold not remediated.
Key facts
- 4,234 sq ft lot
- 2 garage spots
- Built 1982
Property features AI
Finance
- HOA & community: Association: Goodwin & Company; Annual association fee of $575
Exterior
- Parking: Attached garage with garage door opener (2 car spaces)
- Utilities: Public water; Public sewer
- Home design: Residential property; Built in 1982; Slab foundation; Composition roof
- Construction: Brick construction
- Exterior features: Located in a subdivision
Interior
- Kitchen: Dishwasher; Electric range; Garbage disposal
- Bedrooms: Primary bedroom on the first floor (approx. 14x14); Two additional bedrooms on the second floor (approx. 12x10 and 13x10)
- Flooring: Laminate; Tile; Vinyl
- Bathrooms: 2 full bathrooms; 1 half bathroom
- Heating & cooling: Central heating (gas); Central air conditioning (electric)
- Interior features: Gas fireplace (1); Double vanity; High ceilings; 6 total rooms
- Laundry & utility: Washer hookup; Electric dryer hookup; Gas dryer hookup
Neighborhood map
What this means for you Summary
Snapshot
- This is a 3-bed/2.5-bath single-family listed at $199k.
Deal economics
- At list price, monthly cash flow is $-134 ($-2k/yr) — negative.
- To cash-flow at today's rent, offer at most $175k (11.9% below list).
- To meet the 1% rule (rent ≥ 1% of price), the offer needs to be $180k (9.8% below list).
- Recommended offer: $175k (11.9% below list) — sets the bar for cash-flow.
- Cap rate 5.5% vs local median 3.2% in Houston — top-decile yield for the area; either an underpriced asset or a hidden risk that comps aren't pricing in. Stress-test before assuming the spread holds.
Location & tenants
- Location reads 74/100 on livability (#184 in TX, #4,771 nationally) — a middle-class / working-renter tenant base. Strengths: amenities A+, cost of living A+, housing A+; Watch: crime F.
- Houston ISD (urban): math 27% / reading 35% proficiency, ranked #593 of 826 in TX (top 72%) — families likely to look elsewhere, expect single-tenant / working-renter base with shorter leases; 71% free/reduced lunch — lower-income household profile, screen leases tightly.
- Zoned schools: Gross El (math 27% / reading 37%, grade F, #2,268 of 4,322 statewide, top 55%, 481 students, 98% FRL); Welch Middle (math 11% / reading 21%, grade F, #1,543 of 1,662 statewide, top 94%, 645 students, 97% FRL); Westbury H S (math 19% / reading 31%, grade F, #1,250 of 1,632 statewide, top 77%, 2,243 students, 92% FRL) — zoned schools average 96% FRL vs 71% district-wide (24 pts higher); higher-poverty schools than district average — tighter screening recommended.
- Market conditions: Rents soft (-1.5%/yr); 136 active listings in the ZIP; 13 comparable units currently listed for rent nearby; rentals leasing fast (median 1d on market — plan ~1-2 weeks tenant-placement turnaround); 29,883 units permitted in Harris County in 2024 (8,621 in 5+ unit buildings).
- This rent runs 40% of the median local income ($54k/yr) — at the standard rent-burdened threshold; future hikes will face affordability resistance.
Forward outlook
- Local home prices are declining (-0.7%/yr); year-one equity from $1k of loan paydown is wiped out by about $1k of value loss. Plan a longer hold.
- Harris County population projected at +47% by 2050 — long-run rental-demand tailwind backs the buy-and-hold thesis.
Negotiation context
- It's been on market 64 days — a 6% lower offer ($187k) is reasonable based on typical stale-listing flexibility.
- 2 sale attempts since 16y ago with the ask held roughly flat each time — persistent listings suggest the price (not the market) is what's stuck; bring a comps-based counter.
Risks & watch-outs
- Climate carrying-cost: severe wind risk, 99% chance of damaging wind over 30y; extreme-heat days projected 7→24/yr by 2055 (HVAC capex compounding) — expect insurance premiums to compound above CPI over the hold.
Questions for the listing agent
- What do current leases actually rent for vs. the listed asking? Can we see a recent rent roll and the last 12 months of T-12 income?
- It's been on market 64 days. Have you received any prior offers? Is the seller open to a 12% concession, seller financing, or rate buy-down credit?
- What does the HOA fee cover, when was the last increase, and are there any pending special assessments or reserve-fund shortfalls?
- Why hasn't it sold? Are there any deal-killer items the seller is aware of (foundation, flood, title, zoning, code violations)?
- Is there a deadline driving the sale (1031 exchange, divorce, estate, relocation)? That informs how much negotiation room exists.
- Schools are D-rated, which usually means shorter tenancies and higher turnover. Who's the typical renter profile here, and what's been the actual vacancy rate?
- Crime grade is F in this area — have there been break-ins, vandalism, or insurance claims at this property in the last 3 years? What carrier currently insures it and at what premium?
- The area grade is low — what's the realistic commute time and amenity access for the typical tenant pool here? Any planned neighborhood developments (good or bad) we should know about?
- What's the average days-on-market for RENTAL listings here right now (not sales)? A rising rental-DOM trend means longer vacancies and softer asking-rent achievability than the comps imply.
- What's the recent tenant-quality profile in this submarket — average credit score on applications, eviction rate, late-payment / NSF rate, and stable-employment percentage? A property-management company in the area should have these aggregated.
- How much new for-sale + rental construction is in the pipeline within 1–3 miles? Heavy new supply typically softens prices + rents 12–24 months out; constrained supply supports both.
Investment metrics
- 1% rule
- 0.90% ✗
- Cap rate
- 5.48%
- Cash-on-cash
- -2.89%
- DSCR
- 0.87
- GRM
- 9.2
CMA / ARV
- ARV (median comp)
- $216,881
- List price
- $199,000
- Delta
- -8.24%
- Verdict
- FAIR
- Comps
- 20 within 1.0 mi
Show comp detail 12 sales within ~0.75 mi
| Address | Dist | Beds/Ba | Sqft | Sold | Price | $/sf | Match |
|---|---|---|---|---|---|---|---|
| 12447 S Rachlin Cir | 0.14mi | 3/2.5 | 1,580 (-4%) | 1mo | $257,000 | $163 | 87 |
| 8727 Vinkins Rd | 0.07mi | 3/2.5 | 1,593 (-3%) | 11mo | $265,000 | $166 | 83 |
| 12418 S Garden St | 0.36mi | 3/2.0 | 1,695 (+4%) | 1mo | $155,000 | $91 | 75 |
| 8903 Aspen Place Dr | 0.60mi | 3/2.0 | 1,622 (-1%) | 2mo | $237,900 | $147 | 67 |
| 8751 E Rylander Cir | 0.14mi | 2/2.0 (-1) | 1,474 (-10%) | 7mo | $199,900 | $136 | 64 |
| 15426 W Ritter Cir | 0.70mi | 3/2.0 | 1,632 (-0%) | 3mo | $235,000 | $144 | 62 |
| 8906 Westplace Dr | 0.72mi | 3/2.0 | 1,622 (-1%) | 3mo | $260,000 | $160 | 60 |
| 8322 Sandy Glen Ln | 0.48mi | 3/2.0 | 1,819 (+11%) | 2mo | $159,000 | $87 | 55 |
| 8714 Dawnridge Dr | 0.56mi | 3/2.5 | 1,437 (-12%) | 2mo | $199,900 | $139 | 52 |
| 8538 Triple Crown Dr | 0.40mi | 3/2.0 | 1,838 (+12%) | 9mo | $239,000 | $130 | 52 |
| 8239 Twin Tree Ln | 0.43mi | 3/2.0 | 1,874 (+14%) | 3mo | $204,995 | $109 | 51 |
| 11806 Berry Place Dr | 0.68mi | 4/3.0 (+1) | 1,820 (+11%) | 6mo | $259,000 | $142 | 38 |
Match score weights: distance 35% · size 25% · config 20% · recency 20%. Top-matched comps best support the ARV.
Projected returns pro-forma
-0.73% appreciation · 0.0% rent growth · sell at horizon
- IRR
- -10.9%
- Equity multiple
- 0.53×
- Total profit
- $-26,186
- Equity at exit
- $50,652
- IRR
- -7.2%
- Equity multiple
- 0.38×
- Total profit
- $-34,799
- Equity at exit
- $55,452
Cash invested: $55,720 (down + closing). Projections, not guarantees.
Landlord ↔ Tenant lean methodology
- Overall (STATE)
- 87 Strongly Landlord-Friendly
- State Texas
- 87 Strongly Landlord-Friendly · R+5
- County
- — inherits STATE
- City
- — inherits STATE
ZIP-level market 77071
- Home prices YoY
- -0.3%
- Rents YoY
- -1.5%
- Active inventory
- 136
- Price-to-rent
- 9.2×
Monthly cashflow live
- Estimated rent
- $1,796 high interval (Pro) →
- Mortgage (P&I)
- −$1,044
- Tax from tax record
- −$378 /mo · $4,536/yr
- Insurance
- −$83
- HOA
- −$48
- Vacancy / Maint / Mgmt
- −$377
- Net cashflow
- $-134
Break-even live
Sensitivity live
| Price | -10% $-21 | -5% $-78 | +0% $-134 | +5% $-190 | +10% $-247 |
|---|---|---|---|---|---|
| Rent | -10% $-276 | -5% $-205 | +0% $-134 | +5% $-63 | +10% $8 |
| Rate | -1.0pp $-34 | -0.5pp $-83 | base $-134 | +0.5pp $-186 | +1.0pp $-238 |
UW: 25.0% down · 7.5% · 30yr · 1.5% tax · 5.0% vac · 8.0% maint · 8.0% mgmt
Financing live
Cash to close
- Down payment
- $49,750
- Closing costs
- $5,970
- Reserves months
- —
- Total cash needed
- —
Loan-product check · same deal, 3 products live
Conventional
25% down · 7.5% · 30yr
- Down + closing
- —
- Monthly P&I
- —
- Monthly cashflow
- —
- DSCR
- —
- Eligible?
- —
Personal DTI + credit; lowest rate.
DSCR
20% down · 8.5% · 30yr
- Down + closing
- —
- Monthly P&I
- —
- Monthly cashflow
- —
- DSCR
- —
- Eligible?
- —
No personal income docs; deal must DSCR.
Hard money
10% down · 12.0% · 12mo
- Down + closing
- —
- Monthly P&I
- —
- Monthly cashflow
- —
- DSCR
- —
- Eligible?
- —
Short-term bridge; refi at stabilization.
Rent comps 13 comps
| Address | Beds | Baths | Sqft | Rent | $/sqft | DOM | Units | Dist |
|---|---|---|---|---|---|---|---|---|
| 12463 Windy Wisp Ln Houston, TX | 3.0 | 2.0 | 1817 | $1,795 | $0.99 | 1d | 1 | 0.60mi |
| 12463 Windy Wisp Ln Houston, TX | 3.0 | 2.0 | 1817 | $1,795 | $0.99 | 4d | 1 | 0.60mi |
| 8978 Dawnridge Dr Houston, TX | 4.0 | 3.0 | 2160 | $2,100 | $0.97 | 0d | 1 | 0.60mi |
| 12706 Riceville School Rd Stafford, TX | 2.0 | 2.0 | 1235 | $1,570 | $1.27 | 45d | 1 | 0.62mi |
| 12700 Stafford Rd Stafford, TX | 1.0–2.0 | 1.0–2.0 | 993 | $1,601 | $1.61 | 0d | 12 | 0.66mi |
| 12660 Stafford Rd Stafford, TX | 1.0–3.0 | 1.0–2.0 | 1027 | $1,892 | $1.84 | 0d | 43 | 0.69mi |
| 12404 Riva Ridge Ln Houston, TX | 4.0 | 3.0 | 1679 | $1,750 | $1.04 | 45d | 1 | 0.96mi |
| 7842 Royan Dr Houston, TX | 3.0 | 2.5 | 2101 | $2,203 | $1.05 | 1d | 1 | 1.09mi |
| 8201 W Bellfort Ave Unit 510 Houston, TX | 3.0 | 2.0 | 1203 | $1,149 | $0.96 | 0d | 1 | 1.25mi |
| 8888 Benning Dr Houston, TX | 3.0 | 3.0 | 1472 | $1,750 | $1.19 | 45d | 1 | 1.33mi |
| 10965 S Gessner Rd Unit 1110 Houston, TX | 2.0 | 2.0 | 1322 | $1,229 | $0.93 | 26d | 1 | 1.45mi |
| 7809 Wolfield Ln Houston, TX | 2.0 | 2.0 | 1208 | $1,390 | $1.15 | 45d | 1 | 1.46mi |
| 12211 Fondren Rd Houston, TX | 1.0–2.0 | 1.0–2.0 | 817 | $1,235 | $1.51 | 0d | 21 | 1.49mi |
HOA detail
- Monthly dues
- $48 · $576/yr
Listing history 17 events
-
2026-06-21days on market $199,000 Active 64 DOM
-
2026-06-18days on market $199,000 Active 61 DOM
-
2026-06-17days on market $199,000 Active 60 DOM
-
2026-06-16days on market $199,000 Active 59 DOM
-
2026-06-15days on market $199,000 Active 58 DOM
-
2026-06-13days on market $199,000 Active 56 DOM
-
2026-06-10days on market $199,000 Active 52 DOM
-
2026-06-08days on market $199,000 Active 51 DOM
-
2026-06-07days on market $199,000 Active 50 DOM
-
2026-06-04days on market $199,000 Active 47 DOM
-
2026-06-01days on market $199,000 Active 44 DOM
-
2026-05-31days on market $199,000 Active 43 DOM
-
2026-04-18$199,000 Active 587-char remark
-
2010-05-18soldstatus 297-char remark
Show marketing remark (297 chars)
Great 3 bedroom, 2 1/2 bath home with formal dining, and parquet, carpet, and ceramic tile flooring. Well located, close to freeways, schools, and shopping centers. 1637 square feet - information is from the FHA appraisal and is deemed reliable but not guaranteed. Evidence of mold not remediated.
-
2010-04-21historical 297-char remark
Show marketing remark (297 chars)
Great 3 bedroom, 2 1/2 bath home with formal dining, and parquet, carpet, and ceramic tile flooring. Well located, close to freeways, schools, and shopping centers. 1637 square feet - information is from the FHA appraisal and is deemed reliable but not guaranteed. Evidence of mold not remediated.
-
2010-03-19$64,000 297-char remark
Show marketing remark (297 chars)
Great 3 bedroom, 2 1/2 bath home with formal dining, and parquet, carpet, and ceramic tile flooring. Well located, close to freeways, schools, and shopping centers. 1637 square feet - information is from the FHA appraisal and is deemed reliable but not guaranteed. Evidence of mold not remediated.
-
2000-11-22soldstatus
ⓘ Source: listings_history table (triggers on properties + properties_extension) + one-shot
backfill from property_details.listing_events for pre-trigger history.
Tax reassessment forecast TX · Resets to sale price
- Current annual tax
- $4,536 · $378/mo
- Projected year-2 tax
- $4,536 · $378/mo
- Expected delta
- $0/yr ($0/mo · 0.0%)
ⓘ Screening estimate from a state-policy table — verify with the county assessor before closing.
Climate risk First Street
- Flood 4/10 Moderate FEMA zone X (unshaded) · 22% chance over 30 yrs
- Wildfire 1/10 Low
- Heat 9/10 Extreme 7 d/yr ≥110°F today · 24 d/yr by 30 yrs out
- Wind 9/10 Extreme 99% chance of damaging wind over 30 yrs
- Air quality 3/10 Moderate 2 unhealthy d/yr today · 3 by 30 yrs out
Nearby sold comps map
Loading sold comps map…
Walkable amenities ~0.75 mi
Loading nearby amenities…
Taxation est. · year 1
- Rental income
- $21,547
- − Mortgage interest
- −$11,147
- − Property taxes
- −$4,536
- − Insurance
- −$995
- − Repairs & maintenance
- −$1,724
- − Management
- −$1,724
- − HOA
- −$576
- − Depreciation
- −$5,789
- Taxable loss
- −$4,944
- Est. tax savings @ 24.0%
- +$1,187
- After-tax cash flow
- $-422/yr
For passive investors: Depreciation is non-cash, so a rental often shows a tax loss while cash-flowing — sheltering income. Rental losses are passive: they offset passive income freely, and up to $25,000/yr can offset ordinary (W-2) income if you actively participate and your MAGI is under $100k (phasing out to $0 by $150k); unused losses carry forward. On sale, claimed depreciation is recaptured at up to 25%, and gains may owe capital-gains tax (a 1031 exchange can defer both). Figures are a year-1 estimate at your 24.0% rate — not tax advice; consult a CPA.
Schools (NCES district)
- District
- Houston ISD
- NCES district ID
- 4823640
- Math proficiency
- 27% ▼ -18.00%
- Reading proficiency
- 35% ▼ -6.00%
- Median HH income
- $46,054
- Composite
- 26.63/100
- National rank
- #7173
- State rank
- #593 of 826 in TX
Livability — Houston
- Score
- 74/100
- State rank
- #184
- US rank
- #4771
Category grades
Schools grade is shown separately in the Schools card above.
Census & demographics
- Census place
- Houston, TX
- County
- Harris County · 4,702,590 people
- City population
- 3,226,434
- Metro
- Houston-The Woodlands-Sugar Land, TX
- Population (ZIP)
- 27,056
- Household income
- $54,139
- Rent vs Own
- Severe rent burden
- 1242.0
Population outlook (Harris County) Hauer SSP2
- Today (2025)
- 5,571,493 people
- By 2030
- 6,089,821 · +9.3%
- By 2040
- 7,142,806 · +28.2%
- By 2050
- 8,185,864 · +46.9%
- By 2075
- 10,574,329 · +89.8%
- By 2100
- 12,109,958 · +117.4%
Race, ethnicity, and origin ACS 2023
- Neighborhood character
- Diverse neighborhood (Simpson 0.69)
- Race & ethnicity
- Black 46% Hispanic / Latino 26% White 17% Two or more races 8% Asian 7%
- Hispanic origin (detail)
- Mexican 13%
- Common ancestry
- Romanian 2% Scotch-Irish 1% Lithuanian 1%
- Foreign-born
- 33% · Canada, Vietnam, China
- Languages at home
- 58% English-only · Spanish 25% Vietnamese 3% Chinese 2%
Political lean MEDSL · Harris
- 2024 margin
- Lean D (+5.5) · D 52.0% · R 46.4% · Other 1.6%
- 2008→2024 swing
- +3.9pp toward D · 2008: 1.6pp · 2024: 5.5pp
- All cycles
- 2024: D+5.5 2020: D+13.3 2016: D+12.4 2012: D+0.1 2008: D+1.6
Not yet ingested
- Civics
- —
Market trends
- HPI YoY
- ▼ -0.73%
- Current HPI
- 250.0788
- Rent YoY
- ▼ -1.51%
- Metro
- Houston-The Woodlands-Sugar Land, TX
- State GDP YoY
- ▲ 3.95%
- F500 in state
- 110
Industry mix (Fortune 500 HQ in TX)
| Industry | F500 HQs | Revenue |
|---|---|---|
| Energy | 16 | $1,198B |
|
||
| Technology | 5 | $198B |
|
||
| Engineering / Construction | 4 | $72B |
|
||
| Energy Services | 3 | $60B |
|
||
| Utilities | 3 | $41B |
|
||
| Healthcare | 2 | $330B |
|
||
Price history
+210.9% since first listed5 events — show timeline
- 2026-04-18 Listed $199,000 HARMLS
- 2010-05-18 Sold (MLS) — HARMLS
- 2010-04-21 Listing Removed — HARMLS
- 2010-03-19 Listed $64,000 HARMLS
- 2000-11-22 Sold (Public Records) — Public Records
Property tax history
+5.3%/yrLatest (2025): $4,536 · -13.8% YoY. Source: county tax records.
Cash-flow waterfall
monthlySold comps — $/sqft
last 12 mo · ≤1 miLoading sold comps…