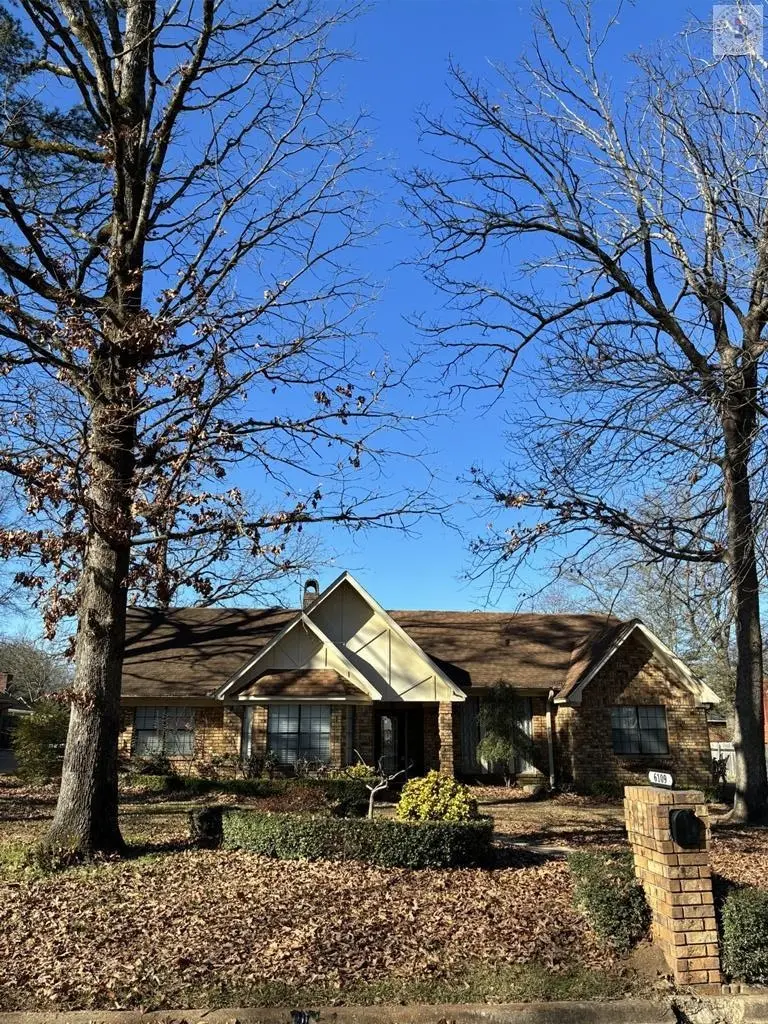
6109 Shadyside Ln · Texarkana, TX
Flood risk 1/10 · Minimal
- FEMA flood zone
- X (unshaded)
- Chance of flooding over 30 yrs
- 0.0%
- Est. flood insurance / yr
- $507 – $1,088
Fire risk 2/10 · Minimal
- Est. fire insurance / yr
- $1,222 – $2,270
Heat risk 7/10 · Major
- Hot days now (above 111°F)
- 7 days/yr
- Hot days in 30 yrs
- 22 days/yr
Wind risk 4/10 · Minor
- Chance of severe wind over 30 yrs
- 22.0%
Air-quality risk 2/10 · Minimal
- Unhealthy air days now
- 0 days/yr
- Unhealthy air days in 30 yrs
- 1 days/yr
Risk factors via First Street. Map © Google.
Why this score? — see what drove the D grade
The composite is a weighted blend of 9 inputs, each scored 0–100. Each bar is that input's sub-score; the figure is the points it added to the 100-point composite (weight × sub-score).
- ARV discount +13.1/15.0
- Cash flow +7.9/30.0
- Schools +5.6/10.0
- Livability +3.9/5.0
- 1% rule +3.6/10.0
- Rent growth +2.5/5.0
- Condition / age +2.5/5.0
- DSCR +2.0/10.0
- Appreciation +0.0/10.0
$249,900
🖨 Deal sheet 📄 Offer letter ✓ Due diligence
Listing remarks MLS
1982 Fixer Upper Traditional Home. .. 4 Bedrooms 2 Full Baths and 1/2 Bath. This Home was consistently a rental for numerous years. It has adequate square footage with Great Curb Appeal. Entry Way leads into Formal Living then pass thru Formal Dining Room to Galley Kitchen. Kitchen has Granite Counter Tops and Tiled Backsplash, Dishwasher, Cooktop, Built in Oven & Disposal. Laundry Room is Spacious & includes 1/2 Bath. Large Family Room with Fireplace. All Bedrooms are Good Sized. Long Driveway and Walkway. Needs some repairs and updates. Selling As Is.
Key facts
- Large family room
- Tiled backsplash
- Long driveway
Tags
Neighborhood map
What this means for you Summary
Snapshot
- This is a 4-bed/2.5-bath single-family listed at $250k.
Deal economics
- At list price, monthly cash flow is $-267 ($-3k/yr) — negative.
- To cash-flow at today's rent, offer at most $203k (18.8% below list).
- To meet the 1% rule (rent ≥ 1% of price), the offer needs to be $214k (14.3% below list).
- Recommended offer: $203k (18.8% below list) — sets the bar for cash-flow.
Location & tenants
- Location reads 77/100 on livability (#93 in TX, #3,241 nationally) — a middle-class / working-renter tenant base. Strengths: cost of living A+, housing A+, health & safety A+; Watch: amenities D+, schools D, crime D.
- Pleasant Grove ISD (urban): math 63% / reading 65% proficiency, ranked #30 of 826 in TX (top 4%) — acceptable for families but not a draw, mixed tenant base, ~2y average lease.
- Market conditions: 298 active listings in the ZIP; 5 comparable units currently listed for rent nearby; rentals lingering (median 44d on market — plan ~5-8 weeks vacancy on turnover, expect pricing pressure); 100% of comp listings sitting > 30 days — soft ceiling on asking rent; 137 units permitted in Bowie County in 2024 (5 in 5+ unit buildings).
- This rent runs 36% of the median local income ($72k/yr) — at the standard rent-burdened threshold; future hikes will face affordability resistance.
Forward outlook
- Local home prices are declining (-3.0%/yr); year-one equity from $2k of loan paydown is wiped out by about $7k of value loss. Plan a longer hold.
Negotiation context
- It's been on market 141 days — a 12% lower offer ($220k) is reasonable based on typical stale-listing flexibility.
Risks & watch-outs
- Watch-outs: property tax is 2.6% of price.
- Climate carrying-cost: extreme-heat days projected 7→22/yr by 2055 (HVAC capex compounding) — expect insurance premiums to compound above CPI over the hold.
Questions for the listing agent
- What do current leases actually rent for vs. the listed asking? Can we see a recent rent roll and the last 12 months of T-12 income?
- It's been on market 141 days. Have you received any prior offers? Is the seller open to a 19% concession, seller financing, or rate buy-down credit?
- Property tax is high relative to price — has the assessment been appealed recently, and will the sale trigger a re-assessment?
- Why hasn't it sold? Are there any deal-killer items the seller is aware of (foundation, flood, title, zoning, code violations)?
- Is there a deadline driving the sale (1031 exchange, divorce, estate, relocation)? That informs how much negotiation room exists.
- Schools are D-rated, which usually means shorter tenancies and higher turnover. Who's the typical renter profile here, and what's been the actual vacancy rate?
- Crime grade is D in this area — have there been break-ins, vandalism, or insurance claims at this property in the last 3 years? What carrier currently insures it and at what premium?
- The area grade is low — what's the realistic commute time and amenity access for the typical tenant pool here? Any planned neighborhood developments (good or bad) we should know about?
- What's the average days-on-market for RENTAL listings here right now (not sales)? A rising rental-DOM trend means longer vacancies and softer asking-rent achievability than the comps imply.
- What's the recent tenant-quality profile in this submarket — average credit score on applications, eviction rate, late-payment / NSF rate, and stable-employment percentage? A property-management company in the area should have these aggregated.
- How much new for-sale + rental construction is in the pipeline within 1–3 miles? Heavy new supply typically softens prices + rents 12–24 months out; constrained supply supports both.
Investment metrics
- 1% rule
- 0.86% ✗
- Cap rate
- 5.01%
- Cash-on-cash
- -4.57%
- DSCR
- 0.80
- GRM
- 9.7
CMA / ARV
- ARV (median comp)
- $285,529
- List price
- $249,900
- Delta
- -12.48%
- Verdict
- UNDERPRICED
- Comps
- 12 within 1.0 mi
Show comp detail 2 sales within ~0.75 mi
| Address | Dist | Beds/Ba | Sqft | Sold | Price | $/sf | Match |
|---|---|---|---|---|---|---|---|
| 6005 Stoneridge Dr | 0.16mi | 3/3.0 (-1) | 2,788 (+5%) | 3mo | $420,000 | $151 | 75 |
| 3108 Crestridge Dr | 0.65mi | 3/2.0 (-1) | 2,346 (-12%) | 4mo | $212,000 | $90 | 39 |
Match score weights: distance 35% · size 25% · config 20% · recency 20%. Top-matched comps best support the ARV.
Projected returns pro-forma
-3.0% appreciation · 3.0% rent growth · sell at horizon
- IRR
- -23.9%
- Equity multiple
- 0.18×
- Total profit
- $-57,295
- Equity at exit
- $37,261
- IRR
- -18.8%
- Equity multiple
- -0.02×
- Total profit
- $-71,040
- Equity at exit
- $21,607
Cash invested: $69,972 (down + closing). Projections, not guarantees.
Landlord ↔ Tenant lean methodology
- Overall (STATE)
- 87 Strongly Landlord-Friendly
- State Texas
- 87 Strongly Landlord-Friendly · R+5
- County
- — inherits STATE
- City
- — inherits STATE
ZIP-level market 75503
- Home prices YoY
- -21.0%
- Active inventory
- 298
- Price-to-rent
- 9.7×
Monthly cashflow live
- Estimated rent
- $2,142 high interval (Pro) →
- Mortgage (P&I)
- −$1,311
- Tax from tax record
- −$544 /mo · $6,530/yr
- Insurance
- −$104
- HOA
- −$0
- Vacancy / Maint / Mgmt
- −$450
- Net cashflow
- $-267
Break-even live
UW: 25.0% down · 7.5% · 30yr · 1.5% tax · 5.0% vac · 8.0% maint · 8.0% mgmt
Financing live
Cash to close
- Down payment
- $62,475
- Closing costs
- $7,497
- Reserves months
- —
- Total cash needed
- —
Loan-product check · same deal, 3 products live
Conventional
25% down · 7.5% · 30yr
- Down + closing
- —
- Monthly P&I
- —
- Monthly cashflow
- —
- DSCR
- —
- Eligible?
- —
Personal DTI + credit; lowest rate.
DSCR
20% down · 8.5% · 30yr
- Down + closing
- —
- Monthly P&I
- —
- Monthly cashflow
- —
- DSCR
- —
- Eligible?
- —
No personal income docs; deal must DSCR.
Hard money
10% down · 12.0% · 12mo
- Down + closing
- —
- Monthly P&I
- —
- Monthly cashflow
- —
- DSCR
- —
- Eligible?
- —
Short-term bridge; refi at stabilization.
Rent comps 5 comps
| Address | Beds | Baths | Sqft | Rent | $/sqft | DOM | Units | Dist |
|---|---|---|---|---|---|---|---|---|
| 3 Sidney Dr Texarkana, TX | 3.0 | 2.0 | 1951 | $1,950 | $1.00 | 43d | 1 | 0.52mi |
| 3808 Moores Ln Texarkana, TX | 4.0 | 2.0 | 2617 | $2,400 | $0.92 | 43d | 1 | 0.52mi |
| 3320 Robin Ln Unit 12 Texarkana, TX | 3.0 | 2.5 | 2704 | $1,599 | $0.59 | 43d | 1 | 0.80mi |
| 7 Fernwood Dr Unit A Texarkana, TX | 4.0 | 2.0 | 2087 | $3,249 | $1.56 | 43d | 1 | 1.25mi |
| 2 Fernwood Dr Unit A Texarkana, TX | 4.0 | 3.5 | 2041 | $2,200 | $1.08 | 43d | 1 | 1.31mi |
Listing history 23 events
-
2026-06-19days on market $249,900 Active 141 DOM
-
2026-06-18days on market $249,900 Active 140 DOM
-
2026-06-17days on market $249,900 Active 139 DOM
-
2026-06-16days on market $249,900 Active 138 DOM
-
2026-06-15days on market $249,900 Active 137 DOM
-
2026-06-14days on market $249,900 Active 135 DOM
-
2026-06-13days on market $249,900 Active 134 DOM
-
2026-06-10days on market $249,900 Active 132 DOM
-
2026-06-09days on market $249,900 Active 131 DOM
-
2026-06-09price $249,900 Active 130 DOM
-
2026-06-08days on market $269,900 Active 130 DOM
-
2026-06-07days on market $269,900 Active 129 DOM
-
2026-06-05days on market $269,900 Active 126 DOM
-
2026-06-03days on market $269,900 Active 125 DOM
-
2026-06-02days on market $269,900 Active 124 DOM
-
2026-06-01days on market $269,900 Active 123 DOM
-
2026-05-31days on market $269,900 Active 122 DOM
-
2026-05-30days on market $269,900 Active 121 DOM
-
2026-05-09status Pending 571-char remark
Show marketing remark (571 chars)
1982 Fixer Upper Traditional Home. .. 4 Bedrooms 2 Full Baths and 1/2 Bath. This Home was consistently a rental for numerous years. It has adequate square footage with Great Curb Appeal. Entry Way leads into Formal Living then pass thru Formal Dining Room to Galley Kitchen. Kitchen has Granite Counter Tops and Tiled Backsplash, Dishwasher, Cooktop, Built in Oven & Disposal. Laundry Room is Spacious & includes 1/2 Bath. Large Family Room with Fireplace. All Bedrooms are Good Sized. Long Driveway and Walkway. Needs some repairs and updates. Selling As Is.
-
2026-05-04price $269,900 571-char remark
Show marketing remark (571 chars)
1982 Fixer Upper Traditional Home. .. 4 Bedrooms 2 Full Baths and 1/2 Bath. This Home was consistently a rental for numerous years. It has adequate square footage with Great Curb Appeal. Entry Way leads into Formal Living then pass thru Formal Dining Room to Galley Kitchen. Kitchen has Granite Counter Tops and Tiled Backsplash, Dishwasher, Cooktop, Built in Oven & Disposal. Laundry Room is Spacious & includes 1/2 Bath. Large Family Room with Fireplace. All Bedrooms are Good Sized. Long Driveway and Walkway. Needs some repairs and updates. Selling As Is.
-
2026-04-27price $279,900 571-char remark
Show marketing remark (571 chars)
1982 Fixer Upper Traditional Home. .. 4 Bedrooms 2 Full Baths and 1/2 Bath. This Home was consistently a rental for numerous years. It has adequate square footage with Great Curb Appeal. Entry Way leads into Formal Living then pass thru Formal Dining Room to Galley Kitchen. Kitchen has Granite Counter Tops and Tiled Backsplash, Dishwasher, Cooktop, Built in Oven & Disposal. Laundry Room is Spacious & includes 1/2 Bath. Large Family Room with Fireplace. All Bedrooms are Good Sized. Long Driveway and Walkway. Needs some repairs and updates. Selling As Is.
-
2026-01-14$289,900 Active 571-char remark
Show marketing remark (571 chars)
1982 Fixer Upper Traditional Home. .. 4 Bedrooms 2 Full Baths and 1/2 Bath. This Home was consistently a rental for numerous years. It has adequate square footage with Great Curb Appeal. Entry Way leads into Formal Living then pass thru Formal Dining Room to Galley Kitchen. Kitchen has Granite Counter Tops and Tiled Backsplash, Dishwasher, Cooktop, Built in Oven & Disposal. Laundry Room is Spacious & includes 1/2 Bath. Large Family Room with Fireplace. All Bedrooms are Good Sized. Long Driveway and Walkway. Needs some repairs and updates. Selling As Is.
-
1997-03-01soldstatus
ⓘ Source: listings_history table (triggers on properties + properties_extension) + one-shot
backfill from property_details.listing_events for pre-trigger history.
Tax reassessment forecast TX · Resets to sale price
- Current annual tax
- $6,530 · $544/mo
- Projected year-2 tax
- $6,530 · $544/mo
- Expected delta
- $0/yr ($0/mo · 0.0%)
ⓘ Screening estimate from a state-policy table — verify with the county assessor before closing.
Climate risk First Street
- Flood 1/10 Low FEMA zone X (unshaded) · 0% chance over 30 yrs
- Wildfire 2/10 Low
- Heat 7/10 Severe 7 d/yr ≥111°F today · 22 d/yr by 30 yrs out
- Wind 4/10 Moderate 22% chance of damaging wind over 30 yrs
- Air quality 2/10 Low 0 unhealthy d/yr today · 1 by 30 yrs out
Nearby sold comps map
Loading sold comps map…
Walkable amenities ~0.75 mi
Loading nearby amenities…
Taxation est. · year 1
- Rental income
- $25,705
- − Mortgage interest
- −$13,998
- − Property taxes
- −$6,530
- − Insurance
- −$1,250
- − Repairs & maintenance
- −$2,056
- − Management
- −$2,056
- − Depreciation
- −$7,270
- Taxable loss
- −$7,455
- Est. tax savings @ 24.0%
- +$1,789
- After-tax cash flow
- $-1,409/yr
For passive investors: Depreciation is non-cash, so a rental often shows a tax loss while cash-flowing — sheltering income. Rental losses are passive: they offset passive income freely, and up to $25,000/yr can offset ordinary (W-2) income if you actively participate and your MAGI is under $100k (phasing out to $0 by $150k); unused losses carry forward. On sale, claimed depreciation is recaptured at up to 25%, and gains may owe capital-gains tax (a 1031 exchange can defer both). Figures are a year-1 estimate at your 24.0% rate — not tax advice; consult a CPA.
Schools (NCES district)
- District
- Pleasant Grove ISD
- NCES district ID
- 4835130
- Math proficiency
- 63% ▲ 3.00%
- Reading proficiency
- 65% ▲ 6.00%
- Median HH income
- $69,316
- Composite
- 56.24/100
- National rank
- #1175
- State rank
- #30 of 826 in TX
Livability — Texarkana
- Score
- 77/100
- State rank
- #93
- US rank
- #3241
Category grades
Schools grade is shown separately in the Schools card above.
Census & demographics
- Census place
- Texarkana, TX
- County
- Bowie County · 61,238 people
- City population
- 61,238
- Metro
- Texarkana, TX-AR
- Population (ZIP)
- 26,372
- Household income
- $72,159
- Rent vs Own
- Severe rent burden
- 773.0
Population outlook (Bowie County) Hauer SSP2
- Today (2025)
- 94,699 people
- By 2030
- 94,824 · +0.1%
- By 2040
- 94,870 · +0.2%
- By 2050
- 93,686 · -1.1%
- By 2075
- 90,082 · -4.9%
- By 2100
- 76,579 · -19.1%
Race, ethnicity, and origin ACS 2023
- Neighborhood character
- Majority White (63%)
- Race & ethnicity
- White 63% Black 23% Hispanic / Latino 7% Two or more races 5% Asian 3%
- Hispanic origin (detail)
- Mexican 6%
- Common ancestry
- Slovak 2% Serbian 1% Lithuanian 1%
- Foreign-born
- 5% · Canada, Vietnam, South Korea
- Languages at home
- 92% English-only · Spanish 6% Other Indo-European 1%
Political lean MEDSL · Bowie
- 2024 margin
- Solid R (+48.7) · D 25.3% · R 74.0%
- 2008→2024 swing
- -10.8pp toward R · 2008: -37.9pp · 2024: -48.7pp
- All cycles
- 2024: R+48.7 2020: R+42.8 2016: R+46.6 2012: R+41.5 2008: R+37.9
Not yet ingested
- Civics
- —
Market trends
- HPI YoY
- ▼ -48.09%
- Current HPI
- 181.3052
- Rent YoY
- —
- Metro
- Texarkana, TX-AR
- State GDP YoY
- ▲ 3.95%
- F500 in state
- 110
Industry mix (Fortune 500 HQ in TX)
| Industry | F500 HQs | Revenue |
|---|---|---|
| Energy | 16 | $1,198B |
|
||
| Technology | 5 | $198B |
|
||
| Engineering / Construction | 4 | $72B |
|
||
| Energy Services | 3 | $60B |
|
||
| Utilities | 3 | $41B |
|
||
| Healthcare | 2 | $330B |
|
||
Price history
-6.9% since first listed5 events — show timeline
- 2026-05-09 Pending — TBOR
- 2026-05-04 Price Changed $269,900 TBOR
- 2026-04-27 Price Changed $279,900 TBOR
- 2026-01-14 Listed $289,900 TBOR
- 1997-03-01 Sold (Public Records) — Public Records
Property tax history
+3.2%/yrLatest (2025): $6,530 · +7.6% YoY. Source: county tax records.
Cash-flow waterfall
monthlySold comps — $/sqft
last 12 mo · ≤1 miLoading sold comps…