15491 Eve Dr · Pymatuning North, PA
Flood risk 1/10 · Minimal
- FEMA flood zone
- X (unshaded)
- Chance of flooding over 30 yrs
- 0.0%
- Est. flood insurance / yr
- $473 – $860
Fire risk 1/10 · Minimal
- Est. fire insurance / yr
- $511 – $949
Heat risk 2/10 · Minimal
- Hot days now (above 95°F)
- 7 days/yr
- Hot days in 30 yrs
- 17 days/yr
Wind risk 1/10 · Minimal
- Chance of severe wind over 30 yrs
- —
Air-quality risk 2/10 · Minimal
- Unhealthy air days now
- 1 days/yr
- Unhealthy air days in 30 yrs
- 3 days/yr
Risk factors via First Street. Map © Google.
Why this score? — see what drove the D grade
The composite is a weighted blend of 9 inputs, each scored 0–100. Each bar is that input's sub-score; the figure is the points it added to the 100-point composite (weight × sub-score).
- Appreciation +9.2/10.0
- Cash flow +7.9/30.0
- ARV discount +7.5/15.0
- Schools +4.0/10.0
- Livability +2.9/5.0
- Rent growth +2.5/5.0
- Condition / age +2.5/5.0
- 1% rule +2.1/10.0
- DSCR +1.9/10.0
$215,000
🖨 Deal sheet (PDF) 📄 Offer letter ✓ Due diligence
Listing remarks
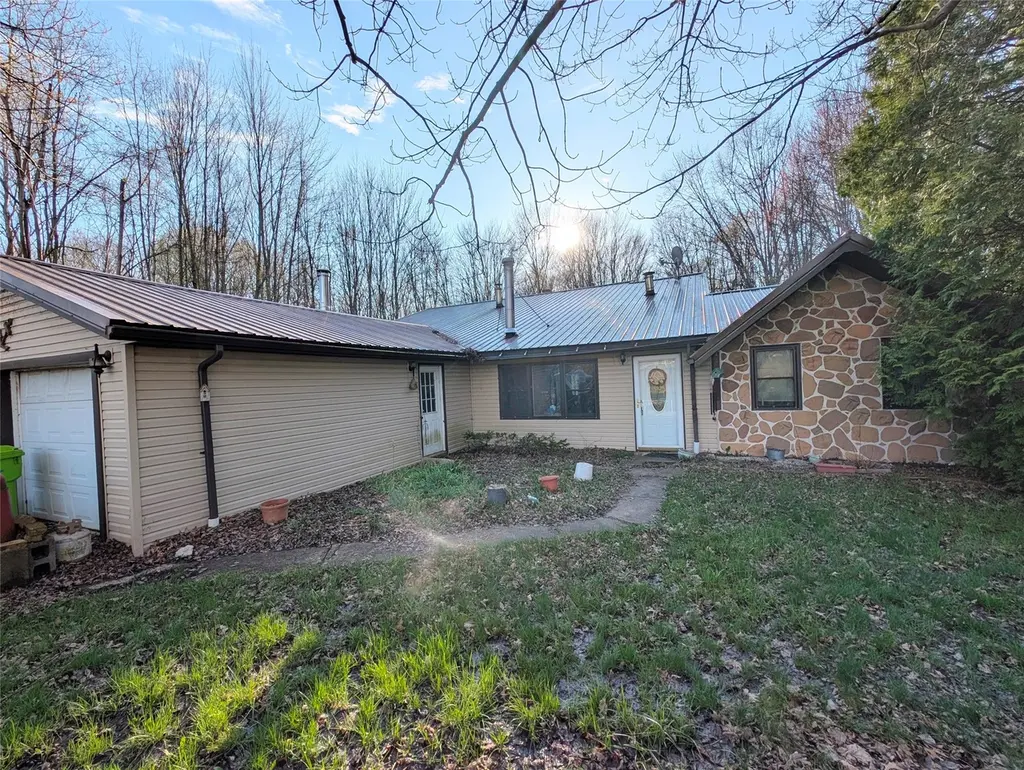
Secluded 1.5-story home nestled on 4.5 acres and bordering Pymatuning State Park on the north shore of the lake. This 3-bedroom, 2 full bath property offers the perfect setting for a lake retreat or year-round country living. Just minutes from Wilson and Alcatraz - a fisherman's paradise! Allotment residents have their own private lake access. Enjoy flexible heating options with both wood stoves and an oil furnace. The attached 3-bay garage provides ample space for vehicles, hobbies, and storage, while the oversized carport is ideal for a boat or RV. Inside, you'll find a bonus pantry for additional storage and a dedicated bar area, perfect for entertaining. On the second floor, you'll find
Key facts
- Lake retreat
- Wood stoves
- Oil furnace
Tags
Property features AI
Exterior
- Parking: Attached 3-car garage
- Utilities: Private water; Private sewer
- Home design: Single family residence; One and one-half stories
- Construction: Frame construction; Metal roof
- Exterior features: Secluded lot; Dirt road access
Interior
- Kitchen: Dishwasher
- Flooring: Hardwood floors; Tile floors
- Bathrooms: 2 full bathrooms
- Heating & cooling: Has heating (see remarks)
- Interior features: Decorative fireplace (1); Dishwasher; Crawl space basement
Neighborhood map
What this means for you Summary
Snapshot
- This is a 3-bed/2.0-bath single-family listed at $215k.
Deal economics
- At list price, monthly cash flow is $-232 ($-3k/yr) — negative.
- To cash-flow at today's rent, offer at most $174k (19.1% below list).
- To meet the 1% rule (rent ≥ 1% of price), the offer needs to be $153k (28.7% below list).
- Recommended offer: $153k (28.7% below list) — sets the bar for 1% rule.
Location & tenants
- Location reads 58/100 on livability (#1,568 in PA) — a working-class tenant base; expect higher turnover. Strengths: cost of living A+, housing A+; Watch: health & safety D, amenities F, commute F.
- Conneaut SD (rural): math 38% / reading 57% proficiency, ranked #241 of 539 in PA (top 45%) — families likely to look elsewhere, expect single-tenant / working-renter base with shorter leases.
- Zoned schools: Conneaut Valley El Sch (math 57% / reading 62%, grade B-, #377 of 1,518 statewide, top 28%, 316 students, 100% FRL); Conneaut Valley Ms (math 29% / reading 58%, grade D, #208 of 512 statewide, top 41%, 259 students, 100% FRL); Conneaut Area Senior High (math 95% / reading 24%, grade C+, #79 of 437 statewide, top 18%, 579 students, 80% FRL) — zoned schools average 93% FRL vs 44% district-wide (50 pts higher); higher-poverty schools than district average — tighter screening recommended.
- Market conditions: 53 active listings in the ZIP; 83 units permitted in Crawford County in 2024 (0 in 5+ unit buildings).
Forward outlook
- In year one you build about $20k of equity ($1k loan paydown + $18k appreciation (8.5% local appreciation)).
- Crawford County population projected at -22% by 2050 — secular population decline; favor cash flow + early exit over multi-decade hold.
- By year 2, paydown + projected appreciation supports a ~$32k cash-out refi (75% LTV) — recoverable capital for the next deal without selling this one.
Negotiation context
- It's been on market 16 days — a 2% lower offer ($212k) is reasonable based on typical stale-listing flexibility.
Questions for the listing agent
- What do current leases actually rent for vs. the listed asking? Can we see a recent rent roll and the last 12 months of T-12 income?
- Built in 1969 — when were the roof, HVAC, electrical panel, plumbing, and water heater last replaced?
- Is there a deadline driving the sale (1031 exchange, divorce, estate, relocation)? That informs how much negotiation room exists.
- Schools are F-rated, which usually means shorter tenancies and higher turnover. Who's the typical renter profile here, and what's been the actual vacancy rate?
- The area grade is low — what's the realistic commute time and amenity access for the typical tenant pool here? Any planned neighborhood developments (good or bad) we should know about?
- What's the average days-on-market for RENTAL listings here right now (not sales)? A rising rental-DOM trend means longer vacancies and softer asking-rent achievability than the comps imply.
- What's the recent tenant-quality profile in this submarket — average credit score on applications, eviction rate, late-payment / NSF rate, and stable-employment percentage? A property-management company in the area should have these aggregated.
- How much new for-sale + rental construction is in the pipeline within 1–3 miles? Heavy new supply typically softens prices + rents 12–24 months out; constrained supply supports both.
Investment metrics
- 1% rule
- 0.71% ✗
- Cap rate
- 5.00%
- Cash-on-cash
- -4.63%
- DSCR
- 0.79
- GRM
- 11.7
CMA / ARV
No comps found within radius.
Projected returns pro-forma
8.48% appreciation · 3.0% rent growth · sell at horizon
- IRR
- 17.6%
- Equity multiple
- 2.34×
- Total profit
- $80,468
- Equity at exit
- $170,480
- IRR
- 16.7%
- Equity multiple
- 5.07×
- Total profit
- $244,934
- Equity at exit
- $345,447
Cash invested: $60,200 (down + closing). Projections, not guarantees.
Landlord ↔ Tenant lean methodology
- Overall (STATE)
- 62 Landlord-Friendly
- State Pennsylvania
- 62 Landlord-Friendly · EVEN
- County
- — inherits STATE
- City
- — inherits STATE
ZIP-level market 16424
- Home prices YoY
- 3.2%
- Active inventory
- 53
- Price-to-rent
- 11.7×
Monthly cashflow live
- Estimated rent
- $1,533 medium interval (Pro) →
- Mortgage (P&I)
- −$1,127
- Tax from tax record
- −$226 /mo · $2,718/yr
- Insurance
- −$90
- HOA
- −$0
- Vacancy / Maint / Mgmt
- −$322
- Net cashflow
- $-232
Break-even live
Sensitivity live
| Price | -10% $-111 | -5% $-172 | +0% $-232 | +5% $-293 | +10% $-354 |
|---|---|---|---|---|---|
| Rent | -10% $-354 | -5% $-293 | +0% $-232 | +5% $-172 | +10% $-111 |
| Rate | -1.0pp $-124 | -0.5pp $-178 | base $-232 | +0.5pp $-288 | +1.0pp $-345 |
UW: 25.0% down · 7.5% · 30yr · 1.5% tax · 5.0% vac · 8.0% maint · 8.0% mgmt
Financing live
Cash to close
- Down payment
- $53,750
- Closing costs
- $6,450
- Reserves months
- —
- Total cash needed
- —
Loan-product check · same deal, 3 products live
Conventional
25% down · 7.5% · 30yr
- Down + closing
- —
- Monthly P&I
- —
- Monthly cashflow
- —
- DSCR
- —
- Eligible?
- —
Personal DTI + credit; lowest rate.
DSCR
20% down · 8.5% · 30yr
- Down + closing
- —
- Monthly P&I
- —
- Monthly cashflow
- —
- DSCR
- —
- Eligible?
- —
No personal income docs; deal must DSCR.
Hard money
10% down · 12.0% · 12mo
- Down + closing
- —
- Monthly P&I
- —
- Monthly cashflow
- —
- DSCR
- —
- Eligible?
- —
Short-term bridge; refi at stabilization.
Listing history 2 events
-
2026-05-02status Pending
-
2026-04-13$215,000 Active
ⓘ Source: listings_history table (triggers on properties + properties_extension) + one-shot
backfill from property_details.listing_events for pre-trigger history.
Tax reassessment forecast PA · Partial reset (capped growth)
- Current annual tax
- $2,718 · $226/mo
- Projected year-2 tax
- $3,057 · $255/mo
- Expected delta
- +$340/yr (+$28/mo · 12.5%)
ⓘ Screening estimate from a state-policy table — verify with the county assessor before closing.
Climate risk First Street
- Flood 1/10 Low FEMA zone X (unshaded) · 0% chance over 30 yrs
- Wildfire 1/10 Low
- Heat 2/10 Low 7 d/yr ≥95°F today · 17 d/yr by 30 yrs out
- Wind 1/10 Low
- Air quality 2/10 Low 1 unhealthy d/yr today · 3 by 30 yrs out
Nearby sold comps map
Loading sold comps map…
Walkable amenities ~0.75 mi
Loading nearby amenities…
Taxation est. · year 1
- Rental income
- $18,396
- − Mortgage interest
- −$12,043
- − Property taxes
- −$2,718
- − Insurance
- −$1,075
- − Repairs & maintenance
- −$1,472
- − Management
- −$1,472
- − Depreciation
- −$6,255
- Taxable loss
- −$6,638
- Est. tax savings @ 24.0%
- +$1,593
- After-tax cash flow
- $-1,197/yr
For passive investors: Depreciation is non-cash, so a rental often shows a tax loss while cash-flowing — sheltering income. Rental losses are passive: they offset passive income freely, and up to $25,000/yr can offset ordinary (W-2) income if you actively participate and your MAGI is under $100k (phasing out to $0 by $150k); unused losses carry forward. On sale, claimed depreciation is recaptured at up to 25%, and gains may owe capital-gains tax (a 1031 exchange can defer both). Figures are a year-1 estimate at your 24.0% rate — not tax advice; consult a CPA.
Schools (NCES district)
- District
- Conneaut SD
- NCES district ID
- 4206590
- Math proficiency
- 38% ▼ -7.00%
- Reading proficiency
- 57% ▼ -7.00%
- Median HH income
- $43,946
- Composite
- 40.06/100
- National rank
- #3813
- State rank
- #241 of 539 in PA
Livability — Pymatuning North
- Score
- 58/100
- State rank
- #1568
- US rank
- #20867
Category grades
Schools grade is shown separately in the Schools card above.
Census & demographics
- Census place
- Pymatuning North, PA
- Population (ZIP)
- 4,328
Population outlook (Crawford County) Hauer SSP2
- Today (2025)
- 81,399 people
- By 2030
- 77,977 · -4.2%
- By 2040
- 70,659 · -13.2%
- By 2050
- 63,841 · -21.6%
- By 2075
- 50,198 · -38.3%
- By 2100
- 37,898 · -53.4%
Race, ethnicity, and origin ACS 2023
- Neighborhood character
- Predominantly White (95%)
- Race & ethnicity
- White 95% Two or more races 4% Hispanic / Latino 2%
- Common ancestry
- Romanian 4% Lithuanian 2% Slovak 2%
- Foreign-born
- 1% · Canada
- Languages at home
- 96% English-only · German/W. Germanic 3% Spanish 1%
Political lean MEDSL · Crawford
- 2024 margin
- Solid R (+39.2) · D 30.0% · R 69.2%
- 2008→2024 swing
- -28.8pp toward R · 2008: -10.4pp · 2024: -39.2pp
- All cycles
- 2024: R+39.2 2020: R+37.2 2016: R+38.5 2012: R+19.6 2008: R+10.4
Not yet ingested
- Civics
- —
Market trends
- HPI YoY
- ▲ 8.48%
- Current HPI
- 276.8388
- Rent YoY
- —
- Metro
- —
- State GDP YoY
- ▲ 1.68%
- F500 in state
- 34
Industry mix (Fortune 500 HQ in PA)
| Industry | F500 HQs | Revenue |
|---|---|---|
| Healthcare | 2 | $309B |
|
||
| Insurance | 2 | $27B |
|
||
| Telecommunications / Media | 1 | $124B |
|
||
| Industrial Distribution | 1 | $22B |
|
||
| Financial Services | 1 | $20B |
|
||
| Chemicals / Materials | 1 | $18B |
|
||
Price history
2 events — show timeline
- 2026-05-02 Pending — GEBOR
- 2026-04-13 Listed $215,000 GEBOR
Property tax history
+1.0%/yrLatest (2025): $2,718 · +0.0% YoY. Source: county tax records.
Cash-flow waterfall
monthlySold comps — $/sqft
last 12 mo · ≤1 miLoading sold comps…