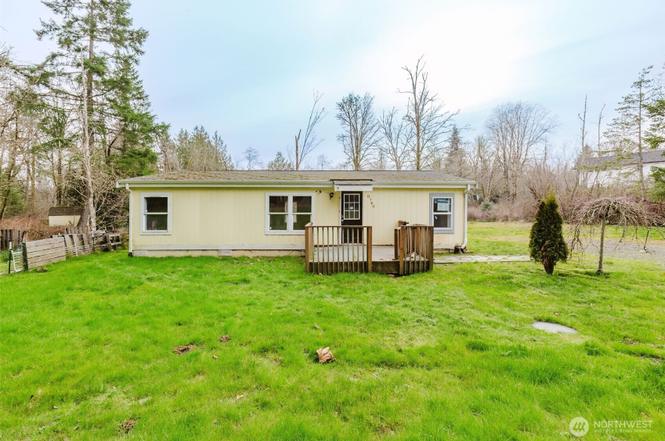
8740 SE Yeshua Ln · Southworth, WA
Flood risk 1/10 · Minimal
- FEMA flood zone
- X (unshaded)
- Chance of flooding over 30 yrs
- 0.0%
- Est. flood insurance / yr
- $507 – $1,088
Fire risk 2/10 · Minimal
- Est. fire insurance / yr
- $604 – $1,122
Heat risk 3/10 · Minor
- Hot days now (above 86°F)
- 7 days/yr
- Hot days in 30 yrs
- 15 days/yr
Wind risk 1/10 · Minimal
- Chance of severe wind over 30 yrs
- —
Air-quality risk 6/10 · Moderate
- Unhealthy air days now
- 8 days/yr
- Unhealthy air days in 30 yrs
- 9 days/yr
Risk factors via First Street. Map © Google.
Why this score? — see what drove the C- grade
The composite is a weighted blend of 9 inputs, each scored 0–100. Each bar is that input's sub-score; the figure is the points it added to the 100-point composite (weight × sub-score).
- Cash flow +20.4/30.0
- ARV discount +7.5/15.0
- DSCR +6.5/10.0
- Schools +5.2/10.0
- 1% rule +4.8/10.0
- Livability +3.3/5.0
- Rent growth +2.9/5.0
- Condition / age +2.5/5.0
- Appreciation +0.0/10.0
$279,000
🖨 Deal sheet (PDF) 📄 Offer letter ✓ Due diligence
Listing remarks
Situated on 1.24 acres, this 3Bdrm/2bath home offers space, privacy, and a chance to add your own improvements. The open floor plan features vaulted ceilings and good natural light, creating a functional layout with potential to personalize. Existing features includes an efficient ductless heating system. The property is surrounded by trees for a peaceful, private feel, yet is conveniently located just minutes from the Southworth Ferry & schools. HUD home, sold "as-is".
Key facts
- 1.24 acres
- Surrounded by trees
- Minutes from schools
Tags
Neighborhood map
What this means for you Summary
Snapshot
- This is a 3-bed/2.0-bath manufactured listed at $279k.
Deal economics
- At list price, monthly cash flow is $362 ($4k/yr) — positive.
- The deal already cash-flows at list — no discount required.
- To meet the 1% rule (rent ≥ 1% of price), the offer needs to be $274k (1.6% below list).
- Recommended offer: $274k (1.6% below list) — sets the bar for 1% rule.
Location & tenants
- Location reads 66/100 on livability (#317 in WA) — a middle-class / working-renter tenant base. Strengths: crime A+, employment A+, housing A+; Watch: health & safety C-, amenities F, commute F.
- South Kitsap School District (suburban): math 52% / reading 64% proficiency, ranked #71 of 291 in WA (top 24%) — acceptable for families but not a draw, mixed tenant base, ~2y average lease.
- Zoned schools: South Colby Elementary (290 students, 32% FRL); South Kitsap High School (2,389 students, 40% FRL).
- Market conditions: Rents rising (+1.6%/yr); 356 active listings in the ZIP; high-income renter base; 1,294 units permitted in Kitsap County in 2024 (302 in 5+ unit buildings).
Forward outlook
- Local home prices are declining (-3.0%/yr); year-one equity from $2k of loan paydown is wiped out by about $8k of value loss. Plan a longer hold.
- Kitsap County population projected at +8% by 2050 — modest demand growth; plan on rents tracking national, not racing it.
Negotiation context
- It's been on market 18 days — a 2% lower offer ($275k) is reasonable based on typical stale-listing flexibility.
- 10 sale attempts since 19y ago with the ask held roughly flat each time — persistent listings suggest the price (not the market) is what's stuck; bring a comps-based counter.
Questions for the listing agent
- Is there a deadline driving the sale (1031 exchange, divorce, estate, relocation)? That informs how much negotiation room exists.
- What's the average days-on-market for RENTAL listings here right now (not sales)? A rising rental-DOM trend means longer vacancies and softer asking-rent achievability than the comps imply.
- What's the recent tenant-quality profile in this submarket — average credit score on applications, eviction rate, late-payment / NSF rate, and stable-employment percentage? A property-management company in the area should have these aggregated.
- How much new for-sale + rental construction is in the pipeline within 1–3 miles? Heavy new supply typically softens prices + rents 12–24 months out; constrained supply supports both.
Investment metrics
- 1% rule
- 0.98% ✗
- Cap rate
- 7.85%
- Cash-on-cash
- 5.56%
- DSCR
- 1.25
- GRM
- 8.5
CMA / ARV
No comps found within radius.
Projected returns pro-forma
-3.0% appreciation · 1.6% rent growth · sell at horizon
- IRR
- -9.2%
- Equity multiple
- 0.67×
- Total profit
- $-25,984
- Equity at exit
- $41,600
- IRR
- -1.6%
- Equity multiple
- 0.89×
- Total profit
- $-8,266
- Equity at exit
- $24,123
Cash invested: $78,120 (down + closing). Projections, not guarantees.
Landlord ↔ Tenant lean methodology
- Overall (STATE)
- 28 Tenant-Leaning
- State Washington
- 28 Tenant-Leaning · D+8
- County
- — inherits STATE
- City
- — inherits STATE
ZIP-level market 98367
- Rents YoY
- 1.6%
- Active inventory
- 356
- Price-to-rent
- 8.5×
Monthly cashflow live
- Estimated rent
- $2,745 medium interval (Pro) →
- Mortgage (P&I)
- −$1,463
- Tax from tax record
- −$227 /mo · $2,721/yr
- Insurance
- −$116
- HOA
- −$0
- Vacancy / Maint / Mgmt
- −$576
- Net cashflow
- $362
Break-even live
Sensitivity live
| Price | -10% $520 | -5% $441 | +0% $362 | +5% $283 | +10% $204 |
|---|---|---|---|---|---|
| Rent | -10% $145 | -5% $254 | +0% $362 | +5% $471 | +10% $579 |
| Rate | -1.0pp $503 | -0.5pp $433 | base $362 | +0.5pp $290 | +1.0pp $216 |
UW: 25.0% down · 7.5% · 30yr · 1.5% tax · 5.0% vac · 8.0% maint · 8.0% mgmt
Financing live
Cash to close
- Down payment
- $69,750
- Closing costs
- $8,370
- Reserves months
- —
- Total cash needed
- —
Loan-product check · same deal, 3 products live
Conventional
25% down · 7.5% · 30yr
- Down + closing
- —
- Monthly P&I
- —
- Monthly cashflow
- —
- DSCR
- —
- Eligible?
- —
Personal DTI + credit; lowest rate.
DSCR
20% down · 8.5% · 30yr
- Down + closing
- —
- Monthly P&I
- —
- Monthly cashflow
- —
- DSCR
- —
- Eligible?
- —
No personal income docs; deal must DSCR.
Hard money
10% down · 12.0% · 12mo
- Down + closing
- —
- Monthly P&I
- —
- Monthly cashflow
- —
- DSCR
- —
- Eligible?
- —
Short-term bridge; refi at stabilization.
Listing history 36 events
-
2026-04-20status Pending
-
2026-04-19status Active
-
2026-04-09status Pending
-
2026-04-03status Active
-
2026-02-17status Pending
-
2026-02-06$279,000 Active
-
2019-05-21soldstatus $277,573 Sold
-
2019-05-21soldstatus $277,573
-
2019-04-12status Pending Inspection
-
2019-04-04$275,000 Active
-
2017-03-31soldstatus $208,500 Sold
-
2017-03-31soldstatus $208,500
-
2017-03-08status Pending
-
2017-03-02status Pending Inspection
-
2017-01-17price $210,000
-
2016-11-27status Active
-
2016-11-27price $215,000
-
2016-11-08historical Taken Off Market
-
2016-10-18status Active
-
2016-10-08status Pending
-
2016-09-20status Pending Inspection
-
2016-09-13price $212,000
-
2016-08-19price $215,000
-
2016-07-22status Active
-
2016-06-28status Pending
-
2016-06-10status Pending Inspection
-
2016-06-08$230,000 Active
-
2008-07-23soldstatus $140,000 Sold
-
2008-07-23soldstatus $140,000
-
2008-07-14historical
-
2008-07-11historical
-
2008-05-10historical
-
2008-04-03price $140,000
-
2007-10-25$155,000
-
2007-10-06$140,000
-
1993-08-05soldstatus $11,500
ⓘ Source: listings_history table (triggers on properties + properties_extension) + one-shot
backfill from property_details.listing_events for pre-trigger history.
Tax reassessment forecast WA · Resets to sale price
- Current annual tax
- $2,721 · $227/mo
- Projected year-2 tax
- $2,734 · $228/mo
- Expected delta
- +$13/yr (+$1/mo · 0.5%)
ⓘ Screening estimate from a state-policy table — verify with the county assessor before closing.
Climate risk First Street
- Flood 1/10 Low FEMA zone X (unshaded) · 0% chance over 30 yrs
- Wildfire 2/10 Low
- Heat 3/10 Moderate 7 d/yr ≥86°F today · 15 d/yr by 30 yrs out
- Wind 1/10 Low
- Air quality 6/10 Major 8 unhealthy d/yr today · 9 by 30 yrs out
Nearby sold comps map
Loading sold comps map…
Walkable amenities ~0.75 mi
Loading nearby amenities…
Taxation est. · year 1
- Rental income
- $32,937
- − Mortgage interest
- −$15,628
- − Property taxes
- −$2,721
- − Insurance
- −$1,395
- − Repairs & maintenance
- −$2,635
- − Management
- −$2,635
- − Depreciation
- −$8,116
- Taxable loss
- −$193
- Est. tax savings @ 24.0%
- +$46
- After-tax cash flow
- $4,394/yr
For passive investors: Depreciation is non-cash, so a rental often shows a tax loss while cash-flowing — sheltering income. Rental losses are passive: they offset passive income freely, and up to $25,000/yr can offset ordinary (W-2) income if you actively participate and your MAGI is under $100k (phasing out to $0 by $150k); unused losses carry forward. On sale, claimed depreciation is recaptured at up to 25%, and gains may owe capital-gains tax (a 1031 exchange can defer both). Figures are a year-1 estimate at your 24.0% rate — not tax advice; consult a CPA.
Schools (NCES district)
- District
- South Kitsap School District
- NCES district ID
- 5308160
- Math proficiency
- 52% ▲ 2.00%
- Reading proficiency
- 64% ▲ 3.00%
- Median HH income
- $62,824
- Composite
- 52.31/100
- National rank
- #3445
- State rank
- #71 of 291 in WA
Livability — Southworth
- Score
- 66/100
- State rank
- #317
- US rank
- #11562
Category grades
Schools grade is shown separately in the Schools card above.
Census & demographics
- County
- Kitsap County · 243,099 people
- Metro
- Bremerton-Silverdale-Port Orchard, WA
- Population (ZIP)
- 31,756
- Household income
- $115,482
- Rent vs Own
- Severe rent burden
- 595.0
Population outlook (Kitsap County) Hauer SSP2
- Today (2025)
- 277,525 people
- By 2030
- 285,040 · +2.7%
- By 2040
- 294,957 · +6.3%
- By 2050
- 300,622 · +8.3%
- By 2075
- 315,580 · +13.7%
- By 2100
- 304,340 · +9.7%
Race, ethnicity, and origin ACS 2023
- Neighborhood character
- Predominantly White (78%)
- Race & ethnicity
- White 78% Two or more races 11% Hispanic / Latino 7% Asian 4% Pacific Islander 1%
- Hispanic origin (detail)
- Mexican 5%
- Common ancestry
- Italian 7% Portuguese 6% Slovak 4%
- Foreign-born
- 6% · Canada, South Korea, Vietnam
- Languages at home
- 91% English-only · Spanish 3% Tagalog/Filipino 2% Other Asian/Pacific 2%
Political lean MEDSL · Kitsap
- 2024 margin
- Strong D (+20.9) · D 58.8% · R 37.9% · Other 3.3%
- 2008→2024 swing
- +8.6pp toward D · 2008: 12.3pp · 2024: 20.9pp
- All cycles
- 2024: D+20.9 2020: D+18.1 2016: D+11.6 2012: D+11.1 2008: D+12.3
Not yet ingested
- Civics
- —
Market trends
- HPI YoY
- ▼ -441.02%
- Current HPI
- 351.671
- Rent YoY
- ▲ 1.60%
- Metro
- Bremerton-Silverdale-Port Orchard, WA
- State GDP YoY
- ▲ 4.65%
- F500 in state
- 22
Industry mix (Fortune 500 HQ in WA)
| Industry | F500 HQs | Revenue |
|---|---|---|
| Retail | 2 | $269B |
|
||
| Technology / Retail | 1 | $638B |
|
||
| Technology | 1 | $245B |
|
||
| Telecommunications | 1 | $38B |
|
||
| Food / Beverage | 1 | $36B |
|
||
| Automotive / Trucks | 1 | $34B |
|
||
Price history
+2326.1% since first listed36 events — show timeline
- 2026-04-20 Pending — NWMLS as Distributed by MLS Grid
- 2026-04-19 Relisted — NWMLS as Distributed by MLS Grid
- 2026-04-09 Pending — NWMLS as Distributed by MLS Grid
- 2026-04-03 Relisted — NWMLS as Distributed by MLS Grid
- 2026-02-17 Pending — NWMLS as Distributed by MLS Grid
- 2026-02-06 Listed $279,000 NWMLS as Distributed by MLS Grid
- 2019-05-21 Sold (Public Records) $277,573 Public Records
- 2019-05-21 Sold (MLS) $277,573 NWMLS as Distributed by MLS Grid
- 2019-04-12 Pending — NWMLS as Distributed by MLS Grid
- 2019-04-04 Listed $275,000 NWMLS as Distributed by MLS Grid
- 2017-03-31 Sold (Public Records) $208,500 Public Records
- 2017-03-31 Sold (MLS) $208,500 NWMLS as Distributed by MLS Grid
- 2017-03-08 Pending — NWMLS as Distributed by MLS Grid
- 2017-03-02 Pending — NWMLS as Distributed by MLS Grid
- 2017-01-17 Price Changed $210,000 NWMLS as Distributed by MLS Grid
- 2016-11-27 Relisted — NWMLS as Distributed by MLS Grid
- 2016-11-27 Price Changed $215,000 NWMLS as Distributed by MLS Grid
- 2016-11-08 Delisted — NWMLS as Distributed by MLS Grid
- 2016-10-18 Relisted — NWMLS as Distributed by MLS Grid
- 2016-10-08 Pending — NWMLS as Distributed by MLS Grid
- 2016-09-20 Pending — NWMLS as Distributed by MLS Grid
- 2016-09-13 Price Changed $212,000 NWMLS as Distributed by MLS Grid
- 2016-08-19 Price Changed $215,000 NWMLS as Distributed by MLS Grid
- 2016-07-22 Relisted — NWMLS as Distributed by MLS Grid
- 2016-06-28 Pending — NWMLS as Distributed by MLS Grid
- 2016-06-10 Pending — NWMLS as Distributed by MLS Grid
- 2016-06-08 Listed $230,000 NWMLS as Distributed by MLS Grid
- 2008-07-23 Sold (MLS) $140,000 NWMLS as Distributed by MLS Grid
- 2008-07-23 Sold (MLS) $140,000 NWMLS as Distributed by MLS Grid
- 2008-07-14 Delisted — NWMLS as Distributed by MLS Grid
- 2008-07-11 Delisted — NWMLS as Distributed by MLS Grid
- 2008-05-10 Contingent — NWMLS as Distributed by MLS Grid
- 2008-04-03 Price Changed $140,000 NWMLS as Distributed by MLS Grid
- 2007-10-25 Listed $155,000 NWMLS as Distributed by MLS Grid
- 2007-10-06 Listed $140,000 NWMLS as Distributed by MLS Grid
- 1993-08-05 Sold (Public Records) $11,500 Public Records
Property tax history
+4.3%/yrLatest (2026): $2,721 · +0.5% YoY. Source: county tax records.
Cash-flow waterfall
monthlySold comps — $/sqft
last 12 mo · ≤1 miLoading sold comps…