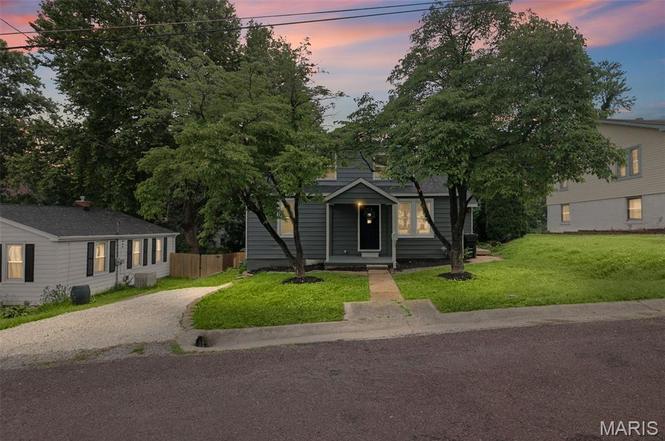
330 Polk St · Belleville, IL
Flood risk 1/10 · Minimal
- FEMA flood zone
- X
- Chance of flooding over 30 yrs
- 0.0%
- Est. flood insurance / yr
- $473 – $860
Fire risk 1/10 · Minimal
- Est. fire insurance / yr
- $804 – $1,492
Heat risk 5/10 · Moderate
- Hot days now (above 107°F)
- 7 days/yr
- Hot days in 30 yrs
- 21 days/yr
Wind risk 2/10 · Minimal
- Chance of severe wind over 30 yrs
- 1.0%
Air-quality risk 4/10 · Minor
- Unhealthy air days now
- 3 days/yr
- Unhealthy air days in 30 yrs
- 6 days/yr
Risk factors via First Street. Map © Google.
Why this score? — see what drove the D+ grade
The composite is a weighted blend of 9 inputs, each scored 0–100. Each bar is that input's sub-score; the figure is the points it added to the 100-point composite (weight × sub-score).
- Cash flow +15.0/30.0
- ARV discount +7.5/15.0
- Rent growth +5.0/5.0
- DSCR +4.6/10.0
- 1% rule +4.4/10.0
- Livability +3.9/5.0
- Condition / age +2.5/5.0
- Schools +2.2/10.0
- Appreciation +0.0/10.0
$147,500
🖨 Deal sheet 📄 Offer letter ✓ Due diligence
Listing remarks
Updated and move-in ready! This 3 bedroom, 1 bath Belleville home offers fresh neutral paint, updated flooring, tall main-level ceilings, a refreshed kitchen with dark cabinetry, stainless steel appliances, updated countertops, and a modern full bath with tile surround. The layout includes comfortable living and dining space, main-level bedrooms, plus an upstairs bedroom and bonus/flex area. The unfinished basement provides additional storage and utility space. Outside features include a covered front porch, updated exterior, off-street gravel parking, and a fenced rear area. A great opportunity at an affordable price point—schedule your showing today!
Key facts
- Covered front porch
- Modern full bath
- Updated flooring
Tags
Property features AI
Finance
- Financial info: Lease not considered; No second mortgage indicated
Exterior
- Parking: Driveway; Gravel parking
- Utilities: Public water; Public sewer; Electric service by Ameren; Electricity connected; Natural gas connected; Water connected; Sewer connected
- Home design: Single family residence; Residential property; Two levels
- Construction: Vinyl siding; Block basement; Has basement
- Exterior features: Front yard; Back yard; Gentle sloping lot; Natural foliage; Some trees
Interior
- Kitchen: Electric cooktop; Dishwasher; Microwave
- Bedrooms: 3 bedrooms total; 2 bedrooms on the main level; 1 bedroom on the upper level
- Bathrooms: 1 full bathroom (main/upper levels)
- Heating & cooling: Forced air heating (natural gas); Central air conditioning; Ceiling fans
- Interior features: Electric cooktop; Dishwasher; Microwave; Ceiling fan(s); Central air
Neighborhood map
What this means for you Summary
Snapshot
- This is a 3-bed/2.0-bath single-family listed at $148k.
Deal economics
- At list price, monthly cash flow is $45 ($539/yr) — positive.
- The deal already cash-flows at list — no discount required.
- To meet the 1% rule (rent ≥ 1% of price), the offer needs to be $139k (5.9% below list).
- Recommended offer: $139k (5.9% below list) — sets the bar for 1% rule.
Location & tenants
- Location reads 78/100 on livability (#142 in IL, #2,604 nationally) — a middle-class / working-renter tenant base. Strengths: commute A+, cost of living A+, housing A+; Watch: crime F, amenities D-.
- Belleville Twp Hsd 201 (suburban): math 21% / reading 28% proficiency, ranked #308 of 620 in IL (top 50%) — low school quality limits family demand, transient renter base, plan for 1-2y turnover.
- Zoned schools: Belleville High School-West (math 19% / reading 26%, grade F, #317 of 693 statewide, top 46%, 2,234 students, 0% FRL).
- Market conditions: Rents rising fast (+14.5%/yr); 148 active listings in the ZIP; 1 comparable units currently listed for rent nearby; 783 units permitted in St. Clair County in 2024 (378 in 5+ unit buildings).
Forward outlook
- Local home prices are declining (-3.0%/yr); year-one equity from $1k of loan paydown is wiped out by about $4k of value loss. Plan a longer hold.
- St. Clair County population projected at -23% by 2050 — secular population decline; favor cash flow + early exit over multi-decade hold.
Negotiation context
- Only 8 days on market — expect competitive offers; lowballing is unlikely to land.
- 4 sale attempts since 9y ago with the ask held roughly flat each time — persistent listings suggest the price (not the market) is what's stuck; bring a comps-based counter.
- Current owner paid $47k; list at $148k implies a 216% gain — meaningful room to come down on a strong offer.
Risks & watch-outs
- Watch-outs: built in 1942 — expect roof / HVAC / electrical / plumbing capex.
- Climate carrying-cost: extreme-heat days projected 7→21/yr by 2055 (HVAC capex compounding) — expect insurance premiums to compound above CPI over the hold.
Questions for the listing agent
- Built in 1942 — when were the roof, HVAC, electrical panel, plumbing, and water heater last replaced?
- Is there a deadline driving the sale (1031 exchange, divorce, estate, relocation)? That informs how much negotiation room exists.
- Crime grade is F in this area — have there been break-ins, vandalism, or insurance claims at this property in the last 3 years? What carrier currently insures it and at what premium?
- The area grade is low — what's the realistic commute time and amenity access for the typical tenant pool here? Any planned neighborhood developments (good or bad) we should know about?
- What's the average days-on-market for RENTAL listings here right now (not sales)? A rising rental-DOM trend means longer vacancies and softer asking-rent achievability than the comps imply.
- What's the recent tenant-quality profile in this submarket — average credit score on applications, eviction rate, late-payment / NSF rate, and stable-employment percentage? A property-management company in the area should have these aggregated.
- How much new for-sale + rental construction is in the pipeline within 1–3 miles? Heavy new supply typically softens prices + rents 12–24 months out; constrained supply supports both.
Investment metrics
- 1% rule
- 0.94% ✗
- Cap rate
- 6.66%
- Cash-on-cash
- 1.30%
- DSCR
- 1.06
- GRM
- 8.9
CMA / ARV
- ARV (on-the-fly)
- $51,840
- Comps found
- 6
Show comp detail 6 sales within ~0.75 mi
| Address | Dist | Beds/Ba | Sqft | Sold | Price | $/sf | Match |
|---|---|---|---|---|---|---|---|
| 400 S Belt | 0.12mi | 3/1.5 | 864 (0%) | 13mo | $100,000 | $116 | 81 |
| 18 W Garfield St | 0.48mi | 2/1.0 (-1) | 850 (-2%) | 4mo | $49,900 | $59 | 62 |
| 509 S Church St | 0.59mi | 2/1.0 (-1) | 848 (-2%) | 3mo | $99,900 | $118 | 58 |
| 412 E Mckinley St | 0.66mi | 2/1.0 (-1) | 832 (-4%) | 8mo | $50,000 | $60 | 48 |
| 719 W Monroe St | 0.60mi | 3/1.0 | 784 (-9%) | 13mo | $9,950 | $13 | 42 |
| 905 W Harrison St | 0.72mi | 2/1.0 (-1) | 900 (+4%) | 23mo | $50,000 | $56 | 31 |
Match score weights: distance 35% · size 25% · config 20% · recency 20%. Top-matched comps best support the ARV.
Projected returns pro-forma
-3.0% appreciation · 8.0% rent growth · sell at horizon
- IRR
- -8.6%
- Equity multiple
- 0.67×
- Total profit
- $-13,668
- Equity at exit
- $21,993
- IRR
- 6.7%
- Equity multiple
- 1.61×
- Total profit
- $25,325
- Equity at exit
- $12,753
Cash invested: $41,300 (down + closing). Projections, not guarantees.
Landlord ↔ Tenant lean methodology
- Overall (STATE)
- 43 Moderately Tenant-Leaning
- State Illinois
- 43 Moderately Tenant-Leaning · D+7
- County
- — inherits STATE
- City
- — inherits STATE
ZIP-level market 62220
- Home prices YoY
- -26.4%
- Rents YoY
- 14.5%
- Active inventory
- 148
- Price-to-rent
- 8.9×
Monthly cashflow live
- Estimated rent
- $1,388 medium interval (Pro) →
- Mortgage (P&I)
- −$774
- Tax from tax record
- −$216 /mo · $2,598/yr
- Insurance
- −$61
- HOA
- −$0
- Vacancy / Maint / Mgmt
- −$291
- Net cashflow
- $45
Break-even live
UW: 25.0% down · 7.5% · 30yr · 1.5% tax · 5.0% vac · 8.0% maint · 8.0% mgmt
Financing live
Cash to close
- Down payment
- $36,875
- Closing costs
- $4,425
- Reserves months
- —
- Total cash needed
- —
Loan-product check · same deal, 3 products live
Conventional
25% down · 7.5% · 30yr
- Down + closing
- —
- Monthly P&I
- —
- Monthly cashflow
- —
- DSCR
- —
- Eligible?
- —
Personal DTI + credit; lowest rate.
DSCR
20% down · 8.5% · 30yr
- Down + closing
- —
- Monthly P&I
- —
- Monthly cashflow
- —
- DSCR
- —
- Eligible?
- —
No personal income docs; deal must DSCR.
Hard money
10% down · 12.0% · 12mo
- Down + closing
- —
- Monthly P&I
- —
- Monthly cashflow
- —
- DSCR
- —
- Eligible?
- —
Short-term bridge; refi at stabilization.
Rent comps 1 comps
| Address | Beds | Baths | Sqft | Rent | $/sqft | DOM | Units | Dist |
|---|---|---|---|---|---|---|---|---|
| 1104 Bel Aire Dr Belleville, IL | 2.0 | 1.0 | 780 | $1,350 | $1.73 | 1d | 1 | 1.38mi |
Listing history 6 events
-
2026-06-18days on market $147,500 Active 8 DOM
-
2026-06-17days on market $147,500 Active 7 DOM
-
2026-06-16days on market $147,500 Active 6 DOM
-
2026-06-15days on market $147,500 Active 5 DOM
-
2026-06-13remarks 660-char remark
-
2026-06-13$147,500 Active 3 DOM
ⓘ Source: listings_history table (triggers on properties + properties_extension) + one-shot
backfill from property_details.listing_events for pre-trigger history.
Tax reassessment forecast IL · Partial reset (capped growth)
- Current annual tax
- $2,598 · $216/mo
- Projected year-2 tax
- $2,973 · $248/mo
- Expected delta
- +$375/yr (+$31/mo · 14.4%)
ⓘ Screening estimate from a state-policy table — verify with the county assessor before closing.
Climate risk First Street
- Flood 1/10 Low FEMA zone X · 0% chance over 30 yrs
- Wildfire 1/10 Low
- Heat 5/10 Major 7 d/yr ≥107°F today · 21 d/yr by 30 yrs out
- Wind 2/10 Low 100% chance of damaging wind over 30 yrs
- Air quality 4/10 Moderate 3 unhealthy d/yr today · 6 by 30 yrs out
Nearby sold comps map
Loading sold comps map…
Walkable amenities ~0.75 mi
Loading nearby amenities…
Taxation est. · year 1
- Rental income
- $16,653
- − Mortgage interest
- −$8,262
- − Property taxes
- −$2,598
- − Insurance
- −$738
- − Repairs & maintenance
- −$1,332
- − Management
- −$1,332
- − Depreciation
- −$4,291
- Taxable loss
- −$1,900
- Est. tax savings @ 24.0%
- +$456
- After-tax cash flow
- $995/yr
For passive investors: Depreciation is non-cash, so a rental often shows a tax loss while cash-flowing — sheltering income. Rental losses are passive: they offset passive income freely, and up to $25,000/yr can offset ordinary (W-2) income if you actively participate and your MAGI is under $100k (phasing out to $0 by $150k); unused losses carry forward. On sale, claimed depreciation is recaptured at up to 25%, and gains may owe capital-gains tax (a 1031 exchange can defer both). Figures are a year-1 estimate at your 24.0% rate — not tax advice; consult a CPA.
Schools (NCES district)
- District
- Belleville Twp Hsd 201
- NCES district ID
- 1705640
- Math proficiency
- 21% ▼ -8.00%
- Reading proficiency
- 28% ▼ -3.00%
- Median HH income
- $58,064
- Composite
- 22.39/100
- National rank
- #8115
- State rank
- #308 of 620 in IL
Livability — Belleville
- Score
- 78/100
- State rank
- #142
- US rank
- #2604
Category grades
Schools grade is shown separately in the Schools card above.
Census & demographics
- Census place
- Belleville, IL
- County
- Saint Clair County · 169,691 people
- City population
- 47,407
- Metro
- St. Louis, MO-IL
- Population (ZIP)
- 19,152
- Household income
- $65,952
- Rent vs Own
- Severe rent burden
- 923.0
Population outlook (St. Clair County) Hauer SSP2
- Today (2025)
- 250,366 people
- By 2030
- 240,511 · -3.9%
- By 2040
- 217,391 · -13.2%
- By 2050
- 192,699 · -23.0%
- By 2075
- 140,637 · -43.8%
- By 2100
- 100,499 · -59.9%
Race, ethnicity, and origin ACS 2023
- Neighborhood character
- Predominantly White (67%)
- Race & ethnicity
- White 67% Black 22% Two or more races 6% Hispanic / Latino 3% Asian 1%
- Common ancestry
- Lithuanian 2% Slovak 2% Romanian 2%
- Foreign-born
- 4% · Canada
- Languages at home
- 95% English-only · Arabic 2% Spanish 1% Other Indo-European 1%
Political lean MEDSL · St. Clair
- 2024 margin
- Lean D (+7.9) · D 53.0% · R 45.1% · Other 1.8%
- 2008→2024 swing
- -14.6pp toward R · 2008: 22.4pp · 2024: 7.9pp
- All cycles
- 2024: D+7.9 2020: D+8.7 2016: D+5.6 2012: D+14.5 2008: D+22.4
Not yet ingested
- Civics
- —
Market trends
- HPI YoY
- ▼ -52.27%
- Current HPI
- 145.9237
- Rent YoY
- ▲ 14.47%
- Metro
- St. Louis, MO-IL
- State GDP YoY
- ▲ 1.59%
- F500 in state
- 60
Industry mix (Fortune 500 HQ in IL)
| Industry | F500 HQs | Revenue |
|---|---|---|
| Insurance | 4 | $201B |
|
||
| Consumer Goods | 4 | $87B |
|
||
| Industrial Machinery | 3 | $64B |
|
||
| Healthcare | 2 | $55B |
|
||
| Retail / Pharmacy | 1 | $148B |
|
||
| Agriculture / Food | 1 | $86B |
|
||
Price history
+189.2% since first listed22 events — show timeline
- 2026-06-11 Listed $147,500 MARIS as Distributed by MLS Grid
- 2026-06-10 Coming Soon $147,500 MARIS as Distributed by MLS Grid
- 2026-02-04 Sold (Public Records) $46,667 Public Records
- 2022-05-26 Relisted — MRED as Distributed by MLS Grid
- 2022-05-26 Listing Removed — MRED as Distributed by MLS Grid
- 2022-05-20 Listing Removed — MRED as Distributed by MLS Grid
- 2022-04-13 Pending — MRED as Distributed by MLS Grid
- 2021-12-01 Pending — MRED as Distributed by MLS Grid
- 2021-11-10 Pending — MRED as Distributed by MLS Grid
- 2021-11-10 Listing Removed — MRED as Distributed by MLS Grid
- 2021-10-12 Price Changed — MRED as Distributed by MLS Grid
- 2021-10-12 Price Changed $75,000 MARIS as Distributed by MLS Grid
- 2021-09-25 Price Changed — MRED as Distributed by MLS Grid
- 2021-09-25 Price Changed $79,900 MARIS as Distributed by MLS Grid
- 2021-09-02 Listed — MRED as Distributed by MLS Grid
- 2018-03-14 Sold (Public Records) $57,000 Public Records
- 2018-03-02 Pending — MARIS as Distributed by MLS Grid
- 2018-03-02 Sold (MLS) — MARIS as Distributed by MLS Grid
- 2018-01-22 Contingent — MARIS as Distributed by MLS Grid
- 2018-01-16 Price Changed $59,900 MARIS as Distributed by MLS Grid
- 2017-12-05 Listed $64,900 MARIS as Distributed by MLS Grid
- 2000-04-03 Sold (Public Records) $51,000 Public Records
Property tax history
+3.3%/yrLatest (2024): $2,598 · +8.7% YoY. Source: county tax records.
Cash-flow waterfall
monthlySold comps — $/sqft
last 12 mo · ≤1 miLoading sold comps…