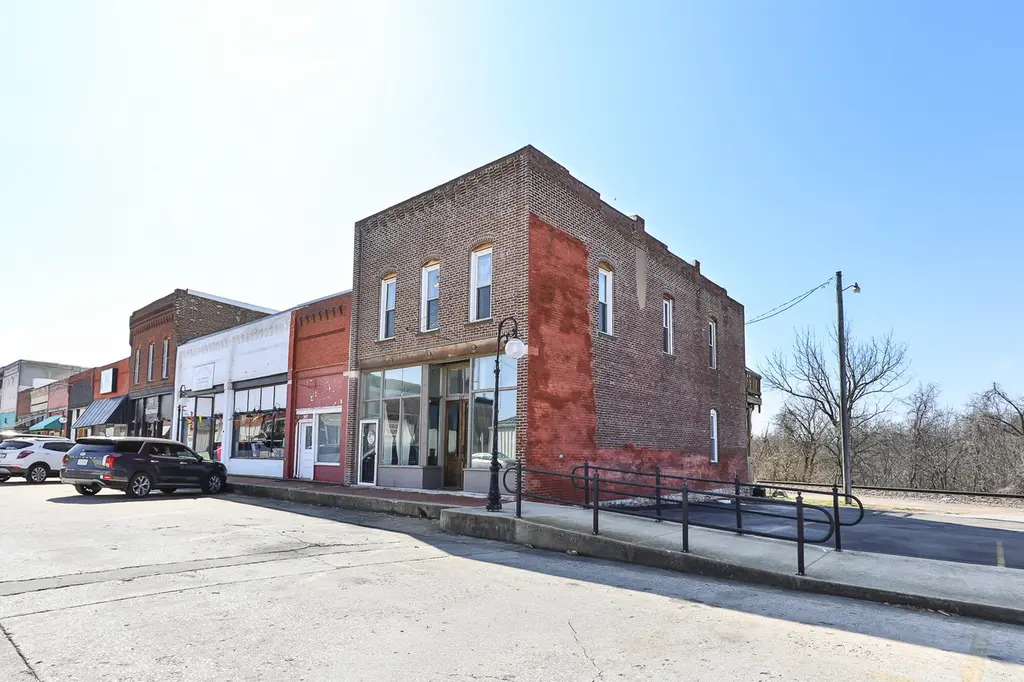
207 W Main St · Ash Grove, MO
Flood risk No data
- FEMA flood zone
- —
- Chance of flooding over 30 yrs
- —
- Est. flood insurance / yr
- —
Fire risk No data
- Est. fire insurance / yr
- —
Heat risk No data
- Hot days now (above threshold)
- —
- Hot days in 30 yrs
- —
Wind risk No data
- Chance of severe wind over 30 yrs
- —
Air-quality risk No data
- Unhealthy air days now
- —
- Unhealthy air days in 30 yrs
- —
Risk factors via First Street. Map © Google.
Why this score? — see what drove the C grade
The composite is a weighted blend of 9 inputs, each scored 0–100. Each bar is that input's sub-score; the figure is the points it added to the 100-point composite (weight × sub-score).
- Cash flow +18.0/30.0
- ARV discount +15.0/15.0
- DSCR +5.7/10.0
- 1% rule +4.8/10.0
- Condition / age +3.8/5.0
- Schools +3.5/10.0
- Livability +3.1/5.0
- Rent growth +2.5/5.0
- Appreciation +0.0/10.0
$199,900
🖨 Deal sheet 📄 Offer letter ✓ Due diligence
Listing remarks MLS
Step into a piece of history with this beautifully restored 1878 two-story property, where timeless character meets modern updates. From the moment you enter, you'll be captivated by the soaring ceilings, original hardwood floors, and striking vintage details, including plaster walls that artfully expose the original brick beneath. The upper level has been thoughtfully configured for comfortable living or income potential, previously operating as a nightly rental. It features a full kitchen, spacious family room, bedroom, full bath, and convenient laundry area--offering a private, turnkey living space full of charm. The lower level boasts an open floor plan that has served as both a retail space and a creative studio, now easily functioning as additional living quarters. Its flexible layout invites endless possibilities--whether you envision a boutique storefront, gallery, workspace, or expanded residence. Major updates include a newer roof, along with electrical and plumbing systems updated providing peace of mind while preserving the building's historic integrity. With its unique blend of vintage style, income-producing potential, and adaptable space, this one-of-a-kind property offers truly limitless opportunities.
Key facts
- Plaster walls
- Full kitchen
- Original brick
Tags
Neighborhood map
What this means for you Summary
Snapshot
- This is a 2-bed/2.0-bath single-family listed at $200k. Condition is rated good.
Deal economics
- At list price, monthly cash flow is $173 ($2k/yr) — positive.
- The deal already cash-flows at list — no discount required.
- To meet the 1% rule (rent ≥ 1% of price), the offer needs to be $197k (1.6% below list).
- Recommended offer: $182k (9.0% below list) — sets the bar for market timing.
- Cap rate 7.3% vs local median 5.4% in Ash Grove — top-decile yield for the area; either an underpriced asset or a hidden risk that comps aren't pricing in. Stress-test before assuming the spread holds.
Location & tenants
- Location reads 61/100 on livability (#435 in MO) — a middle-class / working-renter tenant base. Strengths: cost of living A+, housing A+; Watch: schools C-, crime C-, amenities F.
- Ash Grove R-IV (rural): math 33% / reading 50% proficiency, ranked #121 of 324 in MO (top 37%) — families likely to look elsewhere, expect single-tenant / working-renter base with shorter leases.
- Market conditions: 60 active listings in the ZIP; 1,302 units permitted in Greene County in 2024 (250 in 5+ unit buildings).
Forward outlook
- Local home prices are declining (-3.0%/yr); year-one equity from $1k of loan paydown is wiped out by about $6k of value loss. Plan a longer hold.
- Greene County population projected at +25% by 2050 — long-run rental-demand tailwind backs the buy-and-hold thesis.
Negotiation context
- It's been on market 93 days — a 9% lower offer ($182k) is reasonable based on typical stale-listing flexibility.
Risks & watch-outs
- Watch-outs: built in 1878 — expect roof / HVAC / electrical / plumbing capex.
Questions for the listing agent
- It's been on market 93 days. Have you received any prior offers? Is the seller open to a 9% concession, seller financing, or rate buy-down credit?
- Built in 1878 — when were the roof, HVAC, electrical panel, plumbing, and water heater last replaced?
- Why hasn't it sold? Are there any deal-killer items the seller is aware of (foundation, flood, title, zoning, code violations)?
- Is there a deadline driving the sale (1031 exchange, divorce, estate, relocation)? That informs how much negotiation room exists.
- What's the average days-on-market for RENTAL listings here right now (not sales)? A rising rental-DOM trend means longer vacancies and softer asking-rent achievability than the comps imply.
- What's the recent tenant-quality profile in this submarket — average credit score on applications, eviction rate, late-payment / NSF rate, and stable-employment percentage? A property-management company in the area should have these aggregated.
- How much new for-sale + rental construction is in the pipeline within 1–3 miles? Heavy new supply typically softens prices + rents 12–24 months out; constrained supply supports both.
Investment metrics
- 1% rule
- 0.98% ✗
- Cap rate
- 7.33%
- Cash-on-cash
- 3.71%
- DSCR
- 1.17
- GRM
- 8.5
CMA / ARV
- ARV (median comp)
- $244,099
- List price
- $199,900
- Delta
- -18.11%
- Verdict
- UNDERPRICED
- Comps
- 20 within 1.0 mi
Show comp detail 4 sales within ~0.75 mi
| Address | Dist | Beds/Ba | Sqft | Sold | Price | $/sf | Match |
|---|---|---|---|---|---|---|---|
| 300 S High Ave | 0.23mi | 3/2.0 (+1) | 1,918 (-13%) | 5mo | $199,900 | $104 | 58 |
| 103 N Maple Ln | 0.42mi | 2/3.0 | 1,977 (-10%) | 6mo | $239,000 | $121 | 55 |
| 202 E Cawlfield St | 0.60mi | 3/2.0 (+1) | 1,998 (-9%) | 15mo | $250,000 | $125 | 39 |
| 134 Moonlight Valley Dr | 0.70mi | 3/2.0 (+1) | 2,465 (+12%) | 4mo | $329,900 | $134 | 39 |
Match score weights: distance 35% · size 25% · config 20% · recency 20%. Top-matched comps best support the ARV.
Projected returns pro-forma
-3.0% appreciation · 3.0% rent growth · sell at horizon
- IRR
- -10.5%
- Equity multiple
- 0.62×
- Total profit
- $-21,343
- Equity at exit
- $29,806
- IRR
- -1.1%
- Equity multiple
- 0.92×
- Total profit
- $-4,275
- Equity at exit
- $17,284
Cash invested: $55,972 (down + closing). Projections, not guarantees.
Landlord ↔ Tenant lean methodology
- Overall (STATE)
- 81 Strongly Landlord-Friendly
- State Missouri
- 81 Strongly Landlord-Friendly · R+10
- County
- — inherits STATE
- City
- — inherits STATE
ZIP-level market 65604
- Home prices YoY
- -13.1%
- Active inventory
- 60
- Price-to-rent
- 8.5×
Monthly cashflow live
- Estimated rent
- $1,968 medium interval (Pro) →
- Mortgage (P&I)
- −$1,048
- Tax est. 1.5%
- −$250 /mo · $2,998/yr
- Insurance
- −$83
- HOA
- −$0
- Vacancy / Maint / Mgmt
- −$413
- Net cashflow
- $173
Break-even live
UW: 25.0% down · 7.5% · 30yr · 1.5% tax · 5.0% vac · 8.0% maint · 8.0% mgmt
Financing live
Cash to close
- Down payment
- $49,975
- Closing costs
- $5,997
- Reserves months
- —
- Total cash needed
- —
Loan-product check · same deal, 3 products live
Conventional
25% down · 7.5% · 30yr
- Down + closing
- —
- Monthly P&I
- —
- Monthly cashflow
- —
- DSCR
- —
- Eligible?
- —
Personal DTI + credit; lowest rate.
DSCR
20% down · 8.5% · 30yr
- Down + closing
- —
- Monthly P&I
- —
- Monthly cashflow
- —
- DSCR
- —
- Eligible?
- —
No personal income docs; deal must DSCR.
Hard money
10% down · 12.0% · 12mo
- Down + closing
- —
- Monthly P&I
- —
- Monthly cashflow
- —
- DSCR
- —
- Eligible?
- —
Short-term bridge; refi at stabilization.
Listing history 16 events
-
2026-06-18days on market $199,900 Active 93 DOM
-
2026-06-17days on market $199,900 Active 92 DOM
-
2026-06-16days on market $199,900 Active 91 DOM
-
2026-06-15days on market $199,900 Active 90 DOM
-
2026-06-14days on market $199,900 Active 88 DOM
-
2026-06-10days on market $199,900 Active 85 DOM
-
2026-06-09days on market $199,900 Active 84 DOM
-
2026-06-08days on market $199,900 Active 83 DOM
-
2026-06-07days on market $199,900 Active 82 DOM
-
2026-06-03days on market $199,900 Active 78 DOM
-
2026-06-02days on market $199,900 Active 77 DOM
-
2026-06-01days on market $199,900 Active 76 DOM
-
2026-05-31days on market $199,900 Active 75 DOM
-
2026-05-30days on market $199,900 Active 74 DOM
-
2026-04-24price $199,900 1237-char remark
Show marketing remark (1237 chars)
Step into a piece of history with this beautifully restored 1878 two-story property, where timeless character meets modern updates. From the moment you enter, you'll be captivated by the soaring ceilings, original hardwood floors, and striking vintage details, including plaster walls that artfully expose the original brick beneath. The upper level has been thoughtfully configured for comfortable living or income potential, previously operating as a nightly rental. It features a full kitchen, spacious family room, bedroom, full bath, and convenient laundry area--offering a private, turnkey living space full of charm. The lower level boasts an open floor plan that has served as both a retail space and a creative studio, now easily functioning as additional living quarters. Its flexible layout invites endless possibilities--whether you envision a boutique storefront, gallery, workspace, or expanded residence. Major updates include a newer roof, along with electrical and plumbing systems updated providing peace of mind while preserving the building's historic integrity. With its unique blend of vintage style, income-producing potential, and adaptable space, this one-of-a-kind property offers truly limitless opportunities.
-
2026-03-17$215,000 Active 1237-char remark
Show marketing remark (1237 chars)
Step into a piece of history with this beautifully restored 1878 two-story property, where timeless character meets modern updates. From the moment you enter, you'll be captivated by the soaring ceilings, original hardwood floors, and striking vintage details, including plaster walls that artfully expose the original brick beneath. The upper level has been thoughtfully configured for comfortable living or income potential, previously operating as a nightly rental. It features a full kitchen, spacious family room, bedroom, full bath, and convenient laundry area--offering a private, turnkey living space full of charm. The lower level boasts an open floor plan that has served as both a retail space and a creative studio, now easily functioning as additional living quarters. Its flexible layout invites endless possibilities--whether you envision a boutique storefront, gallery, workspace, or expanded residence. Major updates include a newer roof, along with electrical and plumbing systems updated providing peace of mind while preserving the building's historic integrity. With its unique blend of vintage style, income-producing potential, and adaptable space, this one-of-a-kind property offers truly limitless opportunities.
ⓘ Source: listings_history table (triggers on properties + properties_extension) + one-shot
backfill from property_details.listing_events for pre-trigger history.
Nearby sold comps map
Loading sold comps map…
Walkable amenities ~0.75 mi
Loading nearby amenities…
Taxation est. · year 1
- Rental income
- $23,612
- − Mortgage interest
- −$11,198
- − Property taxes
- −$2,998
- − Insurance
- −$1,000
- − Repairs & maintenance
- −$1,889
- − Management
- −$1,889
- − Depreciation
- −$5,815
- Taxable loss
- −$1,176
- Est. tax savings @ 24.0%
- +$282
- After-tax cash flow
- $2,359/yr
For passive investors: Depreciation is non-cash, so a rental often shows a tax loss while cash-flowing — sheltering income. Rental losses are passive: they offset passive income freely, and up to $25,000/yr can offset ordinary (W-2) income if you actively participate and your MAGI is under $100k (phasing out to $0 by $150k); unused losses carry forward. On sale, claimed depreciation is recaptured at up to 25%, and gains may owe capital-gains tax (a 1031 exchange can defer both). Figures are a year-1 estimate at your 24.0% rate — not tax advice; consult a CPA.
Condition & rehab AI · 13 photos
This beautifully restored 1878 property offers a blend of historical charm and modern updates, making it a turnkey investment opportunity.
Value-add opportunities
- Both paint exterior — enhances curb appeal and resale value
- Both replace ceiling fans — modernizes the space and improves air circulation
Renovation cost estimate screening
Value-add ROI direction
- Both paint exterior — enhances curb appeal and resale value ↑
- Both replace ceiling fans — modernizes the space and improves air circulation ↑
ⓘ Cost ranges are severity-bucket heuristics (US national rule-of-thumb). Get contractor quotes + a written scope before underwriting a rehab budget.
Schools (NCES district)
- District
- Ash Grove R-IV
- NCES district ID
- 2903270
- Math proficiency
- 33% ▼ -7.00%
- Reading proficiency
- 50% ▲ 1.00%
- Median HH income
- $47,679
- Composite
- 35.45/100
- National rank
- #4929
- State rank
- #121 of 324 in MO
Livability — Ash Grove
- Score
- 61/100
- State rank
- #435
- US rank
- #17867
Category grades
Schools grade is shown separately in the Schools card above.
Census & demographics
- Census place
- Ash Grove, MO
- Population (ZIP)
- 3,909
Population outlook (Greene County) Hauer SSP2
- Today (2025)
- 319,054 people
- By 2030
- 335,135 · +5.0%
- By 2040
- 366,186 · +14.8%
- By 2050
- 397,431 · +24.6%
- By 2075
- 477,035 · +49.5%
- By 2100
- 520,828 · +63.2%
Race, ethnicity, and origin ACS 2023
- Neighborhood character
- Predominantly White (91%)
- Race & ethnicity
- White 91% Two or more races 7% Hispanic / Latino 5%
- Hispanic origin (detail)
- Mexican 3% Puerto Rican 2%
- Common ancestry
- Italian 2% Lithuanian 2% Romanian 2%
- Foreign-born
- 0%
- Languages at home
- 98% English-only · Spanish 2%
Political lean MEDSL · Greene
- 2024 margin
- Strong R (+20.8) · D 38.9% · R 59.7% · Other 1.4%
- 2008→2024 swing
- -5.0pp toward R · 2008: -15.8pp · 2024: -20.8pp
- All cycles
- 2024: R+20.8 2020: R+20.1 2016: R+27.4 2012: R+24.4 2008: R+15.8
Not yet ingested
- Civics
- —
Market trends
- HPI YoY
- ▼ -34.86%
- Current HPI
- 231.5643
- Rent YoY
- —
- Metro
- —
- State GDP YoY
- ▲ 1.84%
- F500 in state
- 20
Industry mix (Fortune 500 HQ in MO)
| Industry | F500 HQs | Revenue |
|---|---|---|
| Healthcare | 1 | $163B |
|
||
| Insurance | 1 | $21B |
|
||
| Industrial Technology | 1 | $17B |
|
||
| Retail | 1 | $16B |
|
||
| Industrial Distribution | 1 | $10B |
|
||
| Utilities | 1 | $9B |
|
||
Price history
-7.0% since first listed2 events — show timeline
- 2026-04-24 Price Changed $199,900 SOMO
- 2026-03-17 Listed $215,000 SOMO
Cash-flow waterfall
monthlySold comps — $/sqft
last 12 mo · ≤1 miLoading sold comps…