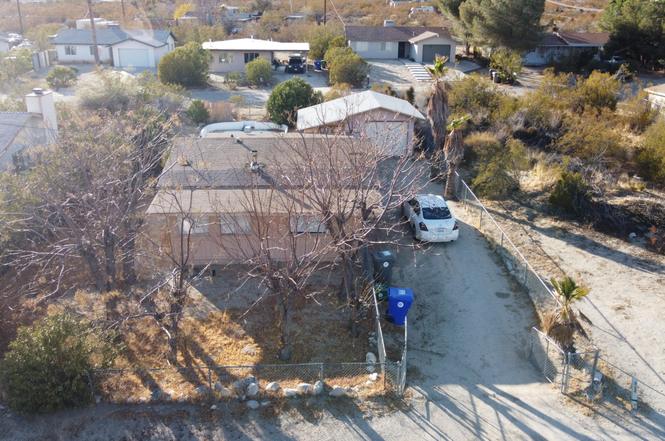
11022 West Dr · Morongo Valley, CA
Flood risk 1/10 · Minimal
- FEMA flood zone
- A
- Chance of flooding over 30 yrs
- 0.0%
- Est. flood insurance / yr
- $1,009 – $1,996
Fire risk 7/10 · Major
- Est. fire insurance / yr
- $659 – $1,223
Heat risk 7/10 · Major
- Hot days now (above 102°F)
- 8 days/yr
- Hot days in 30 yrs
- 22 days/yr
Wind risk 1/10 · Minimal
- Chance of severe wind over 30 yrs
- —
Air-quality risk 6/10 · Moderate
- Unhealthy air days now
- 11 days/yr
- Unhealthy air days in 30 yrs
- 15 days/yr
Risk factors via First Street. Map © Google.
Why this score? — see what drove the C+ grade
The composite is a weighted blend of 9 inputs, each scored 0–100. Each bar is that input's sub-score; the figure is the points it added to the 100-point composite (weight × sub-score).
- Cash flow +19.7/30.0
- ARV discount +15.0/15.0
- Appreciation +7.8/10.0
- DSCR +6.2/10.0
- 1% rule +4.2/10.0
- Livability +3.1/5.0
- Rent growth +2.5/5.0
- Condition / age +2.5/5.0
- Schools +2.2/10.0
$199,995
🖨 Deal sheet (PDF) 📄 Offer letter ✓ Due diligence
Listing remarks MLS
Morongo Valley pool home. Cute large 1 BR. with den. Nat gas heat + wood stove. Nice private in ground pool. Garage and work shop. Full property fenced and cross fenced. Paved rd. 20 minutes to Palm Springs. A must see in this price range.
Key facts
- 7,502 sq ft lot
- Garage
- Pool
Neighborhood map
What this means for you Summary
Snapshot
- This is a 1-bed/1.0-bath single-family listed at $200k.
Deal economics
- At list price, monthly cash flow is $109 ($1k/yr) — positive.
- The deal already cash-flows at list — no discount required.
- To meet the 1% rule (rent ≥ 1% of price), the offer needs to be $184k (8.0% below list).
- Recommended offer: $176k (12.0% below list) — sets the bar for market timing.
- Cap rate 7.7% vs local median 4.1% in Morongo Valley — top-decile yield for the area; either an underpriced asset or a hidden risk that comps aren't pricing in. Stress-test before assuming the spread holds.
Location & tenants
- Location reads 62/100 on livability (#505 in CA) — a middle-class / working-renter tenant base. Strengths: housing A+; Watch: cost of living C-, schools D+, amenities F.
- Morongo Unified (town): math 15% / reading 38% proficiency, ranked #395 of 517 in CA (top 76%) — low school quality limits family demand, transient renter base, plan for 1-2y turnover.
- Market conditions: 78 active listings in the ZIP; 5,458 units permitted in San Bernardino County in 2024 (1,500 in 5+ unit buildings).
Forward outlook
- In year one you build about $13k of equity ($1k loan paydown + $11k appreciation (5.6% local appreciation)).
- San Bernardino County population projected at +15% by 2050 — modest demand growth; plan on rents tracking national, not racing it.
- At projected returns (5.6% appreciation + 3.0% rent growth), your $56k cash investment doubles in ~4 years — after that, you're playing with house money.
- By year 3, paydown + projected appreciation supports a ~$31k cash-out refi (75% LTV) — recoverable capital for the next deal without selling this one.
Negotiation context
- It's been on market 200 days — a 12% lower offer ($176k) is reasonable based on typical stale-listing flexibility.
- 4 sale attempts since 21y ago; this cycle's ask has dropped $90k (31%) from the opening price — seller is motivated, your offer sets the floor, not the list.
- Current owner paid $60k; list at $200k implies a 233% gain — meaningful room to come down on a strong offer.
Risks & watch-outs
- Watch-outs: flood insurance adds $125/mo.
- Climate carrying-cost: in FEMA flood zone A (mandatory federal flood insurance); major wildfire risk; extreme-heat days projected 8→22/yr by 2055 (HVAC capex compounding) — expect insurance premiums to compound above CPI over the hold.
Questions for the listing agent
- It's been on market 200 days. Have you received any prior offers? Is the seller open to a 12% concession, seller financing, or rate buy-down credit?
- Built in 1962 — when were the roof, HVAC, electrical panel, plumbing, and water heater last replaced?
- What's the actual annual flood-insurance premium (NFIP or private), and is the property in a SFHA with mandatory coverage?
- Why hasn't it sold? Are there any deal-killer items the seller is aware of (foundation, flood, title, zoning, code violations)?
- Is there a deadline driving the sale (1031 exchange, divorce, estate, relocation)? That informs how much negotiation room exists.
- Schools are D-rated, which usually means shorter tenancies and higher turnover. Who's the typical renter profile here, and what's been the actual vacancy rate?
- What's the average days-on-market for RENTAL listings here right now (not sales)? A rising rental-DOM trend means longer vacancies and softer asking-rent achievability than the comps imply.
- What's the recent tenant-quality profile in this submarket — average credit score on applications, eviction rate, late-payment / NSF rate, and stable-employment percentage? A property-management company in the area should have these aggregated.
- How much new for-sale + rental construction is in the pipeline within 1–3 miles? Heavy new supply typically softens prices + rents 12–24 months out; constrained supply supports both.
Investment metrics
- 1% rule
- 0.92% ✗
- Cap rate
- 7.70%
- Cash-on-cash
- 5.03%
- DSCR
- 1.22
- GRM
- 9.1
CMA / ARV
- ARV (on-the-fly)
- $296,672
- Comps found
- 3
Show comp detail 3 sales within ~0.75 mi
| Address | Dist | Beds/Ba | Sqft | Sold | Price | $/sf | Match |
|---|---|---|---|---|---|---|---|
| 49897 Coronado | 0.02mi | 2/1.0 (+1) | 910 (-10%) | 6mo | $240,000 | $264 | 72 |
| 10934 Hess Blvd | 0.50mi | 2/2.0 (+1) | 880 (-13%) | 2mo | $270,000 | $307 | 43 |
| 49437 Pioneer | 0.57mi | 2/1.0 (+1) | 874 (-14%) | 2mo | $255,000 | $292 | 43 |
Match score weights: distance 35% · size 25% · config 20% · recency 20%. Top-matched comps best support the ARV.
Projected returns pro-forma
5.61% appreciation · 3.0% rent growth · sell at horizon
- IRR
- 16.3%
- Equity multiple
- 2.07×
- Total profit
- $60,067
- Equity at exit
- $120,780
- IRR
- 16.4%
- Equity multiple
- 4.08×
- Total profit
- $172,578
- Equity at exit
- $214,882
Cash invested: $55,999 (down + closing). Projections, not guarantees.
Landlord ↔ Tenant lean methodology
- Overall (STATE)
- 18 Strongly Tenant-Friendly
- State California
- 18 Strongly Tenant-Friendly · D+13
- County
- — inherits STATE
- City
- — inherits STATE
ZIP-level market 92256
- Home prices YoY
- 1.1%
- Active inventory
- 78
- Price-to-rent
- 9.1×
Monthly cashflow live
- Estimated rent
- $1,841 medium interval (Pro) →
- Mortgage (P&I)
- −$1,049
- Tax from tax record
- −$88 /mo · $1,051/yr
- Insurance
- −$83
- Flood insurance flood zone
- −$125 /mo · $1,502/yr
- HOA
- −$0
- Vacancy / Maint / Mgmt
- −$387
- Net cashflow
- $109
Break-even live
Sensitivity live
| Price | -10% $223 | -5% $166 | +0% $109 | +5% $53 | +10% $-4 |
|---|---|---|---|---|---|
| Rent | -10% $-36 | -5% $37 | +0% $109 | +5% $182 | +10% $255 |
| Rate | -1.0pp $210 | -0.5pp $160 | base $109 | +0.5pp $58 | +1.0pp $5 |
UW: 25.0% down · 7.5% · 30yr · 1.5% tax · 5.0% vac · 8.0% maint · 8.0% mgmt
Financing live
Cash to close
- Down payment
- $49,999
- Closing costs
- $6,000
- Reserves months
- —
- Total cash needed
- —
Loan-product check · same deal, 3 products live
Conventional
25% down · 7.5% · 30yr
- Down + closing
- —
- Monthly P&I
- —
- Monthly cashflow
- —
- DSCR
- —
- Eligible?
- —
Personal DTI + credit; lowest rate.
DSCR
20% down · 8.5% · 30yr
- Down + closing
- —
- Monthly P&I
- —
- Monthly cashflow
- —
- DSCR
- —
- Eligible?
- —
No personal income docs; deal must DSCR.
Hard money
10% down · 12.0% · 12mo
- Down + closing
- —
- Monthly P&I
- —
- Monthly cashflow
- —
- DSCR
- —
- Eligible?
- —
Short-term bridge; refi at stabilization.
Listing history 16 events
-
2026-04-20status Pending
-
2026-04-07price $199,995
-
2026-03-07price $209,995
-
2026-03-07status Active
-
2026-02-13price $219,995
-
2026-01-28price $229,995
-
2026-01-17price $249,995
-
2025-09-22$289,995 Active
-
2025-07-31historical
-
2025-02-27$289,995 Active
-
2016-09-14soldstatus $60,000
-
2005-09-16soldstatus $148,000 239-char remark
Show marketing remark (239 chars)
Morongo Valley pool home. Cute large 1 BR. with den. Nat gas heat + wood stove. Nice private in ground pool. Garage and work shop. Full property fenced and cross fenced. Paved rd. 20 minutes to Palm Springs. A must see in this price range.
-
2005-09-16soldstatus $148,000
Show marketing remark (239 chars)
Morongo Valley pool home. Cute large 1 BR. with den. Nat gas heat + wood stove. Nice private in ground pool. Garage and work shop. Full property fenced and cross fenced. Paved rd. 20 minutes to Palm Springs. A must see in this price range.
-
2005-07-21historical 239-char remark
Show marketing remark (239 chars)
Morongo Valley pool home. Cute large 1 BR. with den. Nat gas heat + wood stove. Nice private in ground pool. Garage and work shop. Full property fenced and cross fenced. Paved rd. 20 minutes to Palm Springs. A must see in this price range.
-
2005-06-29$148,000 239-char remark
Show marketing remark (239 chars)
Morongo Valley pool home. Cute large 1 BR. with den. Nat gas heat + wood stove. Nice private in ground pool. Garage and work shop. Full property fenced and cross fenced. Paved rd. 20 minutes to Palm Springs. A must see in this price range.
-
1994-01-19soldstatus $47,000
ⓘ Source: listings_history table (triggers on properties + properties_extension) + one-shot
backfill from property_details.listing_events for pre-trigger history.
Tax reassessment forecast CA · Resets to sale price
- Current annual tax
- $1,051 · $88/mo
- Projected year-2 tax
- $1,520 · $127/mo
- Expected delta
- +$469/yr (+$39/mo · 44.6%)
ⓘ Screening estimate from a state-policy table — verify with the county assessor before closing.
Climate risk First Street
- Flood 1/10 Low FEMA zone A · 0% chance over 30 yrs
- Wildfire 7/10 Severe
- Heat 7/10 Severe 8 d/yr ≥102°F today · 22 d/yr by 30 yrs out
- Wind 1/10 Low
- Air quality 6/10 Major 11 unhealthy d/yr today · 15 by 30 yrs out
Nearby sold comps map
Loading sold comps map…
Walkable amenities ~0.75 mi
Loading nearby amenities…
Taxation est. · year 1
- Rental income
- $22,091
- − Mortgage interest
- −$11,203
- − Property taxes
- −$1,051
- − Insurance
- −$2,502
- − Repairs & maintenance
- −$1,767
- − Management
- −$1,767
- − Depreciation
- −$5,818
- Taxable loss
- −$2,018
- Est. tax savings @ 24.0%
- +$484
- After-tax cash flow
- $1,797/yr
For passive investors: Depreciation is non-cash, so a rental often shows a tax loss while cash-flowing — sheltering income. Rental losses are passive: they offset passive income freely, and up to $25,000/yr can offset ordinary (W-2) income if you actively participate and your MAGI is under $100k (phasing out to $0 by $150k); unused losses carry forward. On sale, claimed depreciation is recaptured at up to 25%, and gains may owe capital-gains tax (a 1031 exchange can defer both). Figures are a year-1 estimate at your 24.0% rate — not tax advice; consult a CPA.
Schools (NCES district)
- District
- Morongo Unified
- NCES district ID
- 0625860
- Math proficiency
- 15% ▼ -12.00%
- Reading proficiency
- 38% ▼ -3.00%
- Median HH income
- $39,399
- Composite
- 22.19/100
- National rank
- #8156
- State rank
- #395 of 517 in CA
Livability — Morongo Valley
- Score
- 62/100
- State rank
- #505
- US rank
- #17106
Category grades
Schools grade is shown separately in the Schools card above.
Census & demographics
- Census place
- Morongo Valley, CA
- Population (ZIP)
- 3,907
Population outlook (San Bernardino County) Hauer SSP2
- Today (2025)
- 2,300,329 people
- By 2030
- 2,378,907 · +3.4%
- By 2040
- 2,523,137 · +9.7%
- By 2050
- 2,642,388 · +14.9%
- By 2075
- 2,880,769 · +25.2%
- By 2100
- 2,909,436 · +26.5%
Race, ethnicity, and origin ACS 2023
- Neighborhood character
- Majority White (62%)
- Race & ethnicity
- White 62% Hispanic / Latino 31% Two or more races 12% Black 3% Native American 2%
- Hispanic origin (detail)
- Mexican 16% Cuban 4%
- Common ancestry
- Romanian 4% Italian 3% Lithuanian 2%
- Foreign-born
- 12% · Canada
- Languages at home
- 77% English-only · Spanish 19% German/W. Germanic 1% Tagalog/Filipino 1%
Political lean MEDSL · San Bernardino
- 2024 margin
- Toss-up / Even · D 47.5% · R 49.7% · Other 2.8%
- 2008→2024 swing
- -8.5pp toward R · 2008: 6.3pp · 2024: -2.1pp
- All cycles
- 2024: R+2.1 2020: D+10.7 2016: D+9.8 2012: D+5.4 2008: D+6.3
Not yet ingested
- Civics
- —
Market trends
- HPI YoY
- ▲ 5.61%
- Current HPI
- 526.1914
- Rent YoY
- —
- Metro
- —
- State GDP YoY
- ▲ 3.21%
- F500 in state
- 116
Industry mix (Fortune 500 HQ in CA)
| Industry | F500 HQs | Revenue |
|---|---|---|
| Technology | 27 | $1,492B |
|
||
| Financial Services | 3 | $174B |
|
||
| Retail | 3 | $44B |
|
||
| Insurance | 3 | $26B |
|
||
| Media / Entertainment | 2 | $115B |
|
||
| Pharmaceuticals / Biotech | 2 | $62B |
|
||
Price history
+325.5% since first listed16 events — show timeline
- 2026-04-20 Pending — GPSMLS
- 2026-04-07 Price Changed $199,995 GPSMLS
- 2026-03-07 Price Changed $209,995 GPSMLS
- 2026-03-07 Relisted — GPSMLS
- 2026-02-13 Price Changed $219,995 GPSMLS
- 2026-01-28 Price Changed $229,995 GPSMLS
- 2026-01-17 Price Changed $249,995 GPSMLS
- 2025-09-22 Listed $289,995 GPSMLS
- 2025-07-31 Listing Removed — GPSMLS
- 2025-02-27 Listed $289,995 GPSMLS
- 2016-09-14 Sold (Public Records) $60,000 Public Records
- 2005-09-16 Sold (Public Records) $148,000 Public Records
- 2005-09-16 Sold (MLS) $148,000 PALM
- 2005-07-21 Delisted — PALM
- 2005-06-29 Listed $148,000 PALM
- 1994-01-19 Sold (Public Records) $47,000 Public Records
Property tax history
-2.5%/yrLatest (2025): $1,051 · +4.3% YoY. Source: county tax records.
Cash-flow waterfall
monthlySold comps — $/sqft
last 12 mo · ≤1 miLoading sold comps…