1192 Chobee St · Buckhead Ridge, FL
Flood risk 4/10 · Minor
- FEMA flood zone
- X
- Chance of flooding over 30 yrs
- 0.22%
- Est. flood insurance / yr
- $507 – $1,088
Fire risk 3/10 · Minor
- Est. fire insurance / yr
- $947 – $1,759
Heat risk 9/10 · Severe
- Hot days now (above 107°F)
- 7 days/yr
- Hot days in 30 yrs
- 24 days/yr
Wind risk 10/10 · Severe
- Chance of severe wind over 30 yrs
- 99.0%
Air-quality risk 2/10 · Minimal
- Unhealthy air days now
- 2 days/yr
- Unhealthy air days in 30 yrs
- 2 days/yr
Risk factors via First Street. Map © Google.
Why this score? — see what drove the D- grade
The composite is a weighted blend of 9 inputs, each scored 0–100. Each bar is that input's sub-score; the figure is the points it added to the 100-point composite (weight × sub-score).
- Cash flow +15.6/30.0
- DSCR +4.8/10.0
- 1% rule +3.8/10.0
- Schools +3.3/10.0
- Livability +3.1/5.0
- Rent growth +2.5/5.0
- Condition / age +2.5/5.0
- ARV discount +0.0/15.0
- Appreciation +0.0/10.0
$224,900
🖨 Deal sheet (PDF) 📄 Offer letter ✓ Due diligence
Listing remarks MLS
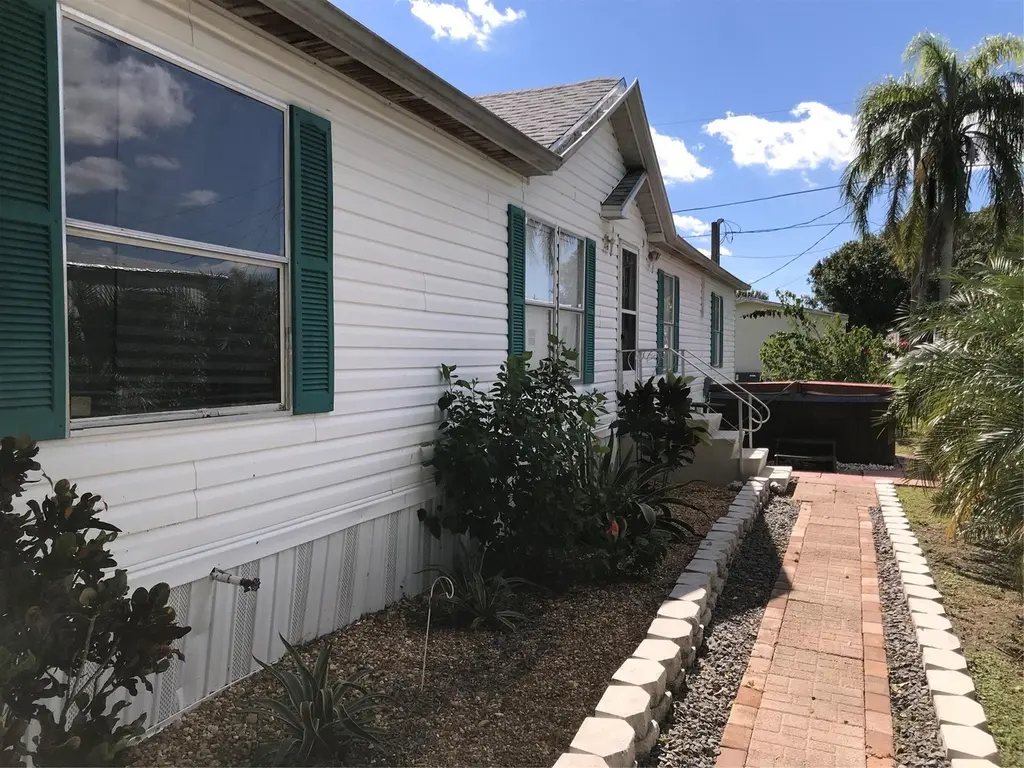
4 BEDROOM/ 2 FULL BATH LOCATED ON A DOUBLE LOT!! This home has plenty of room inside and out!! The entire home has been updated. The kitchen features stainless steel appliances, an island, new countertops, and all new floors throughout the home. New roof and air conditioner were replaced in 2022. The property is fenced with beautiful mature landscaping, hot tub, fire pit, privacy tree barrier. Call for your appointment today!! All measurements are approximate.
Key facts
- Fenced
- New countertops
- Mature landscaping
Tags
Neighborhood map
What this means for you Summary
Snapshot
- This is a 4-bed/2.0-bath manufactured listed at $225k.
Deal economics
- At list price, monthly cash flow is $94 ($1k/yr) — positive.
- The deal already cash-flows at list — no discount required.
- To meet the 1% rule (rent ≥ 1% of price), the offer needs to be $198k (11.8% below list).
- Recommended offer: $198k (11.8% below list) — sets the bar for 1% rule.
- Cap rate 6.8% vs local median 5.2% in Buckhead Ridge — top-decile yield for the area; either an underpriced asset or a hidden risk that comps aren't pricing in. Stress-test before assuming the spread holds.
Location & tenants
- Location reads 61/100 on livability (#785 in FL) — a middle-class / working-renter tenant base. Strengths: crime A+, cost of living A+, housing A+; Watch: amenities F, commute F, employment F.
- Glades (town): math 38% / reading 41% proficiency, ranked #63 of 73 in FL (top 86%) — families likely to look elsewhere, expect single-tenant / working-renter base with shorter leases.
- Zoned schools: Moore Haven Elementary School (math 17% / reading 27%, grade F, #2,080 of 2,144 statewide, top 97%, 375 students, 56% FRL) — zoned schools at 56% FRL track the district average.
- Zoned-school proficiency averages 22% at this address vs 40% district-wide (-18 pts) — the specific schools serving this property underperform the Glades average; the district grade overstates school quality for this exact location.
- Market conditions: 402 active listings in the ZIP; 65 units permitted in Glades County in 2024 (0 in 5+ unit buildings).
- This rent runs 45% of the median local income ($53k/yr) — at the standard rent-burdened threshold; future hikes will face affordability resistance.
Forward outlook
- Local home prices are declining (-3.0%/yr); year-one equity from $2k of loan paydown is wiped out by about $7k of value loss. Plan a longer hold.
- Glades County population projected at +15% by 2050 — long-run rental-demand tailwind backs the buy-and-hold thesis.
Negotiation context
- It's been on market 100 days — a 9% lower offer ($205k) is reasonable based on typical stale-listing flexibility.
- 2 sale attempts since 20y ago with the ask held roughly flat each time — persistent listings suggest the price (not the market) is what's stuck; bring a comps-based counter.
Risks & watch-outs
- Climate carrying-cost: severe wind risk, 99% chance of damaging wind over 30y; extreme-heat days projected 7→24/yr by 2055 (HVAC capex compounding) — expect insurance premiums to compound above CPI over the hold.
Questions for the listing agent
- It's been on market 100 days. Have you received any prior offers? Is the seller open to a 12% concession, seller financing, or rate buy-down credit?
- Why hasn't it sold? Are there any deal-killer items the seller is aware of (foundation, flood, title, zoning, code violations)?
- Is there a deadline driving the sale (1031 exchange, divorce, estate, relocation)? That informs how much negotiation room exists.
- Schools are F-rated, which usually means shorter tenancies and higher turnover. Who's the typical renter profile here, and what's been the actual vacancy rate?
- The area grade is low — what's the realistic commute time and amenity access for the typical tenant pool here? Any planned neighborhood developments (good or bad) we should know about?
- What's the average days-on-market for RENTAL listings here right now (not sales)? A rising rental-DOM trend means longer vacancies and softer asking-rent achievability than the comps imply.
- What's the recent tenant-quality profile in this submarket — average credit score on applications, eviction rate, late-payment / NSF rate, and stable-employment percentage? A property-management company in the area should have these aggregated.
- How much new for-sale + rental construction is in the pipeline within 1–3 miles? Heavy new supply typically softens prices + rents 12–24 months out; constrained supply supports both.
Investment metrics
- 1% rule
- 0.88% ✗
- Cap rate
- 6.80%
- Cash-on-cash
- 1.79%
- DSCR
- 1.08
- GRM
- 9.4
CMA / ARV
- ARV (median comp)
- $189,151
- List price
- $224,900
- Delta
- 18.90%
- Verdict
- OVERPRICED
- Comps
- 12 within 1.0 mi
Show comp detail 7 sales within ~0.75 mi
| Address | Dist | Beds/Ba | Sqft | Sold | Price | $/sf | Match |
|---|---|---|---|---|---|---|---|
| 1088 Peach St | 0.32mi | 3/2.0 (-1) | 1,376 (-8%) | 1mo | $175,000 | $127 | 67 |
| 1365 Chobee Loop | 0.19mi | 3/2.0 (-1) | 1,678 (+13%) | 2mo | $180,000 | $107 | 63 |
| 1173 Jordan Loop | 0.42mi | 3/2.0 (-1) | 1,450 (-3%) | 13mo | $240,000 | $166 | 60 |
| 1120 Bass St | 0.15mi | 3/2.0 (-1) | 1,680 (+13%) | 15mo | $260,000 | $155 | 54 |
| 1028 Peach Ln | 0.27mi | 3/2.0 (-1) | 1,316 (-12%) | 13mo | $230,000 | $175 | 53 |
| 1118 Trout St | 0.37mi | 3/2.0 (-1) | 1,667 (+12%) | 6mo | $300,000 | $180 | 52 |
| 1054 21st St | 0.51mi | 3/2.0 (-1) | 1,296 (-13%) | 2mo | $245,000 | $189 | 48 |
Match score weights: distance 35% · size 25% · config 20% · recency 20%. Top-matched comps best support the ARV.
Projected returns pro-forma
-3.0% appreciation · 3.0% rent growth · sell at horizon
- IRR
- -13.5%
- Equity multiple
- 0.52×
- Total profit
- $-30,468
- Equity at exit
- $33,533
- IRR
- -4.6%
- Equity multiple
- 0.70×
- Total profit
- $-18,893
- Equity at exit
- $19,445
Cash invested: $62,972 (down + closing). Projections, not guarantees.
Landlord ↔ Tenant lean methodology
- Overall (STATE)
- 87 Strongly Landlord-Friendly
- State Florida
- 87 Strongly Landlord-Friendly · R+3
- County
- — inherits STATE
- City
- — inherits STATE
ZIP-level market 34974
- Home prices YoY
- -15.6%
- Active inventory
- 402
- Price-to-rent
- 9.4×
Monthly cashflow live
- Estimated rent
- $1,984 medium interval (Pro) →
- Mortgage (P&I)
- −$1,179
- Tax from tax record
- −$200 /mo · $2,399/yr
- Insurance
- −$94
- HOA
- −$0
- Vacancy / Maint / Mgmt
- −$417
- Net cashflow
- $94
Break-even live
Sensitivity live
| Price | -10% $221 | -5% $158 | +0% $94 | +5% $30 | +10% $-33 |
|---|---|---|---|---|---|
| Rent | -10% $-63 | -5% $16 | +0% $94 | +5% $172 | +10% $251 |
| Rate | -1.0pp $207 | -0.5pp $151 | base $94 | +0.5pp $36 | +1.0pp $-23 |
UW: 25.0% down · 7.5% · 30yr · 1.5% tax · 5.0% vac · 8.0% maint · 8.0% mgmt
Financing live
Cash to close
- Down payment
- $56,225
- Closing costs
- $6,747
- Reserves months
- —
- Total cash needed
- —
Loan-product check · same deal, 3 products live
Conventional
25% down · 7.5% · 30yr
- Down + closing
- —
- Monthly P&I
- —
- Monthly cashflow
- —
- DSCR
- —
- Eligible?
- —
Personal DTI + credit; lowest rate.
DSCR
20% down · 8.5% · 30yr
- Down + closing
- —
- Monthly P&I
- —
- Monthly cashflow
- —
- DSCR
- —
- Eligible?
- —
No personal income docs; deal must DSCR.
Hard money
10% down · 12.0% · 12mo
- Down + closing
- —
- Monthly P&I
- —
- Monthly cashflow
- —
- DSCR
- —
- Eligible?
- —
Short-term bridge; refi at stabilization.
Listing history 21 events
-
2026-06-19days on market $224,900 Active 100 DOM
-
2026-06-18days on market $224,900 Active 99 DOM
-
2026-06-17days on market $224,900 Active 98 DOM
-
2026-06-16days on market $224,900 Active 97 DOM
-
2026-06-15days on market $224,900 Active 96 DOM
-
2026-06-14days on market $224,900 Active 94 DOM
-
2026-06-12days on market $224,900 Active 93 DOM
-
2026-06-09days on market $224,900 Active 90 DOM
-
2026-06-08days on market $224,900 Active 89 DOM
-
2026-06-07days on market $224,900 Active 88 DOM
-
2026-06-07days on market $224,900 Active 87 DOM
-
2026-06-03days on market $224,900 Active 84 DOM
-
2026-06-02days on market $224,900 Active 83 DOM
-
2026-06-01days on market $224,900 Active 82 DOM
-
2026-05-31days on market $224,900 Active 81 DOM
-
2026-05-30days on market $224,900 Active 80 DOM
-
2026-05-14price $224,900 464-char remark
Show marketing remark (464 chars)
4 BEDROOM/ 2 FULL BATH LOCATED ON A DOUBLE LOT!! This home has plenty of room inside and out!! The entire home has been updated. The kitchen features stainless steel appliances, an island, new countertops, and all new floors throughout the home. New roof and air conditioner were replaced in 2022. The property is fenced with beautiful mature landscaping, hot tub, fire pit, privacy tree barrier. Call for your appointment today!! All measurements are approximate.
-
2025-10-15$229,000 Active 464-char remark
Show marketing remark (464 chars)
4 BEDROOM/ 2 FULL BATH LOCATED ON A DOUBLE LOT!! This home has plenty of room inside and out!! The entire home has been updated. The kitchen features stainless steel appliances, an island, new countertops, and all new floors throughout the home. New roof and air conditioner were replaced in 2022. The property is fenced with beautiful mature landscaping, hot tub, fire pit, privacy tree barrier. Call for your appointment today!! All measurements are approximate.
-
2022-09-08soldstatus $204,000
-
2008-03-10historical
-
2006-08-09$175,000
ⓘ Source: listings_history table (triggers on properties + properties_extension) + one-shot
backfill from property_details.listing_events for pre-trigger history.
Tax reassessment forecast FL · Resets to sale price
- Current annual tax
- $2,399 · $200/mo
- Projected year-2 tax
- $2,399 · $200/mo
- Expected delta
- $0/yr ($0/mo · 0.0%)
ⓘ Screening estimate from a state-policy table — verify with the county assessor before closing.
Climate risk First Street
- Flood 4/10 Moderate FEMA zone X · 22% chance over 30 yrs
- Wildfire 3/10 Moderate
- Heat 9/10 Extreme 7 d/yr ≥107°F today · 24 d/yr by 30 yrs out
- Wind 10/10 Extreme 99% chance of damaging wind over 30 yrs
- Air quality 2/10 Low 2 unhealthy d/yr today · 2 by 30 yrs out
Nearby sold comps map
Loading sold comps map…
Walkable amenities ~0.75 mi
Loading nearby amenities…
Taxation est. · year 1
- Rental income
- $23,805
- − Mortgage interest
- −$12,598
- − Property taxes
- −$2,399
- − Insurance
- −$1,124
- − Repairs & maintenance
- −$1,904
- − Management
- −$1,904
- − Depreciation
- −$6,543
- Taxable loss
- −$2,668
- Est. tax savings @ 24.0%
- +$640
- After-tax cash flow
- $1,770/yr
For passive investors: Depreciation is non-cash, so a rental often shows a tax loss while cash-flowing — sheltering income. Rental losses are passive: they offset passive income freely, and up to $25,000/yr can offset ordinary (W-2) income if you actively participate and your MAGI is under $100k (phasing out to $0 by $150k); unused losses carry forward. On sale, claimed depreciation is recaptured at up to 25%, and gains may owe capital-gains tax (a 1031 exchange can defer both). Figures are a year-1 estimate at your 24.0% rate — not tax advice; consult a CPA.
Schools (NCES district)
- District
- Glades
- NCES district ID
- 1200660
- Math proficiency
- 38% ▼ -15.00%
- Reading proficiency
- 41% ▼ -5.00%
- Median HH income
- $36,758
- Composite
- 32.81/100
- National rank
- #5622
- State rank
- #63 of 73 in FL
Livability — Buckhead Ridge
- Score
- 61/100
- State rank
- #785
- US rank
- #17876
Category grades
Schools grade is shown separately in the Schools card above.
Census & demographics
- Census place
- Buckhead Ridge, FL
- County
- Okeechobee County · 23,975 people
- Metro
- Okeechobee, FL
- Population (ZIP)
- 23,975
- Household income
- $53,013
- Rent vs Own
- Severe rent burden
- 399.0
Population outlook (Glades County) Hauer SSP2
- Today (2025)
- 14,901 people
- By 2030
- 15,463 · +3.8%
- By 2040
- 16,341 · +9.7%
- By 2050
- 17,158 · +15.1%
- By 2075
- 18,881 · +26.7%
- By 2100
- 19,164 · +28.6%
Race, ethnicity, and origin ACS 2023
- Neighborhood character
- Predominantly White (74%)
- Race & ethnicity
- White 74% Hispanic / Latino 19% Two or more races 8% Asian 2% Black 2% Native American 1%
- Hispanic origin (detail)
- Mexican 12% Puerto Rican 1% Cuban 2%
- Common ancestry
- Lithuanian 2% Iranian 2% Italian 2%
- Foreign-born
- 11% · Canada, Jamaica
- Languages at home
- 81% English-only · Spanish 16% French/Haitian/Cajun 1% Other Indo-European 1%
Political lean MEDSL · Glades
- 2024 margin
- Solid R (+53.3) · D 23.1% · R 76.4%
- 2008→2024 swing
- -36.7pp toward R · 2008: -16.6pp · 2024: -53.3pp
- All cycles
- 2024: R+53.3 2020: R+46.2 2016: R+39.6 2012: R+18.6 2008: R+16.6
Not yet ingested
- Civics
- —
Market trends
- HPI YoY
- ▼ -64.47%
- Current HPI
- 348.6692
- Rent YoY
- —
- Metro
- Okeechobee, FL
- State GDP YoY
- ▲ 3.28%
- F500 in state
- 36
Industry mix (Fortune 500 HQ in FL)
| Industry | F500 HQs | Revenue |
|---|---|---|
| Industrial Technology | 2 | $29B |
|
||
| Insurance | 2 | $17B |
|
||
| Retail | 1 | $60B |
|
||
| Technology Distribution | 1 | $58B |
|
||
| Homebuilding | 1 | $35B |
|
||
| Technology Manufacturing | 1 | $35B |
|
||
Price history
+28.5% since first listed5 events — show timeline
- 2026-05-14 Price Changed $224,900 Beaches MLS
- 2025-10-15 Listed $229,000 Beaches MLS
- 2022-09-08 Sold (Public Records) $204,000 Public Records
- 2008-03-10 Listing Removed — Stellar MLS as Distributed by MLS Grid
- 2006-08-09 Listed $175,000 Stellar MLS as Distributed by MLS Grid
Property tax history
+21.2%/yrLatest (2025): $2,399 · +5.5% YoY. Source: county tax records.
Cash-flow waterfall
monthlySold comps — $/sqft
last 12 mo · ≤1 miLoading sold comps…