 🌊 Lakefront
1042 Runaway Bay Rd · Motley, VA
Flood risk 1/10 · Minimal
- FEMA flood zone
- X (unshaded)
- Chance of flooding over 30 yrs
- 0.0%
- Est. flood insurance / yr
- $473 – $860
Fire risk 3/10 · Minor
- Est. fire insurance / yr
- $666 – $1,236
Heat risk 5/10 · Moderate
- Hot days now (above 102°F)
- 7 days/yr
- Hot days in 30 yrs
- 18 days/yr
Wind risk 2/10 · Minimal
- Chance of severe wind over 30 yrs
- 3.0%
Air-quality risk 2/10 · Minimal
- Unhealthy air days now
- 1 days/yr
- Unhealthy air days in 30 yrs
- 1 days/yr
Risk factors via First Street. Map © Google.
Why this score? — see what drove the B- grade
The composite is a weighted blend of 9 inputs, each scored 0–100. Each bar is that input's sub-score; the figure is the points it added to the 100-point composite (weight × sub-score).
- Cash flow +22.6/30.0
- ARV discount +15.0/15.0
- DSCR +7.2/10.0
- Appreciation +6.4/10.0
- Schools +5.2/10.0
- 1% rule +4.9/10.0
- Livability +3.0/5.0
- Rent growth +2.5/5.0
- Condition / age +2.5/5.0
$485,000
🖨 Deal sheet 📄 Offer letter ✓ Due diligence
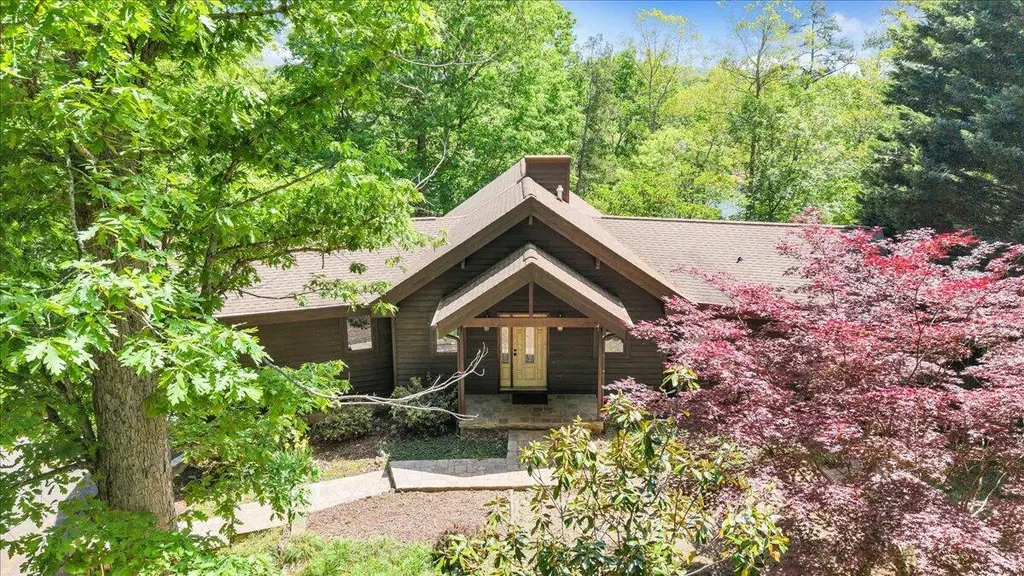
Listing remarks
With its iconic A-frame architecture, soaring cathedral ceilings, and expansive main channel views, the home offers the perfect blend of rustic warmth and timeless waterfront appeal. Designed for comfortable entry-level living, the interior is filled with natural sunlight that pours through the dramatic wall of windows, bringing the beauty of the outdoors inside. Warm wood accents, inviting gathering spaces, and tranquil lake views create an atmosphere that feels both cozy and unforgettable -- the kind of place where generations of lake memories are made. The lower-level stamped concrete patio provides the perfect setting for quiet mornings, evening gatherings, or simply relaxing while surr
Key facts
- Main channel views
- Lake views
- Cathedral ceilings
Tags
Property features AI
Finance
- Other: Lot of approximately 2.86 acres
- HOA & community: Homeowners association with annual fee of $550
Exterior
- Parking: 2 covered parking spaces
- Utilities: Has heating; Has cooling
- Home design: Residential property; Built in 2002
- Exterior features: Waterfront on Leesville Lake (main channel)
Interior
- Bedrooms: 2 bedrooms total; 1 main-level bedroom
- Flooring: Tile flooring; Wood flooring
- Bathrooms: 2 full bathrooms; 1 half bathroom; 1 main-level bathroom
- Heating & cooling: Heat pump electric heating; Heat pump electric cooling
- Interior features: 8 total rooms; Fiberglass full-view doors; Tile and wood flooring; Fireplace (1)
Neighborhood map
What this means for you Summary
Snapshot
- This is a 2-bed/2.5-bath single-family listed at $485k.
Deal economics
- At list price, monthly cash flow is $824 ($10k/yr) — positive.
- The deal already cash-flows at list — no discount required.
- To meet the 1% rule (rent ≥ 1% of price), the offer needs to be $480k (1.0% below list).
- Recommended offer: $480k (1.0% below list) — sets the bar for 1% rule.
- Cap rate 8.3% vs local median 3.9% in Motley — top-decile yield for the area; either an underpriced asset or a hidden risk that comps aren't pricing in. Stress-test before assuming the spread holds.
Location & tenants
- Location reads 60/100 on livability (#446 in VA) — a middle-class / working-renter tenant base. Strengths: cost of living A+, housing A+; Watch: crime C-, health & safety C-, schools F.
- Campbell County Public School District (rural): math 55% / reading 68% proficiency, ranked #55 of 131 in VA (top 42%) — acceptable for families but not a draw, mixed tenant base, ~2y average lease.
- Market conditions: 61 active listings in the ZIP; 1 comparable units currently listed for rent nearby; 315 units permitted in Campbell County in 2024 (51 in 5+ unit buildings).
Forward outlook
- In year one you build about $17k of equity ($3k loan paydown + $14k appreciation (2.9% local appreciation)).
- Campbell County population projected to shrink 6% by 2050 — rents likely to lag national; underwrite the cash flow, not the appreciation.
- At projected returns (2.9% appreciation + 3.0% rent growth), your $136k cash investment doubles in ~5 years — after that, you're playing with house money.
- By year 3, paydown + projected appreciation supports a ~$43k cash-out refi (75% LTV) — recoverable capital for the next deal without selling this one.
Negotiation context
- Only 14 days on market — expect competitive offers; lowballing is unlikely to land.
- Current owner paid $60k; list at $485k implies a 710% gain — meaningful room to come down on a strong offer.
Risks & watch-outs
- Climate carrying-cost: extreme-heat days projected 7→18/yr by 2055 (HVAC capex compounding) — expect insurance premiums to compound above CPI over the hold.
Questions for the listing agent
- What does the HOA fee cover, when was the last increase, and are there any pending special assessments or reserve-fund shortfalls?
- Is there a deadline driving the sale (1031 exchange, divorce, estate, relocation)? That informs how much negotiation room exists.
- Schools are F-rated, which usually means shorter tenancies and higher turnover. Who's the typical renter profile here, and what's been the actual vacancy rate?
- This sits on a lake — are riparian / water-frontage rights deeded with the parcel? Any dock permits, shoreline easements, or HOA water-use restrictions?
- What's the documented flood / surge / shoreline-erosion history here (FEMA AND non-FEMA — e.g., storm surge, creek backup, septic-field saturation)?
- Any water-quality or seasonal algae-bloom issues that affect tenant satisfaction or short-term-rental demand?
- What's the average days-on-market for RENTAL listings here right now (not sales)? A rising rental-DOM trend means longer vacancies and softer asking-rent achievability than the comps imply.
- What's the recent tenant-quality profile in this submarket — average credit score on applications, eviction rate, late-payment / NSF rate, and stable-employment percentage? A property-management company in the area should have these aggregated.
- How much new for-sale + rental construction is in the pipeline within 1–3 miles? Heavy new supply typically softens prices + rents 12–24 months out; constrained supply supports both.
Investment metrics
- 1% rule
- 0.99% ✗
- Cap rate
- 8.33%
- Cash-on-cash
- 7.28%
- DSCR
- 1.32
- GRM
- 8.4
CMA / ARV
- ARV (median comp)
- $592,700
- List price
- $485,000
- Delta
- -18.17%
- Verdict
- UNDERPRICED
- Comps
- 3 within 1.0 mi
Show comp detail 1 sale within ~0.75 mi
| Address | Dist | Beds/Ba | Sqft | Sold | Price | $/sf | Match |
|---|---|---|---|---|---|---|---|
| 320 Island Point Dr | 0.29mi | 3/2.5 (+1) | 2,327 (-2%) | 11mo | $585,000 | $251 | 69 |
Match score weights: distance 35% · size 25% · config 20% · recency 20%. Top-matched comps best support the ARV.
Projected returns pro-forma
2.88% appreciation · 3.0% rent growth · sell at horizon
- IRR
- 14.0%
- Equity multiple
- 1.79×
- Total profit
- $107,538
- Equity at exit
- $214,687
- IRR
- 15.9%
- Equity multiple
- 3.31×
- Total profit
- $313,131
- Equity at exit
- $328,247
Cash invested: $135,800 (down + closing). Projections, not guarantees.
Landlord ↔ Tenant lean methodology
- Overall (STATE)
- 55 Moderately Landlord-Leaning
- State Virginia
- 55 Moderately Landlord-Leaning · D+2
- County
- — inherits STATE
- City
- — inherits STATE
ZIP-level market 24571
- Home prices YoY
- 1.8%
- Active inventory
- 61
- Price-to-rent
- 8.4×
Monthly cashflow live
- Estimated rent
- $4,800 medium interval (Pro) →
- Mortgage (P&I)
- −$2,543
- Tax from tax record
- −$177 /mo · $2,122/yr
- Insurance
- −$202
- HOA
- −$46
- Vacancy / Maint / Mgmt
- −$1,008
- Net cashflow
- $824
Break-even live
UW: 25.0% down · 7.5% · 30yr · 1.5% tax · 5.0% vac · 8.0% maint · 8.0% mgmt
Financing live
Cash to close
- Down payment
- $121,250
- Closing costs
- $14,550
- Reserves months
- —
- Total cash needed
- —
Loan-product check · same deal, 3 products live
Conventional
25% down · 7.5% · 30yr
- Down + closing
- —
- Monthly P&I
- —
- Monthly cashflow
- —
- DSCR
- —
- Eligible?
- —
Personal DTI + credit; lowest rate.
DSCR
20% down · 8.5% · 30yr
- Down + closing
- —
- Monthly P&I
- —
- Monthly cashflow
- —
- DSCR
- —
- Eligible?
- —
No personal income docs; deal must DSCR.
Hard money
10% down · 12.0% · 12mo
- Down + closing
- —
- Monthly P&I
- —
- Monthly cashflow
- —
- DSCR
- —
- Eligible?
- —
Short-term bridge; refi at stabilization.
Rent comps 1 comps
| Address | Beds | Baths | Sqft | Rent | $/sqft | DOM | Units | Dist |
|---|---|---|---|---|---|---|---|---|
| 308 Acres Ct Lynch Station, VA | 3.0 | 3.5 | 3144 | $4,800 | $1.53 | 13d | 1 | 1.11mi |
HOA detail
- Monthly dues
- $46 · $552/yr
- Likely covers
- water
Listing history 2 events
-
2026-05-08$485,000 Active 1239-char remark
-
1998-10-06soldstatus $59,880
ⓘ Source: listings_history table (triggers on properties + properties_extension) + one-shot
backfill from property_details.listing_events for pre-trigger history.
Tax reassessment forecast VA · Resets to sale price
- Current annual tax
- $2,122 · $177/mo
- Projected year-2 tax
- $3,977 · $331/mo
- Expected delta
- +$1,855/yr (+$155/mo · 87.4%)
ⓘ Screening estimate from a state-policy table — verify with the county assessor before closing.
Climate risk First Street
- Flood 1/10 Low FEMA zone X (unshaded) · 0% chance over 30 yrs
- Wildfire 3/10 Moderate
- Heat 5/10 Major 7 d/yr ≥102°F today · 18 d/yr by 30 yrs out
- Wind 2/10 Low 3% chance of damaging wind over 30 yrs
- Air quality 2/10 Low 1 unhealthy d/yr today · 1 by 30 yrs out
Nearby sold comps map
Loading sold comps map…
Walkable amenities ~0.75 mi
Loading nearby amenities…
Taxation est. · year 1
- Rental income
- $57,600
- − Mortgage interest
- −$27,168
- − Property taxes
- −$2,122
- − Insurance
- −$2,425
- − Repairs & maintenance
- −$4,608
- − Management
- −$4,608
- − HOA
- −$552
- − Depreciation
- −$14,109
- Taxable income
- $2,009
- Est. tax owed @ 24.0%
- −$482
- After-tax cash flow
- $9,402/yr
For passive investors: Depreciation is non-cash, so a rental often shows a tax loss while cash-flowing — sheltering income. Rental losses are passive: they offset passive income freely, and up to $25,000/yr can offset ordinary (W-2) income if you actively participate and your MAGI is under $100k (phasing out to $0 by $150k); unused losses carry forward. On sale, claimed depreciation is recaptured at up to 25%, and gains may owe capital-gains tax (a 1031 exchange can defer both). Figures are a year-1 estimate at your 24.0% rate — not tax advice; consult a CPA.
Schools (NCES district)
- District
- Campbell County Public School District
- NCES district ID
- 5100600
- Math proficiency
- 55% ▼ -29.00%
- Reading proficiency
- 68% ▼ -11.00%
- Median HH income
- $45,915
- Composite
- 51.88/100
- National rank
- #1656
- State rank
- #55 of 131 in VA
Livability — Motley
- Score
- 60/100
- State rank
- #446
- US rank
- #19122
Category grades
Schools grade is shown separately in the Schools card above.
Census & demographics
- Population (ZIP)
- 2,073
Population outlook (Campbell County) Hauer SSP2
- Today (2025)
- 56,306 people
- By 2030
- 56,366 · +0.1%
- By 2040
- 55,406 · -1.6%
- By 2050
- 53,011 · -5.9%
- By 2075
- 45,932 · -18.4%
- By 2100
- 36,029 · -36.0%
Race, ethnicity, and origin ACS 2023
- Neighborhood character
- Predominantly White (77%)
- Race & ethnicity
- White 77% Two or more races 9% Black 9% Hispanic / Latino 5% Asian 1% Pacific Islander 1%
- Common ancestry
- Slovak 4% Italian 2% Portuguese 1%
- Foreign-born
- 4% · Canada, China
- Languages at home
- 95% English-only · Spanish 3% Chinese 1% Other Asian/Pacific 1%
Political lean MEDSL · Campbell
- 2024 margin
- Solid R (+48.6) · D 25.3% · R 73.9%
- 2008→2024 swing
- -12.3pp toward R · 2008: -36.2pp · 2024: -48.6pp
- All cycles
- 2024: R+48.6 2020: R+44.1 2016: R+47.2 2012: R+39.4 2008: R+36.2
Not yet ingested
- Civics
- —
Market trends
- HPI YoY
- ▲ 2.88%
- Current HPI
- 164.3696
- Rent YoY
- —
- Metro
- —
- State GDP YoY
- ▲ 2.40%
- F500 in state
- 50
Industry mix (Fortune 500 HQ in VA)
| Industry | F500 HQs | Revenue |
|---|---|---|
| Aerospace / Defense | 4 | $236B |
|
||
| Technology / Defense | 3 | $32B |
|
||
| Financial Services | 2 | $176B |
|
||
| Utilities | 2 | $27B |
|
||
| Insurance | 2 | $25B |
|
||
| Technology | 2 | $15B |
|
||
Price history
+710.0% since first listed3 events — show timeline
- 2026-05-22 Pending — MLSRV
- 2026-05-08 Listed $485,000 MLSRV
- 1998-10-06 Sold (Public Records) $59,880 Public Records
Property tax history
+0.1%/yrLatest (2025): $2,122 · +0.0% YoY. Source: county tax records.
Cash-flow waterfall
monthlySold comps — $/sqft
last 12 mo · ≤1 miLoading sold comps…